
Abstract
The continuous movement of ground water in sandstone hosted uranium deposits renders them subject to disequilibrium between uranium and its daughter products. This is important when wireline gamma logging alone is used to quantify the presence of uranium which can be over- or under-estimated by a significant percentage. The problem can be overcome by logging using the prompt fission neutron (PFN) tool which directly measures the presence of uranium through neutron activation. PFN technology is also superior to core drilling and assay as it provides a larger sample, is less expensive and is instantaneous, allowing drilling programs to proceed uninterrupted. Examples are presented from uranium deposits in Australia and the USA demonstrating disequilibrium, and the use of PFN to map uranium throughout a deposit and to set the screens in in situ leach mining.
Introduction
Sandstone-hosted uranium deposits, which include uranium rolls, tabular, channel hosted and structurally controlled types (Dahlkamp, 1993) constitute 45% of the world's mined uranium production (IAEA, 2012). Generally these deposits are Cretaceous or younger in age, weakly deformed, flat lying and contain abundant ground water. This allows them to be mined using the in situ leach (ISL) or in situ recovery technique using a bore field of injection and extraction wells. An acid or alkali leach is used to extract the loosely bound uranium particles, typically coffinite, uraninite and pitchblende. Examples of operating ISL mines include Beverley and Honeymoon in South Australia, Smith Ranch and Crowe Butte in Wyoming, USA and many deposits in Kazakhstan, Uzbekistan and Russia.
The porous nature of sandstone host rocks in channel uranium deposits presents problem for explorers and miners when they attempt to quantify the grade of uranium in the deposit using borehole logging techniques; the major problem is disequilibrium. The disequilibrium problem is most acute when gamma logging alone is used as a proxy for uranium, because gamma logging measures the gamma radiation emitted by the daughter products of the decay of natural uranium isotopes. Those daughter products are principally 214Bi and to a lesser extent 214Pb (Fig. 1). Because of the continuous (or even intermittent) movement of ground water within the deposit the parent uranium atoms can become physically separated from their daughter products due to their different solubilities. When daughter products and uranium are not subject to physical separation they are said to be in secular equilibrium and this state can be achieved, after separation, in approximately 2·4 million years. For instance 214Bi reaches 99·9% equilibrium with 234U, a daughter product of 238U decay (Fig. 1), after 2·47 million years, which is ten half lives of 234U. If ground water movement and separation is continuous then secular equilibrium will never be achieved.
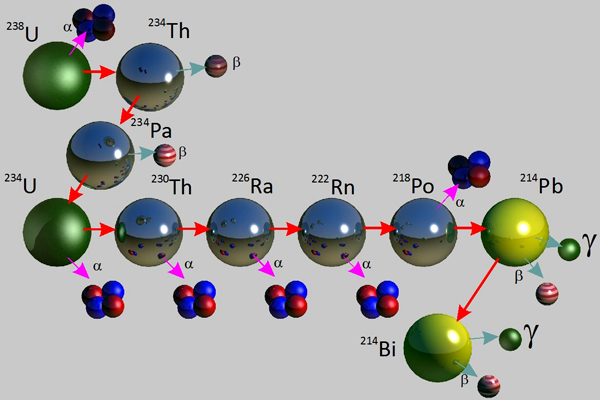
Part of the 238U radioactive decay chain showing emission products including the principle emitter of gamma (γ) radiation 214Bi
Gamma radiation may be produced from a variety of different radioactive decay series, including 40K, 238U and 232Th. Given that the energy level of the gamma radiation is unique in each step in the radioactive decay chain, it is possible to differentiate the source of the gamma radiation. Spectral gamma probes have been devised which measure the energy level of the gamma radiation and hence can quantify the amount of 238U; however, this still requires 238U to be in equilibrium with its daughter products.
Sandstone-hosted uranium deposits are not the only uranium deposits to display disequilibrium. Calcrete-hosted and evaporate-salt pan deposits also frequently have disequilibrium due to episodic flooding events and extreme near-surface leaching.
The prompt fission neutron tool
The PFN tool addresses the technology gap for disequilibrium (Brooks, 2008). With the PFN tool, a pulsed neutron source electronically generates high energy neutrons which cause immediate or prompt fission of 235U in the rock formation (Fig. 2). The thermal and epithermal neutrons returning to the tool from the formation are counted in separate detector channels to provide a measure of 235U, minimising variations in neutron output and borehole factors common to both channels. As the 235U isotope constitutes 0·711% of naturally occurring uranium and is in constant isotopic equilibrium with 238U in the natural environment the calculation of the total uranium content of the rock is straightforward. Using the PFN tool the lowest practical uranium grade measurement is around 0·02%.
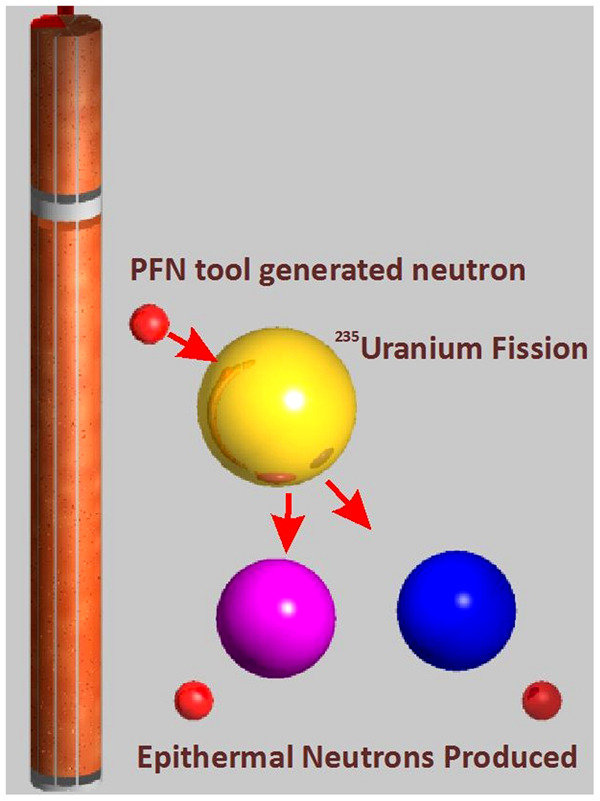
PFN tool uses neutron bombardment and splitting of 235U to measure uranium
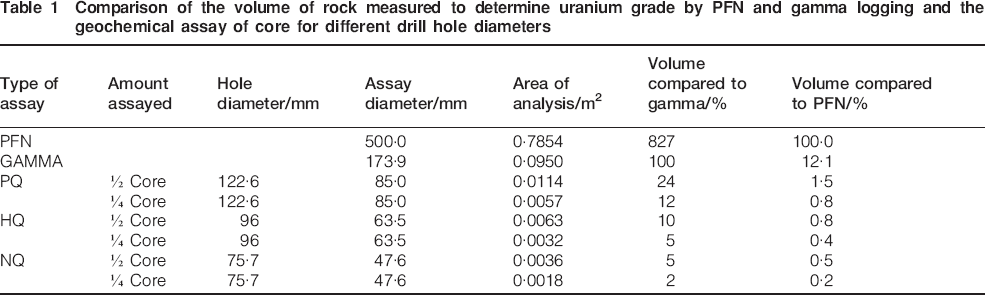
One of the significant advantages of PFN logging is that it provides an immediate uranium assay at the time of logging. It also measures the uranium content of a much greater volume of rock than either assayed half core or gamma logging (Table 1). However, because of the difference in volumes, exact comparisons cannot be made between the different techniques. Nevertheless, the PFN method samples the greatest volume and thereby reduces the risk of inhomogeneity in small samples.
Comparison of the volume of rock measured to determine uranium grade by PFN and gamma logging and the geochemical assay of core for different drill hole diameters
The PFN wireline tool assembly is 3 m long and has a diameter of 70 mm, so it can operate in holes from HQ core size upwards. Typically, it is used in open-hole, mud-rotary or RC percussion drilled holes. The assembly includes a gamma tool so that PFN and gamma plots can be instantly compared (Figs. 3 and 4). The PFN tool does not contain a radioactive source that would require shielding as the neutron generation is only activated when the tool is in the hole and powered on. The logging rate is more than 1 m per minute which compares well with normal gamma logging rates.
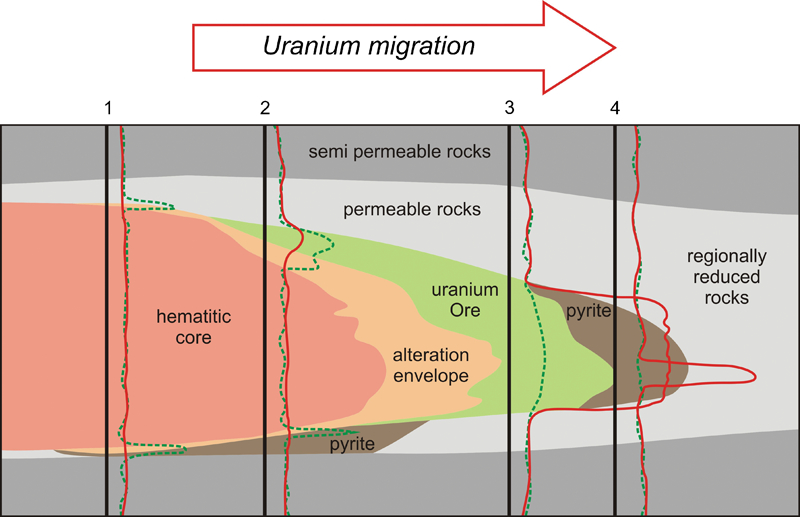
PFN (red) and gamma (green-dashed) wireline logs in four boreholes across an idealised roll front uranium deposit
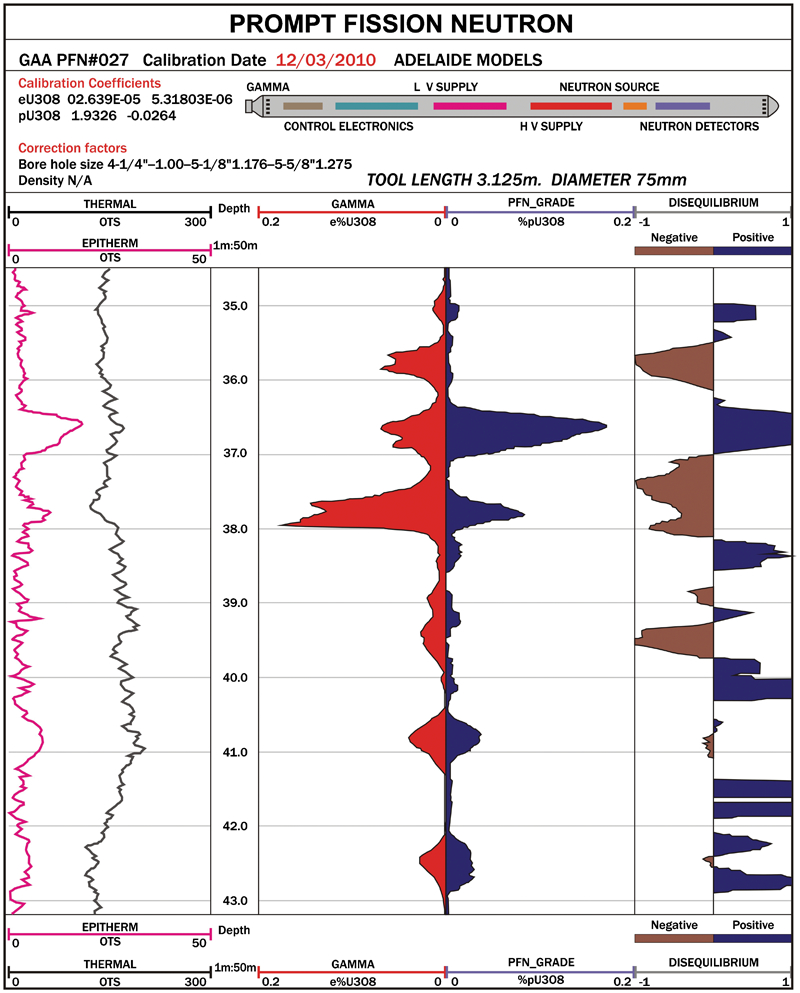
PFN-gamma log from an Australian uranium project showing positive and negative disequilibrium in a single borehole
As with all geophysical tools, calibration against known standards is required. In Australia, this is frequently established at a mine site by burying drums with a range of known uranium concentrations as a series of dummy boreholes. A cored exploration drill hole can also be used repeatedly as a calibration hole. In Adelaide, South Australia, the Glenside facility provides a set of reference boreholes and these are also present in the US at facilities in Casper, Wyoming, Grand Junction in Colorado, and George West in Texas.
Strongly saline water and PVC piping, commonly used to line bore holes, mask the effectiveness of the neutrons because of the presence of the chlorine atom. For instance, the absorption of neutrons by sea water is 56% greater than fresh water. In practical situations, PFN still works in saline water and can provide an accurate measure of uranium with correct calibration. In the latest PFN tools (i.e. Generation 3) porosity is also measured as it is a function of the volume of water in the hole, with corrections applied for borehole diameter and salinity.
Measuring disequilibrium and uranium content
In practical examples, the measured grade calculation made from gamma logging can either be in positive disequilibrium or negative disequilibrium. In the case of positive disequilibrium, the uranium may have moved into an area of low emitting gamma, but the uranium concentration may in fact be very high. Negative disequilibrium is where the uranium concentration is low but the gamma response is high. The concept is illustrated for an idealised roll-front uranium deposit (Fig. 3) and on the PFN and gamma log trace (Fig. 4). In the idealised roll-front deposit, uranium is being deposited in an alteration front with groundwater moving through the porous sandstone. Uranium in the wings of the deposit is constantly being removed and re-deposited in the front, leaving the gamma emitting daughter elements behind in the wings. The uranium in the front is in positive disequilibrium and that in the wings, negative.
In real situations, the distribution of positive and negative disequilibrium can be much more complex, and the log from a deposit in South Australia shows a number of repeated zones (Fig. 4). In this example of strong positive disequilibrium, PFN measures grades up to 1500 ppm pU3O8, whereas the gamma reading at the same depth (36·5 m) is only 500 ppm eU3O8. Conversely, the strongest negative disequilibrium shows gamma estimates of 2000 ppm eU3O8, but only 700 ppm pU3O8 with PFN. Whereas these may be fairly extreme examples it is not uncommon to document disequilibrium values from 5 to 50% in many deposits.
Case study: South Texas project
Data from a sandstone-hosted uranium project in south Texas provide a comparison of PFN and spectral gamma data collected over 57 holes including three cored holes with analytical data. The dataset provides an illustration of many of the issues encountered with disequilibrium, and the data are presented in contour plans and stacked sections revealing trends (Figs. 5–7).
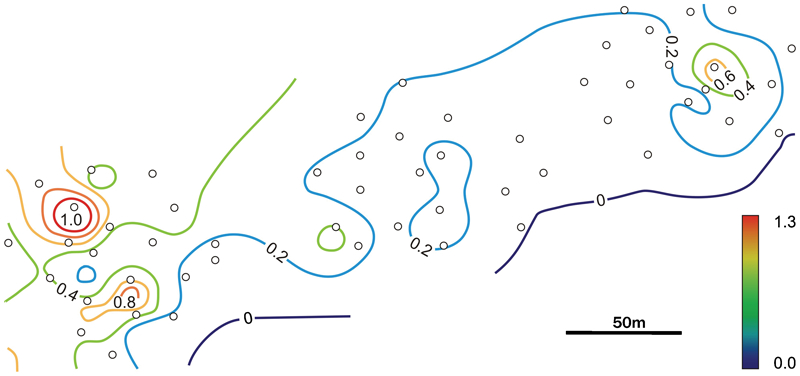
Contour map of the vertical separation (in metres) of the peak gamma and PFN response from a project in Texas. White dots are drill holes
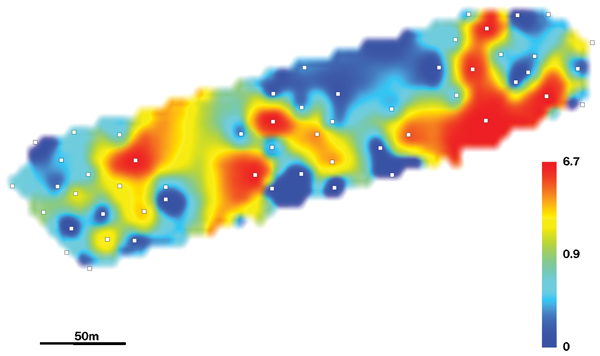
Difference between GT calculated from PFN logs minus GT calculated from spectral gamma logs measured in m%U3O8. Note that the difference is not uniform throughout the deposit. This image maps out the underestimated uranium derived from gamma logging using a significant disequilibrium correction factor
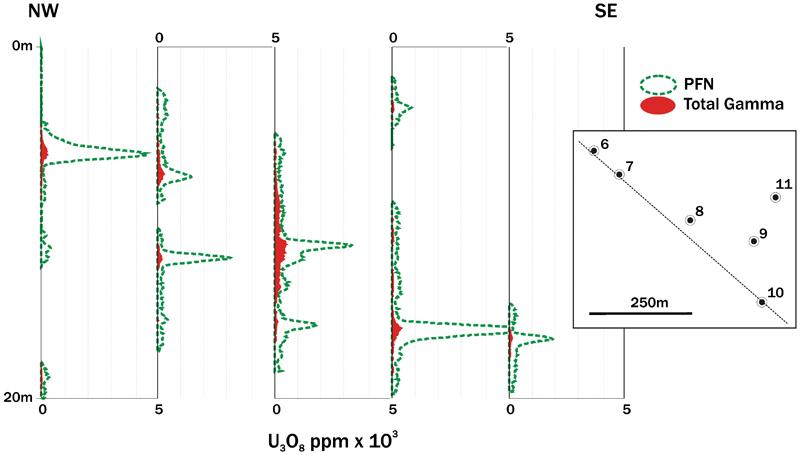
South Texas example of a traverse of boreholes through a deposit showing strong disequilibrium
Vertical separation of gamma and PFN peaks
Disequilibrium may not only cause problems during exploration, when defining resources, but also later during mine development and production. It can be particularly problematic when conducting ISL mining due to the vertical offset of the orebody compared to the daughter product gamma response. Fig. 8 is a log from south Texas showing significant vertical offset from the gamma peak to the uranium peak, as determined by both assay data and PFN logging. There is a strong correlation of core assay and PFN.
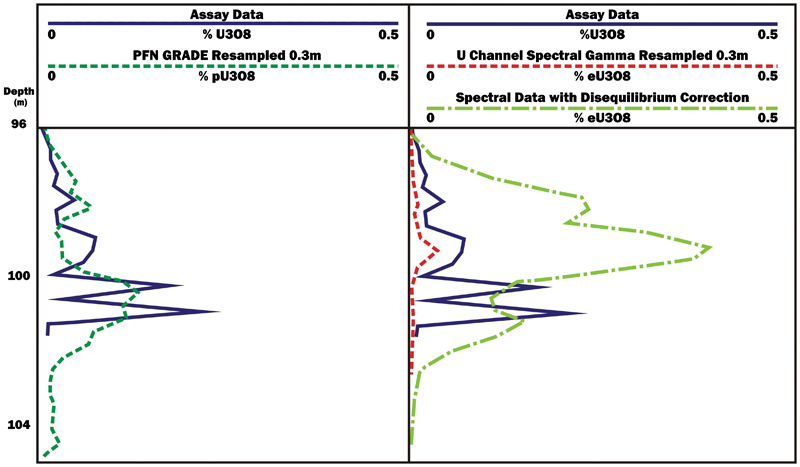
PFN (left – dashed) and assay (solid) compared with spectral gamma (right – dashed) and corrected spectral gamma (dash and dot) logs, actual example from a sandstone-hosted uranium project in south Texas
The vertical offset of the peak from both the PFN and spectral gamma logs for the whole data set is presented as a contour plan (Fig. 5). This information is vital when positioning the screens in the borehole linings to direct the leaching fluids to the correct horizon to maximise uranium production in an ISL mine. Due to the presence of aquitards in a formation, the leaching fluids may not penetrate to the correct horizon where the uranium is present and so the precise location is required to set the screens.
Use of multipliers and polynomial functions to estimate uranium grade from gamma logs
In an attempt to correct for the effect of disequilibrium, geologists have in the past used a disequilibrium factor gained from comparing core with the gamma results. This multiplier is then applied to the gamma logs from all the drill holes throughout the deposit in an attempt to quantify the amount of uranium present. Due to the considerable positive disequilibrium found at the south Texas deposit, a polynomial function was applied to the spectral gamma results in an attempt to counter for the lack of gamma response compared to the core analytical data and PFN results. However, Fig. 8 demonstrates a problem with this method as the uranium is not located in the same vertical position as the gamma peak and furthermore, disequilibrium is not necessarily uniform either laterally or vertically throughout a deposit and so there will be quantitative uncertainty in any resource estimate (Fig. 5).
Using grade thickness (GT) to map the distribution of disequilibrium
The three cored holes, spread equally across the deposit, were utilised to compute the correction factor for the spectral gamma logs as demonstrated (Fig. 8). In each hole, both PFN and spectral gamma logs were examined with a 300 ppm U3O8 cut off applied to anomalies greater than 90 cm (3 feet) in thickness. The average of the logged interval was then multiplied by the thickness to produce a pseudo grade thickness (GT is m%U3O8. It is calculated by multiplying the interval in metres by the average grade of the interval.) in each hole. The GT was then mapped across the deposit for both the PFN and spectral gamma (with a significant disequilibrium correction function applied).
There is a difference in the GT calculation of the PFN and the GT from the spectral gamma logs (Fig. 6). Despite utilising the disequilibrium correction factor, there is a sizable difference throughout the deposit both in the quantity (uranium is underestimated by the spectral gamma) and the spatial variation. This indicates that disequilibrium is not uniform throughout the deposit and cannot be easily adjusted by a mathematical formula.
Assuming that a low gamma response means no uranium
Low to moderate gamma responses may not be used to assume the absence of significant uranium mineralisation (Fig. 7). All the calibrated gamma values, without correction factor, are below 500 ppm eU3O8 across the entire cross-section, whereas the PFN response measures uranium over 5000 ppm pU3O8. This supports the requirement of a direct assay measurement such as the PFN tool to quantify and define orebodies in areas of known (and unknown) disequilibrium.
Application of PFN technology for reporting uranium resources
PFN technology was originally patented in 1979 (Givens and Stromswold, 1989) and the technology started regular use in the United States and subsequently at the Beverley uranium mine in South Australia in the late 1990s. The use of calibrated PFN data to help establish resources at sandstone-hosted uranium deposits including ISL operations is well established (McKay et al., 2007). PFN derived uranium assay results are, by convention, expressed as % pU3O8. At the Honeymoon uranium project PFN tools were regularly calibrated in calibration pits and compared against XRF core assays (Skidmore, 2007). Recent examples of the presentation of PFN results in Australian Stock Exchange announcements, documenting disequilibrium, include the Lance uranium project in Wyoming (Peninsula Energy Limited, 2012), the Theseus Prospect in Western Australia (Toro Energy Limited, 2012) and Blackbush in South Australia (UraniumSA Limited, 2012). At the Oban project in South Australia PFN and gamma data were used to demonstrate that the mineralisation is in equilibrium (Curnamona Energy Limited, 2009).
Conclusions
The PFN tool provides an instant and robust method of determining uranium concentration in boreholes and overcomes the problem of disequilibrium in uranium deposits inherent in the use of gamma logging alone to determine uranium resources and their distribution. The irregular distribution of disequilibrium in many sandstone-hosted uranium deposits supports the regular use of PFN along with gamma logging, both during the resource definition phase and to set the screens in ISL mining, due to the frequent vertical offset of gamma and PFN peaks.
Footnotes
This paper is part of a special issue on uranium deposits and in-situ leaching