
Abstract
This personal view tracks the phenomenon of granitic magmatism from the source materials through partial melting, melt segregation, magma ascent and emplacement to the mechanisms by which granitic plutons acquire their main chemical heterogeneities. Readers should bear in mind that, although the work deals specifically with plutonic felsic magmatism, most of the conclusions also apply to the genesis and evolution of felsic volcanic magmas. Major conclusions are that: the majority of granitic magmas are formed mainly by crustal melting under fluid-absent conditions; the magmas segregate rapidly and efficiently from their solid residues, initially carrying small amounts of peritectic crystals; they ascend by fracture pathways and in pulses to inflate mainly tabular bodies that we call batholiths; and that the main internal variations in these bodies are not due to differentiation or magma mixing, but are inherited from the heterogeneous magma pulses that reflect source melting reactions and peritectic mineral entrainment.
Part 1: Genesis
Introduction
You may ask, ‘Of what importance is granite?’. If we take an imaginary journey through our solar system, we can visit terrestrial planets like Venus and Mars, our Moon and various rocky satellites orbiting the outer gas giants. In all these places, there are marvels and ‘geological’ wonders but, as far as we have been able to discover, none of these worlds has any true granite (a usually coarse-grained igneous rock containing quartz and feldspar, with minor hydrous minerals such as muscovite, biotite and hornblende). Earth is unique in having these rocks – the fundamental stuff of continents. In some parts of the world (e.g. south-eastern Australia and south-eastern China) granitic rocks make up 40–50% of the exposed crust (Fig. 1).
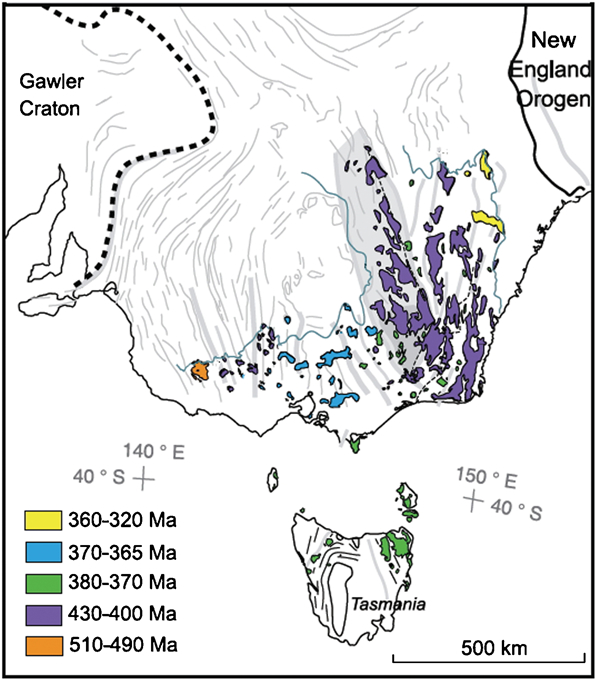
Map showing the outcrop areas and ages of granitic intrusive rocks in the Lachlan orogen of southeastern Australia, reproduced from Fig. 3c of Foster and Gray (2008)
Another unique aspect of Earth is its combination of active plate tectonics (though Mars has or had a rudimentary form) and a 70% covering of liquid H2O. It is also unique (as far as we know) in supporting DNA-based life, notwithstanding descriptions of what may be Martian nanobacterial fossils in a meteorite (McKay et al., 1996). Is it plausible that all these unique features might be linked in some way? If Earth's mantle did not convect and produce spreading ridges, we would not have plate tectonics. If oceans of liquid H2O did not cover the ridges, there would be no hydrothermal ridge processes; sea-floor basalts would not undergo alteration to hydrous minerals like clays and chlorites. If altered basalts had not formed already in the Eoarchæan then the first voluminous granitic (trondhjemitic) magmas could not have formed by melting of these primitive crustal materials. If the early granitic rocks had not formed, then buoyant, ‘indestructible’, continental masses would not have grown (see e.g. Campbell and Taylor, 1983). Although the distribution and elevation of continents plays a role in climate control, their role in the evolution of life is unclear. However, if granitic continents had not existed, our species would not be here at all, and many types mineral deposit would not exist either. Since granite forms the primary platform and a logistic support for terrestrial life, and our civilisations, it is clearly a rock-type worthy of study.
The present work makes no pretence at being a complete and objective review. Rather it presents the personal views of the author at the time of writing, a kind of position statement. For additional perspective, readers may be interested in the collection of landmark papers presented in Clemens and Bea (2012). This series of papers tracks the evolution of scientific thought on the petrogenesis of granitic magmas, mainly through the twentieth century. Like the present work, Clemens and Bea (2012) have a definite perspective on the historical development of thought and concepts, and do not try to present a complete history. Concerning history, readers might also enjoy the book by Young (2003), which deals with the story of igneous petrology (including granitic rocks) from the times of the ancient European civilisations to the twenty-first century.
In reading this work, please bear in mind that most of what is written about granites and granitic magmas applies equally to the volcanic equivalents, which differ only in their emplacement mechanisms. In addition, when the words ‘granite’ and ‘granitic rock’ are used, this is meant, in the broad sense, to apply to plutonic igneous rocks that span the range from alkali feldspar granite through to tonalite in the IUGS QAP classification diagram (see LeMaitre et al., 1989). The term melt is used here to refer to a liquid silicate phase (usually with dissolved H2O component) created in a melting reaction. Magma means a melt phase that is mobile and which may carry a cargo of crystals and rock fragments as well. As will be seen later, in most cases, granitic magmas are not pure melts.
Finally, remember that models should not be retained or accepted if their predictions run counter to observations, no matter how attached we might be to our favourite model. Indeed, the models advocated here may well be overthrown as time progresses and new facts emerge. This is the way science progresses.
A premature conclusion to bear in mind
It will be seen in what follows that production of voluminous, mobile, granitic magma involves advection of mantle heat into the continental crust, usually by means of underplated or intraplated basaltic magma. This under-accretion represents the major means by which Earth's continents have grown in volume since the Archæan (e.g. Rudnick, 1990). The withdrawal of large volumes of granitic magma from the deep crust and its emplacement at higher crustal levels has two major consequences. The base of the crust is left in a mafitised, dehydrated, restitic condition. Such dense rocks would need a second major orogeny, perhaps unrelated to the melting event, to become exposed (e.g. the restitic metapelites (‘stronalites’) of the Ivrea Zone in the European Alps). This possibly contributes to the relative scarcity of such rocks, when compared with the abundant mobile magmatic products that they produced. At the same time, the upper crust becomes enriched in felsic and heat-producing elements. This is probably the major mechanism for post-Archæan and ongoing, large-scale crustal differentiation (Vielzeuf et al., 1990). Therefore, granite formation is intimately connected with processes of crustal growth, high-grade metamorphism and crustal differentiation. This makes the granite phenomenon even more important to understand, if we are to correctly interpret the geology that we observe. However, the vastness of the subject means that it will only be possible to ‘scratch the surface’ in this article.
Origins of granitic magmas: The overture
Several possible ways of obtaining a granitic melt have been put forward. The following are brief comments on the viability of each. Note that the phrase ‘partial melting’ is used here in the phase-equilibrium sense – incongruent melting in which the subsolidus mineral assemblage participating in the reaction breaks down to a melt phase and an assemblage of crystalline solids (also known as peritectic phases). In effect, partial melting just means that the rocks melt incompletely and that the new peritectic minerals, together with some minerals that are not participating in the reaction together make up the solid ‘restite’ that coexists with the partial melt.
Partial melting of Archæan mantle?
No, unless you want very strange felsic melts and very small volumes of them
Fractionation of tholeiitic basalt?
Yes, granophyres and alkaline rhyolites
‘Contamination’ of basaltic magma (Assimilation and Fractional Crystallisation)?
Yes, some alkaline granites and rhyolites
Partial melting of crustal rocks?
Yes
Melting of oceanic crust produces plagiogranites, tonalites, trondhjemites and granodiorites (e.g. the TTG series and adakites). Melting of the continental crust produces granodiorites, monzogranites and granites, and only this last source can produce large volumes (since the end of the Archæan).
Some granitic magmas can be derived through the fractionation of tholeiitic mafic magmas, and through partial melting of hydrated, altered, ocean floor rocks in ophiolitic complexes. These processes produce miniscule volumes of sodic granite that has mantle-like isotopic compositions. However, the generation of most voluminous tonalite/dacite to alkali-feldspar granite/rhyolite (granitic) magmas, in a variety of tectonic settings, involves major material contribution from the continental or transitional crust. This is quite clear from the occurrence of voluminous granitic rocks only on continents and from the various isotopic tracers of magma parentage (e.g. Sm–Nd, Lu–Hf, Rb–Sr and O). In Fig. 2 you can see some cartoons illustrating the tectonic settings of granitic magmatism. Note that the most important settings in which granitic magmas are produced are here labelled ‘Post-Orogenic Uplift/Collapse’ and ‘Continental Arc’. Also note that, as cautioned by their originator (Pearce et al., 1984) geochemical tectonic discrimination diagrams mostly do not function to discriminate between tectonic settings of the magmatism but rather, can sometimes be used to gain an idea of the tectonic setting in which the dominant protolith was created (see also Twist and Harmer, 1987). In the words of Förster et al. (1997, p. 261) ‘Such diagrams are of little use if applied alone, but they can be valuable in combination with other methods such as dating and geologic assessment.’ In the following sections we will examine more closely the issues of heating and partial melting of crustal rocks, the creation of granitic magmas, their ascent and emplacement mechanisms, and touch on the origins of geochemical and textural diversity within granitic plutons.
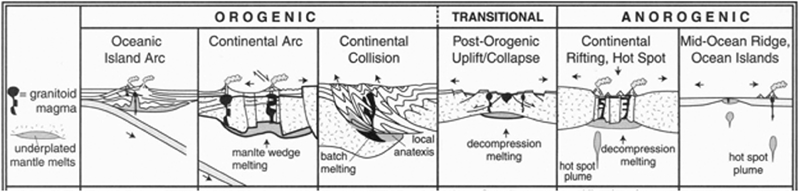
Cartoons illustrating the occurrence of granitic rocks in a variety of tectonic settings (taken from the top row of Table 18·4 on page 386 of Winter (2009), adapted from the work of Pitcher (1983, 1997) and Barbarin (1990, 1999). (WINTER, JOHN D., PRINCIPLES OF IGNEOUS AND METAMORPHIC PETROLOGY, 2nd Edition, © 2010., p. 386 Reprinted by permission of Pearson Education, Inc., Upper Saddle River, NJ)
Partial melting of the continental crust
To make a magma, of whatever kind, you need to melt some pre-existing rock. How do we do that?
The problem of temperature
The average thickness of the continental crust is ∼35 km, and the normal continental geothermal gradient (distant from plate boundaries and in the absence of thickening or magmatic underplating) is ∼20°C km−1. This means that the temperature of the lower crust is generally lower than needed to partially melt common crustal rocks. The actual T required depends on the fluid regime, details of which will be discussed later. In general, we need T>800°C, so the tectonic setting and rock types need to be suitable for additional heat generation or there must be heat advection from the mantle.
Solutions
One way to generate the required heat and raise the crustal temperature to suitable levels is to intrude (underplate or intraplate) mafic magma. The temperatures of basalt magmas are generally >1200°C, but this scheme works best with multiple sheet-like intrusions instead of a single thick underplate. Figure 3 illustrates a model of temperature versus distance from a single basaltic magma sheet 1 km thick, emplaced into lower crust initially at 400°C. As can be seen, very little of the wall rock would reach the required melting temperatures.
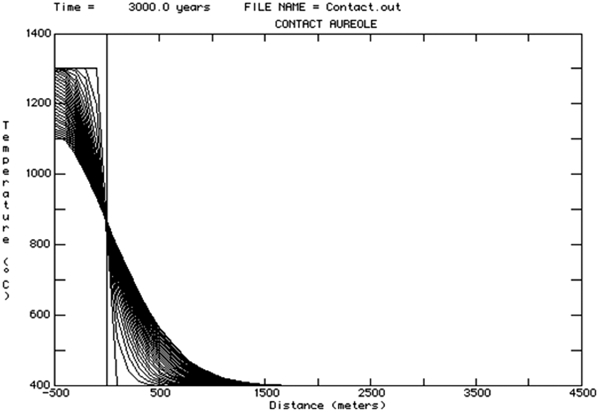
Thermal model calculated for the cooling of a 1 km thick basaltic sheet (initially at 1300°C) intruded into crustal rocks with an initial temperature of 400°C. The thermal profile here is tracked over 3000 years of cooling of the intrusion. This graph, and those presented in Figs. 6 and 7, were calculated using the programs Thicken and Contact (Spear et al., 1991)
The two graphs that follow (Fig. 4, personal comm. N. Petford, reproduced by permission from the author) illustrate the much increased efficiency of crustal heating when a given volume of mafic magma is emplaced as a number of separate sheets over some time interval, instead of as a single intrusion. As in the former model, the total thickness of basalt is 1 km, but it is introduced as 10, 20 or 30, separate sheets, each separated by a time interval of 20, 200 or 2000 years. It is clear that the temperatures reached in the partially molten aureole (granite protolith) reach far higher levels than in the single intrusion model.
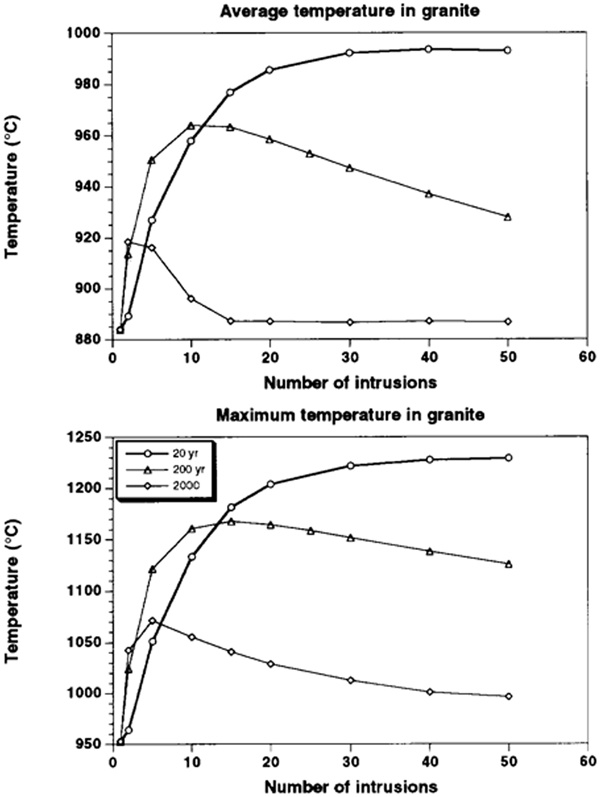
The effect of multiple, pulsed intrusion of mafic magma sheets on the maximum temperature reached in the thermal aureole. This figure is an unpublished diagram that contributed to the work of Petford and Gallagher (2001), reproduced by permission of these authors
Another stratagem would be to thicken the crust, for example in mountain belts in collisional zones. Thickening here is faster than thermal diffusion can readjust the geotherm, so the rocks remain relatively cool (with T remaining below the solidus). With time, the geotherms will ascend and, under some circumstances, with high heat production (HHP) rocks, partial melting may occur (e.g. Searle et al., 2010), especially if aqueous fluids are present. However, under normal conditions, no melting will occur. Figure 5 shows how changing the geothermal gradient affects the partial melting. Young warm crust can thicken and melt at a lower P than old cold crust. An example of the thermal structure of the crust in a situation of thickening by overthrusting is shown in Fig. 6, whereas the effects of thickening by homogeneous shortening are illustrated in Fig. 7. Note, in both of these plots that temperatures over 800°C would only be attained at crustal depths of well over 50 km. For a much more detailed treatment of all these scenarios, the reader should consult papers such as England and Thompson (1984, 1986), Thompson and Ridley (1987) and Thompson and Connolly (1995). For models involving very highly radioactive crust, the reader should consult, for example, Sandiford and Hand (1996) and Sandiford et al. (1998).
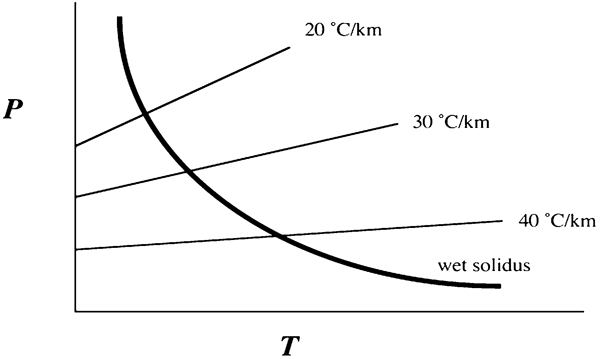
Graph illustrating the qualitative effect of geothermal gradient on the pressure at which the H2O saturated granite solidus (thick curve) can be crossed in a crustal thickening regime. Three lines illustrating different thermal gradients are shown. These are labelled 20, 30 and 40°C km−1 but are diagrammatic only. They simply illustrate the fact that the solidus can be crossed at lower pressure when the gradient is higher
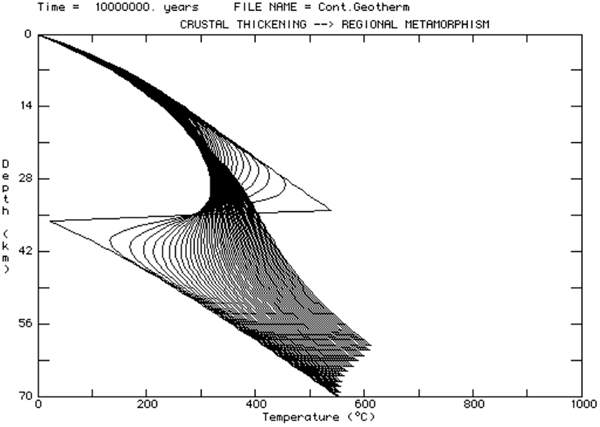
Calculated depth-temperature structure of crust thickened from 35 to 70 km by a single thrust fault with the profile tracked over a period of 10 million years
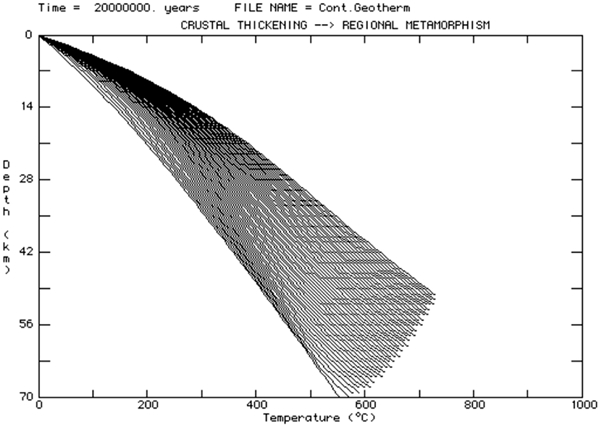
Evolution of the temperature profile in crust thickened from 35 to 70 km by homogeneous shortening, tracked over a period of 20 million years
The third way for crustal rocks to cross their solidus is essentially by decompression in an extensional regime. This process can certainly cause partial melting of the mantle and possibly of the deep crust as well. Indeed, once mantle-derived melts ascend and become emplaced into the deep crust, we come back to the first mechanism that was discussed above.
Finally, the solidi of crustal rocks can be lowered if aqueous fluids are somehow introduced into the system. However, temperatures of at least 600°C are required, even at great depth in thickened crust. Here we need to recall that high-grade metamorphic rocks typically have low porosities and permeabilities. Thus, fluid-absent conditions are likely, at least for the main volume of rock (outside shear zones and fractures). Indeed some supposed examples of widespread granitic magma generation by fluid introduction have turned out to be cases of fluid-absent partial melting involving muscovite breakdown (e.g. Searle et al., 2010). This means that, for the most part, temperatures over 800°C will be required if significant melt volumes are to be created.
Lessons from thermal modelling
Thickening of normal (i.e. not anomalously radioactive) continental crust by shortening can only begin to produce temperatures sufficient for fluid-absent partial melting in the extremely deep parts of the orogen. Thickening by thrust development is even less capable of producing the requisite temperatures. Likewise, the introduction of a single sheet of mafic magma can only heat a small zone of the surrounding rock to temperatures high enough for fluid-absent melting reactions to take place. The major conclusion is that this type of crustal melting can only be effective in cases of multiple intrusion of (relatively thin) mafic magma sheets.
Geometry of the melting zone and magma hybridisation at depth
The obvious question here is whether large magma chambers develop above a mafic underplate, or between its component sheets, allowing various interactions to take place between the mantle magma and crustal melts/magmas. The geological features of areas that are interpreted to represent such situations (e.g. the Ivrea Zone in the Italian Alps) do not reveal the former existence of such composite magma chambers. In these exposed terranes, the restitic metamorphic rocks are structurally underlain by the mafic body (former underplate), with little chemical interaction evident. The occurrence of what are inferred to be crustally derived S- and I-type magmas in some areas (e.g. SE Australia) also suggests that mantle-derived magmas (the heat sources) have not interacted to any great extent with the crustal melts. This seems to be the case for the bulk of the felsic magmas, but perhaps some mafic precursor magmas may represent the sought-after hybrids. As will be seen later, the likely rapid evacuation of crustal melts, by veins and dykes, would also result in there being little opportunity for extensive chemical interactions, to produce crust-mantle hybrid magmas at near-source levels. The inference is that large magma chambers are normally only built at the emplacement sites of granitic magmas, and that chamber processes such as differentiation and magma mingling, if they occur, will do so mainly in these shallower crustal settings. Though volumetrically minor, on the pluton scale, when differentiation does occur, its effects can be very significant on local scales.
Materials and melting reactions
There have been many experimental studies of partial melting of a wide variety of crustal materials. Most of the early work was carried out with excess H2O present. Most workers now recognise that fluid-absent melting is far more likely. The next section clarifies the meaning of the terms ‘fluid-present’, ‘fluid-absent’ and ‘dry’, in relation to melting reactions in geological situations. For a review of the results of fluid-absent experiments the reader is referred to Clemens (2006).
The topology of melting reactions in hydrous systems
In any bundle of reactions surrounding an invariant point, that involves partial melting, each reaction is conventionally labelled according to the phase that does not participate in that reaction. Thus, one of the melting reactions will be designated as ‘fluid-absent’. Such reactions occur in the complete absence of a free fluid phase (e.g. H2O). This does not mean that melting here is ‘dry’. In the context of a system that has H2O as a component, ‘fluid-absent’ just means that the H2O component in the hydrous mineral passes directly into the melt phase as dissolved H2O. It never exists as a free H2O fluid. ‘Dry’ (anhydrous) melting is a distinct process that occurs at much higher temperatures and involves the melting of purely anhydrous crystals. This is generally not geologically relevant, except possibly in rocks adjacent to some intense coal-seam fires.
The P–T plot in Fig. 8 shows the various reactions in the two-component system A-H2O, which can contain anhydrous mineral A, a crystalline hydrate mineral H, melts of various compositions and a fluid phase of nearly pure H2O. The melts are assumed to always have more H2O in them than the hydrous mineral H (see the inset with compositions marked). All reactions are labelled according to the phase that does not participate. They are


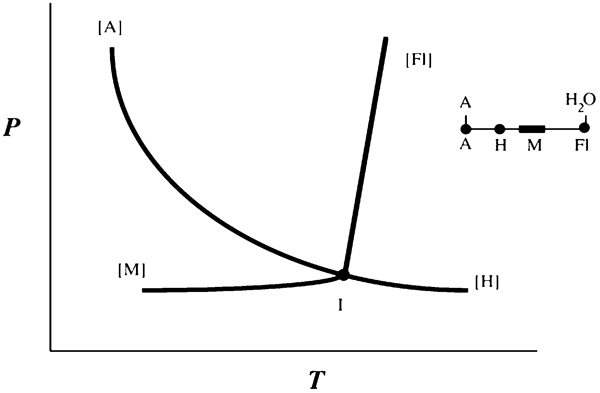
Diagrammatic P–T plot showing reactions in the system A-H2O, in which there is an anhydrous mineral (A), a crystalline hydrate (H), a range of hydrous melts (M) that are always more hydrous than H and aqueous fluids (Fl) with very minor dissolved A. This figure is redrawn from Fig. 1a of Clemens and Petford (1999)
Natural rock systems behave in a very similar manner to the simple theoretical system in Fig. 8. The fluid-absent melting reactions involving breakdown of micas and amphiboles have steep positive dP/dT slopes and occur at relatively high temperatures. Except in the presence of a fluid phase with low H2O activity, the dehydration reactions are relevant only in low-pressure and contact metamorphism. The breakdown of micas and amphiboles at upper amphibolite- and granulite-facies conditions almost always involves partial melting by reactions analogous to [A], for fluid-present systems, and to [Fl] in fluid-absent cases (which dominate in nature).
How do we know that fluid-absent conditions dominate?
Scaillet et al. (1998) collated a mass of temperature–H2O content data for natural, broadly granitic magmatic liquids, with the purpose of better constraining the range of viscosity of real granitic magmas. Most of the data came from previous crystallisation experiments on rocks, in which experimentally observed crystallisation sequences were compared with those inferred for the rocks, on textural grounds. Together with geothermometry, these comparisons constrained the T and initial H2O contents of the magmas and allowed calculation of the melt viscosity using various other models.
Clemens and Watkins (2001) used this compilation of data together with modelling based on Burnham (1981) to construct a diagram such as shown in Fig. 9. Note in this diagram that the points for the natural data are essentially confined to the region in which magmas produced by fluid-absent partial melting reactions would plot. Clemens and Watkins used this relationship to demonstrate that the vast majority of granitic magmas must have been formed by partial melting under fluid-absent conditions. The line of best fit to the natural data points has a slope lower than might be expected, given the slope of the dark grey band. This is a consequence of the higher-T magmas having been generated deeper in the crust, and consequently having H2O contents in the upper part of the possible range (due to the pressure effect on H2O solubility in silicate melts). Thus, we can proceed on the basis that fluid-absent partial melting reactions are the kind that we need to study in relation to the formation of crustally derived granitic magmas.
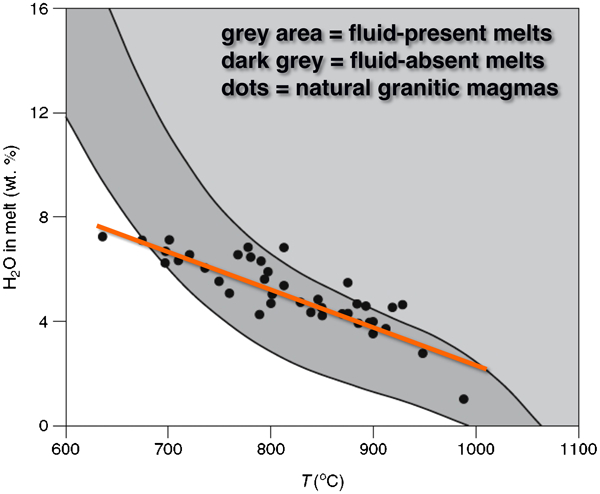
Plot of T versus melt H2O content of broadly granitic magmas, modified from Fig. 3 of Clemens and Watkins (2001) with kind permission from Springer Science and Business Media. The grey-shaded fields show the possible composition–temperature field in which natural granitic magmas could be found, if they are generated by partial melting reactions at pressures up to 1 GPa. The liquid products of fluid-absent partial melting are confined to the darker grey field. The points plotted are the experimentally constrained temperatures and H2O contents of natural granitoid magmas, with a line of best fit to the data points also illustrated
Reactions in real rocks
Natural crustal rocks are complex, multicomponent systems, in which melting reactions will usually be at least divariant. That is, they will occur over some range of T at any given P and should be represented as bands instead of lines in P–T space. However, from experimental studies it appears that, for fluid-absent systems, these bands are normally only 20–40°C wide. Within them, hydrous minerals break down rapidly (and with a steep slope in T–melt % space) with production of most of the melt over only a few degrees.
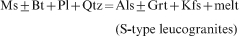
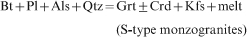
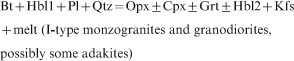
The following are slightly simplified examples of the types of fluid-absent reactions that have been observed to occur in experiments on a range of common crustal rock types as starting materials. The kinds of granitic magmas produced are given in parentheses.
In ‘low’-grade metapelitic rocks
Note also that the temperature of metamorphism could be buffered by the occurrence of one of these melting reactions, at least temporarily. If enough heat is available, however, the reactions will proceed until a reactant mineral becomes exhausted and then temperature will rise. Thus the temperature buffering capacity of a rock mass will depend on its exact mineralogical composition in relation to the stoichiometry of the melting reaction that is occurring. Crustal melting could exhaust a weak thermal anomaly but a very strong one (together with efficient melt extraction) might drive the rocks toward ultra-high-temperature conditions, creating very anhydrous and restitic mineral assemblages.
Some results of fluid-absent experiments
In thinking about the fertility of a given rock type for producing partial melt, the reader should avoid the traditional idea that the ‘ideal composition’ for maximising melt proportion would be represented by the liquidus minimum in the system Qz–Ab–Or. This would only be true if melting were fluid-present. As we have seen, in most natural, granite-forming systems, H2O is not available as a free fluid and melting only occurs at reasonably attainable temperatures because hydrous minerals are present and break down in fluid-absent melting reactions. Thus, as pointed out by Clemens and Vielzeuf (1987), the abundance of the hydrous mineral is the most critical control. Secondary controls on fertility are the abundance of other reactant minerals, mainly quartz and, in some cases, plagioclase. In the fluid-absent context, a rock with the exact composition of the minimum melt in the system Qz–Ab–Or would be totally infertile unless it also contained a hydrous mineral such as biotite. Other things being equal, a tiny amount of biotite would produce meagre fertility.
Metasedimentary rocks
Studies of fluid-absent melting in metapelites by Vielzeuf and Holloway (1988) and by Patiño Douce and Johnston (1991), and of a greywacke by Vielzeuf and Montel (1994) provide interesting data. In both sets of experiments on metapelites at 1·0 GPa, significant quantities of melt (>10 vol.%) were present only at temperatures above 800°C. In the study of Vielzeuf and Holloway, the biotite-out temperature is ∼850°C. Above this, all the H2O in the starting material is present in the melt phase. Consequently, melt production in these studies is characterised by a strong pulse between 825 and 850°C. In contrast, in the study of Patiño Douce and Johnston, biotite persisted to a temperature of ∼ 975°C and melt production was approximately linear with increasing temperature, from 800°C. The difference in the upper temperature limit of biotite stability appears to be a function of differences in the bulk rock TiO2, Na2O and H2O contents, and aSiO2. The starting material of Patiño Douce and Johnston contains unusually low plagioclase content for a metapelite. Since their rock is a very unusual material, its behaviour cannot be taken as a model for that of normal metapelites. Figure 10 shows melt production versus T for two of these studies.
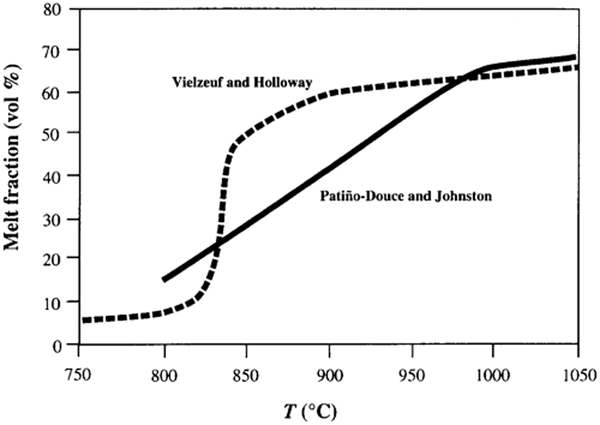
The evolution of melt proportion as a function of temperature in the partial melting experiments of Vielzeuf and Holloway (1988) and Patiño Douce and Johnston (1991). Both sets of experiments were carried out at nominally fluid-absent conditions on metapelitic compositions. This figure is modified from Fig. 1.7 of Stevens (1995)a
Only two fluid-absent investigations have been conducted using Ca-poor metagreywackes (Vielzeuf and Montel, 1994; Stevens et al., 1997). Vielzeuf and Montel found that, at 1 GPa, fluid-absent melting began at ∼900°C, suggesting that fluid-absent melting in metagreywackes is unlikely to occur in collisional settings where temperatures do not normally reach this level, and that fluid-absent melting in metagreywackes probably does not overlap with that in metapelites of the type investigated by Vielzeuf and Holloway (1988).
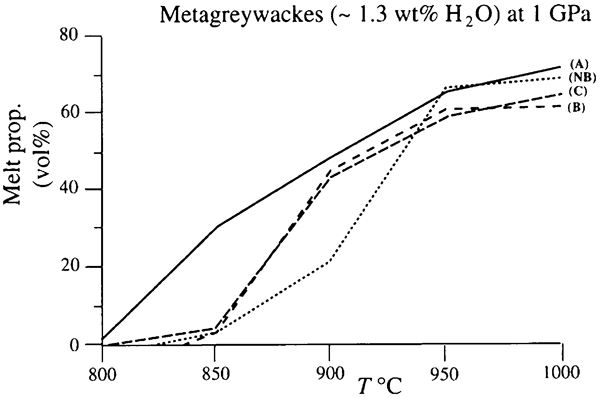
Stevens et al. (1997) conducted fluid-absent partial melting experiments, at 0·5 and 1·0 GPa, on a range of synthetic magnesian metagreywacke and metapelitic compositions, in the system K2O–Na2O–CaO–FeO–MgO–Al2O3–SiO2–H2O, at temperatures appropriate to middle and lower crustal granulite-facies metamorphism, plus some data on the affects of additional TiO2 and of fO2. In metapelites and metagreywackes, with Mg# (100Mg/[Mg+Fe]) between 50 and 80, the onset of anatexis occurs under similar conditions. Given relatively reducing fluid-absent conditions, all similar natural metasedimentary granulites should contain evidence of partial melting, provided that temperatures of at least 830°C were attained. Within the compositional range investigated, increasing Mg# raises the temperature of the fluid-absent solidus by a maximum of ∼30°C. The maximum temperature of biotite-melt coexistence increases with increasing Mg# and the divariant melting interval expands with increasing Mg#, within the range investigated. The addition of a TiO2 component has no discernible effect on the solidus (beginning of melting) in either bulk compositional group but it extends the temperature range over which biotite is stable, thus widening the melting range toward higher temperatures. Fluid-absent partial melting, involving biotite breakdown in the compositions used here, produces quartz-saturated, granulite-facies residual mineral assemblages that coexist with H2O-undersaturated granitic melts. The melt compositions vary little, and are similar to those of natural strongly peraluminous leucogranites. Figure 11 illustrates the melt production curves for these greywackes at 1 GPa. The compositions become more magnesian from A to C; NB represents experiments using a natural titaniferous biotite in the starting mixture.
Intermediate rocks
Rutter and Wyllie (1988), Skjerlie and Johnston (1992) and Singh and Johannes (1996a, b) studied natural metatonalitic compositions. Figure 12 illustrates the differing melt production curves of the three rocks. The differences are caused by different ratios of biotite to hornblende and perhaps differences in quartz content and plagioclase composition in the parent tonalite. The rocks are not as fertile as metagreywackes but can still yield tens of percent of melt at attainable temperatures. Note also that the Skjerlie and Johnston curve (open circles) shows the sort of stepped melt production curve typical of rocks that contain more than one hydrous mineral, with the steps representing melt pulses brought on when the temperatures of major biotite and amphibole breakdown are reached. Melts produced from tonalitic protoliths are dominantly granitic to granodioritic.
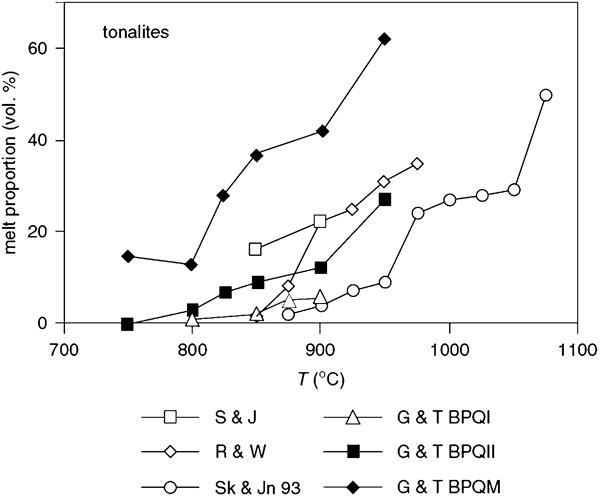
Temperature–melt production curves for a variety of fluid-absent partial melting experiments on tonalitic starting materials. The curves are from: S & J (Singh and Johannes, 1996), R & W (Rapp and Watson 1995), Sk & Jn (Skjerlie and Johnston, 1992) and G & T (Gardien et al. 1995). This figure is reproduced from Fig. 9.7 of Clemens (2006)
Mafic rocks
Some important work on mafic (amphibolitic) protoliths has been carried out by Rushmer (1991), Patiño Douce and Beard (1995) and Rapp and Watson (1995). Rushmer found that an alkaline, relatively magnesian, metabasaltic amphibolite started to produce fluid-absent melt at ∼925°C, with melt proportion rapidly rising to over 25% by 950°C and reaching ∼45% at 1000°C. With a more ferroan tholeiitic amphibolite, melting began at a temperature as low as 800°C and the melt proportion rose steadily to ∼35% at 950°C. The melts were tonalitic to trondhjemitic in composition. Patiño Douce and Beard's synthetic quartz amphibolite began melting at ∼850°C, with melt proportions rising to 20–30% at 975°C. Melts were granodioritic. In a range of mafic starting materials, Rapp and Watson observed granitic melts at ∼5% melting, trondhjemitic at 5–10%, and granodioritic to tonalitic and dioritic with melt proportions increasing up to 40% (at T>1000°C).
The question of high-K calcalkaline granitic rocks
An interesting question surrounds the origin of high-K calcalkaline granitic rocks, which are extremely common in post-orogenic magmatic suites. Many geologists believe that these rocks can be formed by the partial melting of mafic source rocks or by assimilation and fractional crystallisation (AFC) processes involving mantle-derived magmas and assimilated crust. Roberts and Clemens (1993) showed that it is most likely that these rocks are crustally derived, that AFC models are rather unconstrained and scientifically meaningless, and that the only viable mechanism is partial melting of already K-rich meta-andesitic rocks previously accreted to the crust. The simple geochemical diagrams in Fig. 13 neatly illustrate that the experimental partial melting work on all sorts of rocks severely limits the range of protolith compositions that can produce partial melts in the high-K field.
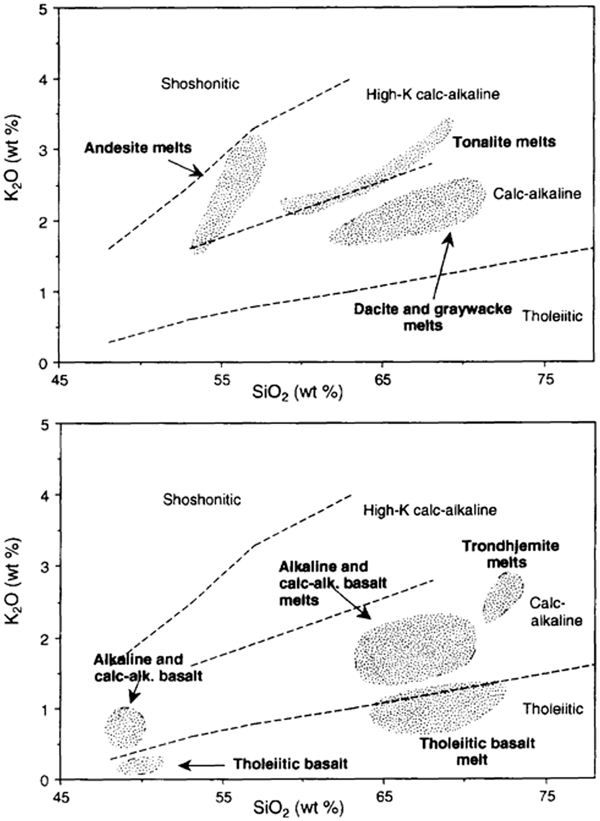
K2O–SiO2 plots of the compositions of experimentally produced partial melts of various types of starting materials (grey stipples areas), with data from Helz (1976), Rutherford et al. (1985), Conrad et al. (1988), Johnston and Wyllie (1988), Carroll and Wyllie (1990), Beard and Lofgren (1991), Winther and Newton (1991) and Wolf and Wyllie (1991). Note that metabasaltic rocks cannot produce high-K melts but that partial melts of meta-andesites, metadacites and metatonalites produce melts that fall in the high-K field. This diagram is reproduced from Fig. 3 of Roberts and Clemens (1993)
Predictive models of fluid-absent partial melting
Clemens and Vielzeuf (1987) used the relationship between the H2O content of a magma source rock and the solubility of H2O in a fluid-absent partial melt to erect a model that could be used to predict the amount of melt that would be formed from a given source rock at any particular P and T. Figure 14 illustrates the relationships. Essentially, the H2O solubility model of Burnham (1981) was combined with an assumption of the nature of the rock solidus as a function of P, T and aH2O to calculate these plots. The fundamental relationship used is
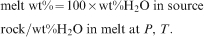
Plots of vol.% melt produced as a function of temperature for fluid-absent partial melting of crustal rocks – for metapelites and meta-quartzofeldspathic rocks (including metagreywackes) a at 0·5 GPa and b at 1 GPa, and for mafic rocks (basaltic amphibolites) c at 0·5 GPa and d at 1·0 GPa. a and b were modified from Fig. 4 and c and d from Fig. 6 of Clemens and Vielzeuf (1987), reprinted with permission from Elsevier
Summary
Common crustal rock types can be partially melted at T as low as 700°C, but major melt production only occurs at T≥800°C. The T needs to be very high (>900°C) if hornblende-bearing metabasalts are involved. These thermal requirements demand that extra-crustal heat sources be available, i.e. magmatic underplating is of major importance to the occurrence of most granitic magmatism. Amounts of fluid-absent melt will vary as a function of P, T and hydrous mineral content in the protolith, but common rock types (metapelites, metagreywackes, meta-andesites and some amphibolites) can yield 10 to 50 vol.% of H2O-undersaturated melt at attainable crustal temperatures. The compositions of the melts vary from leucogranites to trondhjemites and granodiorites to tonalites, mainly depending on the chemistry and mineralogy of the source rocks and the T of melting. The conditions of fluid-absent partial melting equate with those of granulite-facies metamorphism. Thus, there is an intimate connection between the production of granulites and partial melting reactions. The flow chart in Fig. 15 summarises the possible outcomes of crustal melting and metamorphism as a function of temperature and fluid presence/composition.
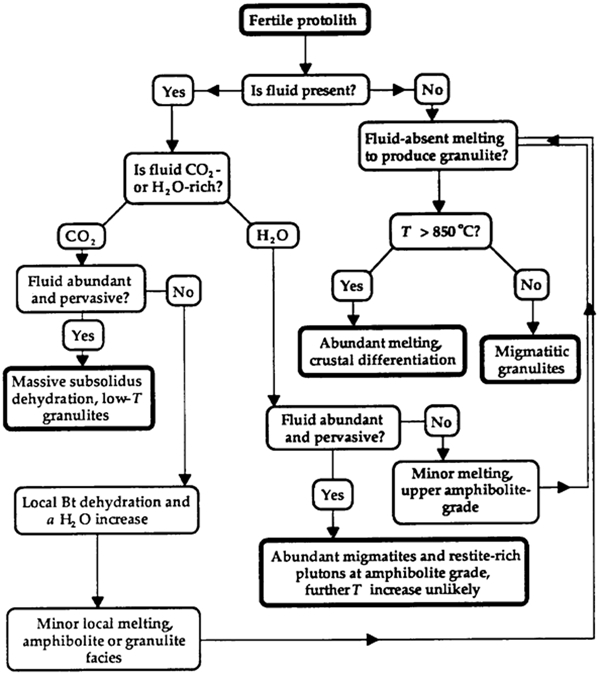
Flow chart illustrating the various possible outcomes of crustal metamorphism and partial melting, depending on the presence or absence of a fluid phase and, if present, its composition in the C-O-H system. This figure is reproduced from Fig. 4 of Stevens and Clemens (1993), reprinted with permission from Elsevier
Part 2: Exodus
The ultimate fates of partial melts and magmas in Earth's crust
The first question here is: once a melt exists, how does it become magma, what can happen to that magma and what are the other possibilities for the fate of a melt? Clemens and Droop (1998) and Clemens et al. (1997) studied the effects of metamorphic P–T path, the presence or absence of fluids and fluid composition on the survival and character of melt products. The following summary is taken from these works.
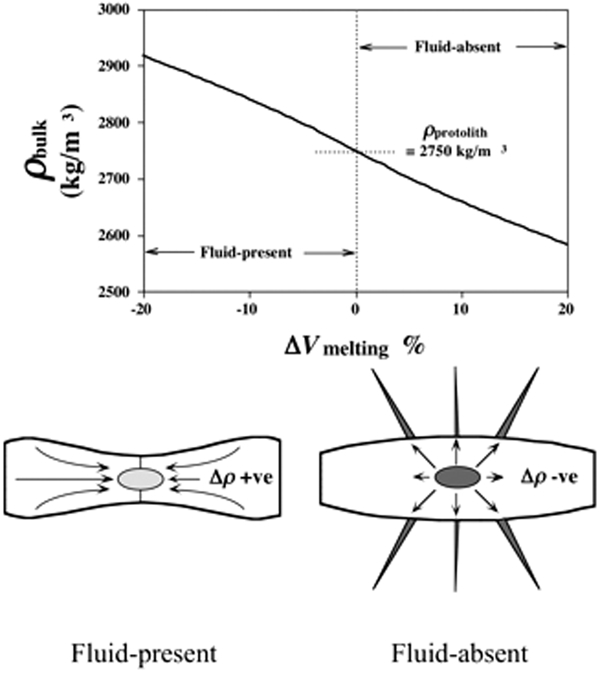
Rocks undergoing fluid-present melting will experience an increase in bulk density and will become more gravitationally stable. Diapiric up-welling of such a terrane should not occur. In fluid-absent melting, the bulk density will decrease and foster gravitational instability. However, stresses in the surrounding rocks could lead to fracture and rapid evacuation of the melt.
With excess fluid and without melt segregation, isobaric cooling will cause immediate freezing. If T rises above the biotite-quartz melting reaction, freezing will still occur at the original reaction T. Diapiric up-welling should not occur. Biotite-bearing diatexites might be formed by large degrees of fusion, but magma ascent is unlikely. In isothermal decompression, immediate freezing will ensue, and the resulting migmatite should contain orthopyroxene rather than biotite.
With excess fluid and melt segregation, cooling will induce freezing at the fluid-saturated granite solidus. However, magma ascent could occur, even for XFlH2O = 1. In isothermal decompression, melt will persist down to the pressure of the granite solidus for the imposed XFlH2O. Limited magma ascent could occur. All these granites should contain primary igneous biotite.
For fluid-deficient rocks without melt segregation, freezing will occur at the T of original melting. If the reaction is overstepped, solidification will occur at the original XFlH2O. Magma formation is unlikely. The resulting migmatites should contain either pyroxene retrogressed to biotite, or biotite alone. On decompression, immediate freezing is likely if T remains at the biotite-quartz reaction. For higher T, melt will survive decompression and freeze at the fluid-saturated solidus for some increased XFlH2O. Magma ascent is possible, and the melt will freeze very close to the wet granite solidus.
In fluid-deficient rocks with melt segregation, cooling and crystallisation will cause fluid saturation. In situ segregated melt will freeze at the original XFlH2O. However, melt ascent will cause exsolution of a CO2-rich fluid. With this fluid escape, the melt will freeze at T close to the wet granite solidus. An increase in melt proportion may accompany magma ascent or source up-welling. Any low-P granite intrusion should be charnockitic.
For fluid-absent rocks without melt segregation, freezing will occur on cooling to the T of the original reaction. Only transitory migmatites could be formed, but melt will survive decompression almost to the H2O-saturated granite solidus. The rocks will reveal former melt presence only in the existence of veins of coarse retrograde biotite. With isothermal decompression, further melting may occur, forming an orthopyroxene-bearing granulite-facies migmatite.
In fluid-absent situations with melt segregation, magma could be efficiently transported to higher crustal levels. If melt proportion were insufficient for magma formation, granulite-facies migmatites would result. Ascending melt would progressively dissolve or react with most entrained restitic or peritectic mineral grains, at least partially eradicating them (see also Clemens et al., 1997). The granites produced should be charnockitic.
Melt and Magma Transport: How do Granitic Magmas Get from Source to Emplacement?
Melts and magmas must be transported, on a variety of scales, within and out of their protoliths, to reach emplacement (as volcanic or plutonic magma bodies). Important variables governing these groups of processes include:
physical state of the partially molten region (melt %)
viscosity and density of melts and surrounding rocks
occurrence and style of deformation
temperature and thermal structure of overlying rocks.
There are two stages of melt migration (transport) to consider:
segregation – short-range migration within and near the magma source
ascent – long-range vertical transport through the crust.
These two stages are then followed by emplacement of the magma, to form the bodies that we eventually study. For details of the distinctions between these processes (stages) and additional references, see Petford et al. (1998).
Melt segregation
To create a mobile magma from a partially molten protolith it is necessary for the melt to segregate from its refractory crystalline residue. Experiments and modelling (e.g. Rushmer, 1996; Sawyer, 2001 and references therein) have been applied to understand how melts may segregate, but the mechanisms are presently not perfectly understood. From direct observation in the rock record, and inference from petrography and geochemistry, segregation clearly occurs, it is commonly highly efficient and these processes operate mostly at deep levels. In many publications (e.g. Wickham, 1987; Fountain et al., 1989; Solano et al., 2012), people write about melt having to accumulate to some critical proportion before being able to move out of the source rock. This may not be the case. There is growing evidence that melt can escape the source at very low proportions, and that granitic magmas seem to be formed from numerous small pulses of magma (e.g. Ayers et al., 1997; Villaros et al., 2009a, b; Villaros et al., 2011; Bea et al., 2007).
Stages in the segregation process
The reader is referred to works such as Ribe (1987), Wickham (1987), Miller et al. (1988) and Sawyer (1994, 2001) for background on what follows. There are two stages involved in the segregation of partial melt. These are:
formation of an interconnected porosity
melt flow into the porosity and thence into larger masses that are geochemically isolated from the residual solids.
Formation of an interconnected porosity
Experimental and theoretical evidence suggests that this condition may be met at very low melt fractions (possibly <1 vol.%). The residual crystals are also interconnected at low melt fraction, which means that the bulk properties of the partially molten system will be governed by the properties of the solid phases.
Melt flow into porosity
This end result can theoretically be accomplished by two mechanisms:
gravity-driven compaction
extensional fracturing.
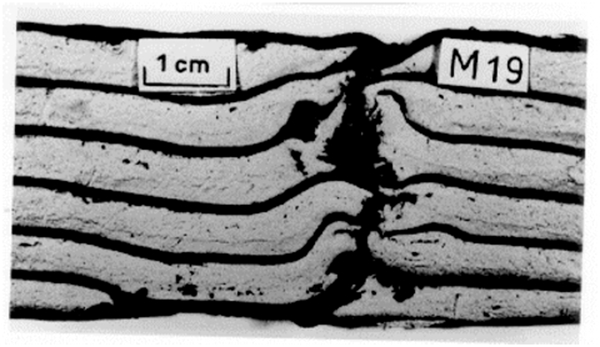
Gravity-driven compaction is slow, inefficient and cannot transfer melt any large distances. The characteristic compaction length for a granitic system is in the order of only a metre and characteristic times are ∼1010 years. The diagram in Fig. 16 illustrates the process. Extensional fracturing is caused by melt overpressure. As this overpressure is relieved the fractures will close. Figure 17 Figures 17 and 18 illustrate how this process operates (Neumann, 1994).
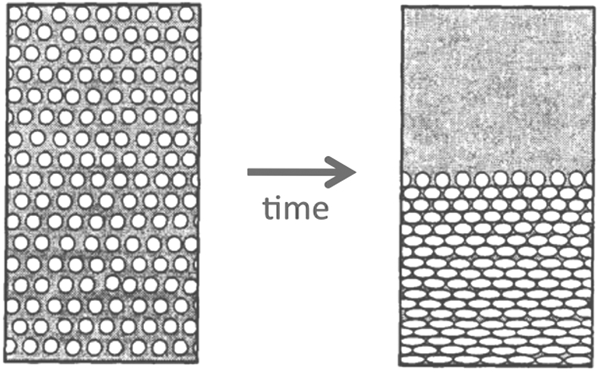
Diagram illustrating a model for the extraction of melt from a deformable matrix. The white circles represent residual crystals and the grey shaded areas represent the melt. With the passage of time the crystals are deformed and concentrated in the gravitationally lower part of the system, whereas the melt is concentrated at the top. This figure is reproduced from Fig. 8.01 of Neumann (1994)
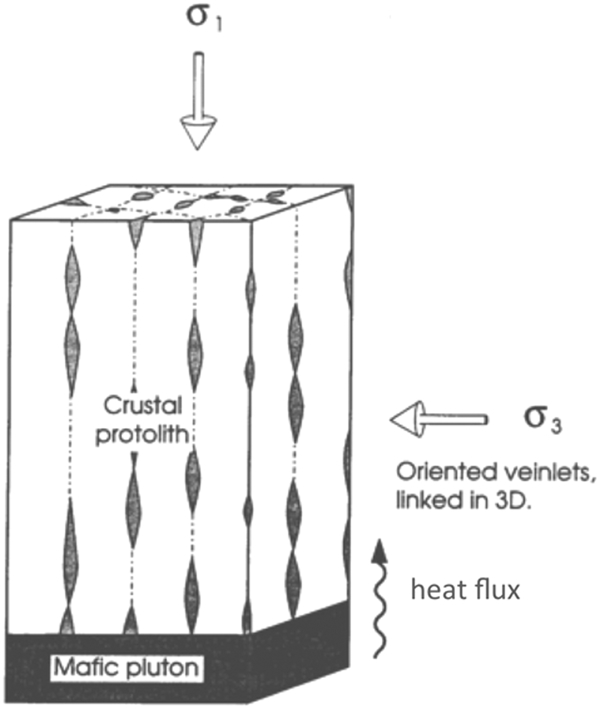
A model for the fracture extraction of partial melt from a crustal source rock heated from below by a mafic magma. The melt is sucked into the vertical fractures by shear-enhanced compaction in a stress field where the maximum principal stress is vertical. This figure has been reproduced from Fig. 8.02 of Neumann (1994)
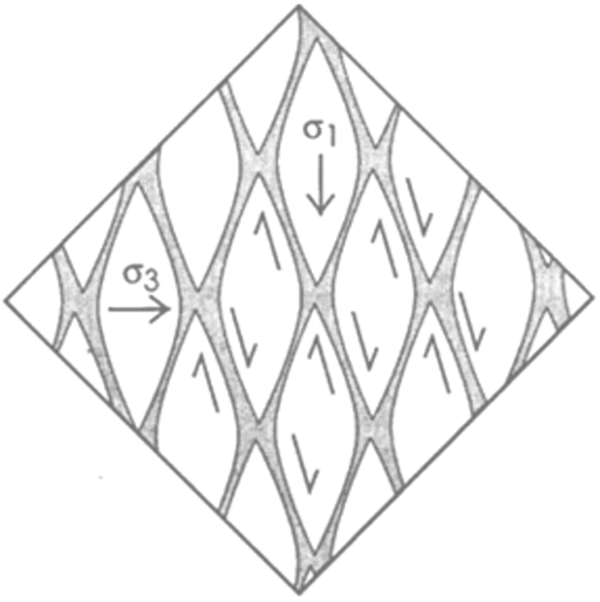
A sketch of how gravitational compaction of melt-filled fractures may occur. This process, in conjunction with that illustrated in Fig. 16 is most probably responsible for magma segregation in rocks that have been partially melted under fluid-absent conditions. This figure is reproduced from Fig. 8.03 of Neumann (1994)
The efficiency of fracture flow has been determined from field-related studies. It appears that very rapid and efficient segregation does occur in migmatitic rocks (e.g., Sawyer, 1991, 1994; Ayres et al., 1997). Segregation appears to be accomplished in just tens to thousands of years. Thus, provided that sufficient melt volume exists in the protolith, there does not appear to be a problem in moving the melt into dilatant sites in a deforming matrix (e.g., fractures, boudin necks, shear zones), from where it could be further transported to form sizeable plutons.
Variation of melt and bulk source properties with melt fraction
Figure 19 shows how melt proportion in a metagreywacke (containing 1 wt%H2O expressed as 25% biotite) will evolve as a function of T at a P of 1 GPa. Note that as melt proportion increases the melt H2O content falls. This is a consequence of fluid-absent processes. Hotter melts are drier but more voluminous.
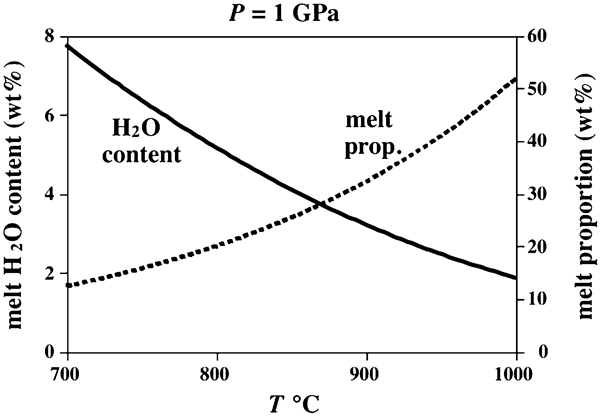
Figure 20 shows variations in granitic melt viscosity and density as a function of T during fluid-absent partial fusion of the same metagreywacke. The two viscosity curves were calculated from expressions in Hess and Dingwell (1996) and Schulze et al. (1996), whereas the densities were calculated using partial molar volumes of silicate-melt oxide components given by Bottinga et al. (1983), plus the partial molar volume of H2O in albite melt (Burnham and Davis 1974). Hotter melts have lower densities but viscosity is not much affected by T in this sort of system. Note also that the melts have quite low predicted viscosities, ∼105 Pa s (106 poise). This means that the melts can flow relatively easily.
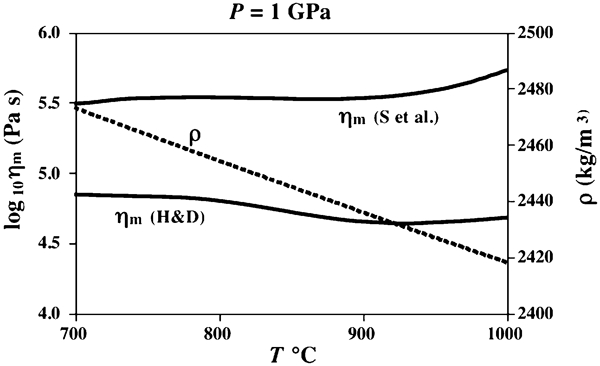
Variations in granitic melt viscosity and density occur with T during fluid-absent partial melting of the same metagreywacke as in Fig. 19
Figure 21 shows how the bulk density of a partially melting source varies as a function of melt proportion and type of melting reaction (fluid-absent or fluid-present). Note that volume change is the proxy for this variable, with more change equating with higher degrees of melting. Note also that, for fluid-present melting, the source becomes denser and more gravitationally stable. The whole system should collapse and remain in place. In contrast, with fluid-absent melting, the partially molten source builds up considerable overpressure and will fracture, aiding melt segregation (see above).
Early experimental studies of the strengths of partially molten granitic source rocks appeared to show a dramatic drop in bulk viscosity once a certain threshold melt proportion had been reached. This led Arzi (1978) to propose the general existence of a rheologically critical melt proportion (RCMP) that would separate solid-like from suspension-like behaviour. The existence of this feature was not verified in at least some later studies (e.g. Rutter and Neumann, 1995). The RCMP was later proposed to be a broad range of melt percentages (around 20 to 60%) and its relevance for segregation of the relatively small melt fractions that are believed to dominate in the formation of granitic magmas came under question. More recently, Rosenberg and Handy (2005) published a comprehensive overview, together with new experimental data, and showed that there is indeed a dramatic transition in behaviour between 0 and ∼7% melt, driven by the onset of extensive connectivity between melt patches. This is not at all the same as the mooted transition to suspension-like behaviour (the original RCMP). At higher melt proportions, the change in behaviour is very much less pronounced (Fig. 22). The real dramatic change, at low melt fractions, may be connected with the apparent ability of relatively small partial melt batches to be evacuated from their sources at these early stages, at rates that may commonly prevent attainment of chemical and isotopic equilibrium between melt and crystalline residue (see Bea, 1996; Bea et al., 2007; Beard 2008; Farina and Stevens, 2011).
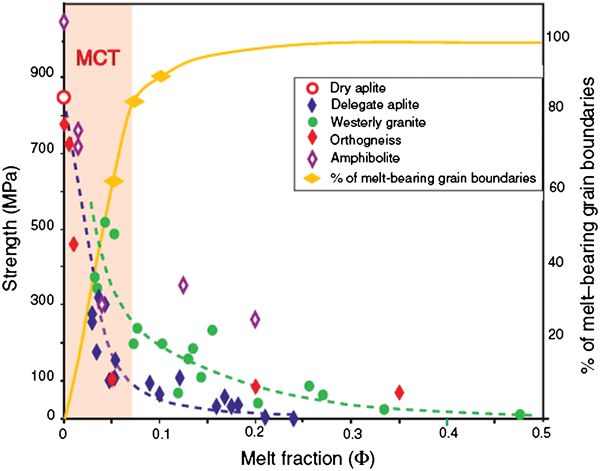
Graph showing aggregate strength and percentage of melt-wetted grain boundaries as functions of melt fraction, showing the dramatic decrease in aggregate strength within the melt connectivity transition (MCT), with a more subtle decrease thereafter. The data for various rock types are shown as points. This figure is reproduced from Fig. 2b of Rosenberg and Handy (2005)
The character of magma flow
Readers interested in understanding the details of the rheology of granitic magmas should consult Petford (2003) for a scholarly review and some cutting-edge ideas. Some sections of the literature on magmas (both basaltic and granitic) suggest that these melts may undergo turbulent flow. Figure 23 shows that this cannot be the case. All natural Phanerozoic magmas flow in the laminar field because none have Reynolds numbers above the critical value (2×10³) that marks the onset of turbulence. It should be remembered that complex, swirling, flow patterns very commonly develop, but these do not imply formation in the turbulent flow regime, but only complex chaotic flow.
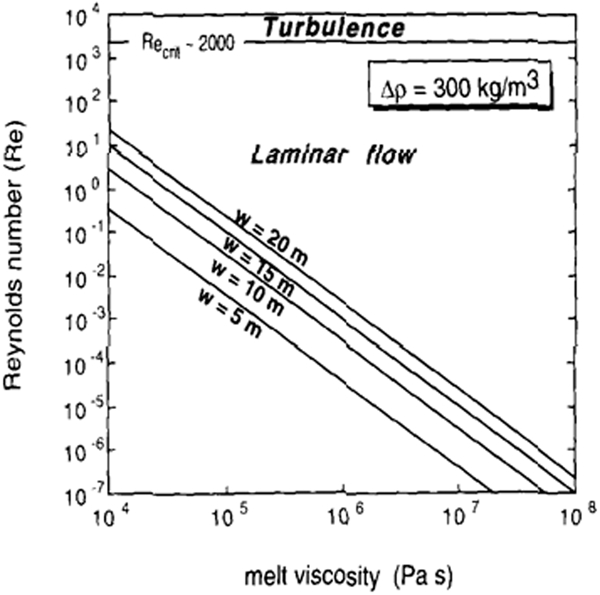
Plot of Reynolds number against viscosity for terrestrial, post-Archæan magmas flowing in fractures with widths of 5–20 m and with the transition between laminar and turbulent flow regimes (at 2×10³) marked: (reproduced by permission of The Royal Society of Edinburgh from Fig. 3 of Petford, 2006). Note that this range of fracture widths relevant to the ascent and emplacement of granitic magmas (see the following section on magma ascent mechanisms)
Magma ascent
Ascent versus emplacement
It is critical to clearly distinguish between the processes of magma ascent and magma emplacement. Perhaps the key to appreciating the difference is the realisation that overall magma transport distances are tens of kilometres, whereas large plutons are commonly nowhere near this in vertical extent. Emplacement involves formation of a pluton (or eruption) and is the mechanism (or mechanisms) by which the accumulated volume of magma is accommodated at its final resting place (in or on the crust). Ascent is the mechanism (or mechanisms) by which the magma traverses the tens of kilometres between its generation level and its emplacement level. With the possible exception of diapirism, there is no reason to suppose that ascent and emplacement must occur either by the same mechanism or at the same volumetric rate.
Competing models and the shapes of plutons
At present there are two largely incompatible models to explain the ascent of granitic magmas. Granitic batholiths are commonly pictured as vertically extensive bodies, with vertical or outward-dipping contacts, continuing from outcrop to deep crustal levels. The roughly circular shapes of many granitic plutons led people to make analogies with salt domes and the idea of granitic diapirism was born around 1920.
Most old (and some recent) work postulates that batholiths extend from the surface to depths of up to 45 km (e.g. Hyndman, 1983; Paterson and Vernon, 1995). These inferences are mostly based on observations of plutons that are believed to have been tilted, with depth estimates derived largely from geobarometry in the wall rocks. There is room for debate on the structural levels exposed, whether tilting has occurred, the temporal relations between wall-rock metamorphism and intrusion, and on the appropriateness and accuracy of the geobarometric techniques. In some crustal segments, an additional question surrounding this hypothesis is that of the origin of the magma. If the major contribution was crustal, there may be insufficient thickness of appropriate crust present to provide the huge inferred magma volume.
With the application of physics to the problem, particularly in the 1970s and 1980s, the early ideas evolved into the sort of buoyancy-driven diapirism with which we are now familiar. Many workers have looked to the ultracentrifuge experimental work of Ramberg (1981) for experimental analogues of granite diapirs. Ramberg produced beautiful models of salt and gypsum diapirs, but actually never meant his work to be applied to granites. He was a transformist! When he did attempt magma experiments, he used putty for the layers of the crust (as in the diapir models) and an aqueous solution of KMnO4 to model the magma. The viscosity scaling of these experiments was such that Ramberg's ‘magma’ was up to 10 orders of magnitude too viscous to represent even a granite melt. The photograph in Fig. 24 shows that even these incredibly viscous magmas did not behave as diapirs. Instead they punched narrow channels through Ramberg's model crustal rocks.
Photograph showing a centrifuge model of layered crust (putty) and the path taken by an ascending model magma (water). This figure is reproduced from Fig. 13.6 of Ramberg (1981)
Modern magmatic diapir models mostly involve hot-Stokes flow of partially molten magma blobs through heated and softened wall rocks (e.g. Mahon et al., 1988). The magma source region is commonly viewed as a regionally extensive, partially molten, plastic layer, with periodic cuspate instabilities that spawn diapiric up-wellings. Note that the deep crust, below what is often called the brittle-ductile transition, can behave in a plastic or pseudoplastic manner when deformation strain rates are low (i.e. stresses are applied over long times), or it can behave in a brittle manner, if strain rates are high. In diapir models, strain rates are supposed to be low, but this is not necessarily the case (e.g. Clemens and Mawer, 1992).
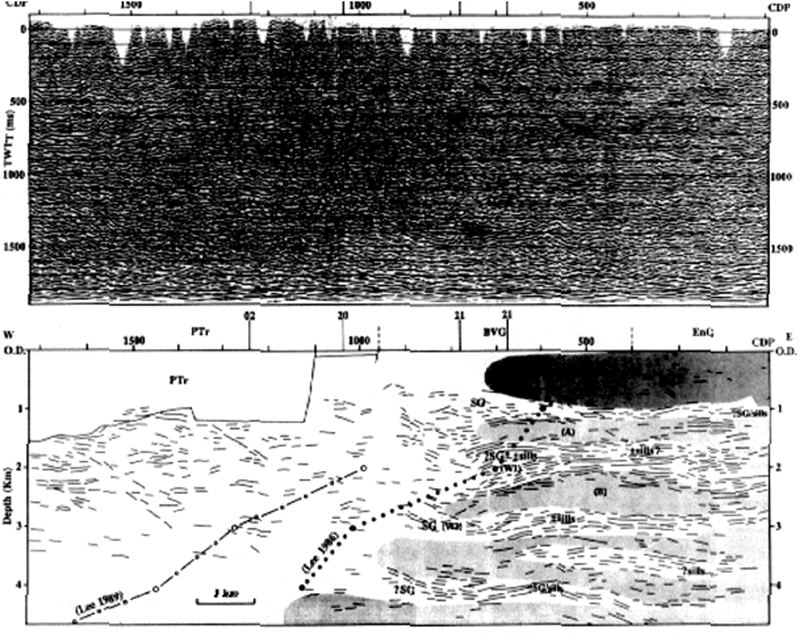
In contrast to what is probably still the common geometrical perception, increasing numbers of granitic batholiths are proving to be shallow bodies with vertical to inward-dipping contacts and floored at relatively shallow depths (e.g. Hamilton and Myers, 1967; Neilson et al., 1976; Sweeney, 1975, 1976; Hodge et al., 1982; Vigneresse 1988, 1990; Jébrak et al., 1991). Apart from direct observation, the best evidence for this is the occurrence of distinct flat-lying or shallow-dipping reflectors beneath batholiths in seismic cross-sections (e.g. Lynn et al., 1981; Goleby et al., 1994; Evans et al., 1994). In a survey of length-thickness data (of both geological and geophysical origin) for 156 granitic plutons, McCaffrey and Petford (1997) found that these bodies have scale-invariant dimensional ratios. They concluded that granitic intrusions are essentially tabular bodies with dimensions best characterised by the power-law relationship

Field evidence for ascent mechanism
From the outset, it would be well to bear in mind that whatever mechanisms operate in granitic magma ascent, they must be simple and energetically efficient. Nature never does things the hard way. Thus, from this whole section (7.4.3 and 7.4.4) the reader will understand that diapirism, though apparently an attractive mental picture, is far less efficient than fracture ascent of magmas. The reason for labouring the point a little here is that diapirist ideas remain current and we need to know what they really mean and imply vis-à-vis fracture mechanisms.
A granitic diapir must ascend through the crust by softening and causing plastic deformation of its wall rocks. In the wake of a diapir ascending by thermal softening of the crust, the wall rocks will show high-T metamorphism. There should also be radial flattening fabrics (concentric schistosity) and strong vertical shearing and stretching fabrics (asymmetric structures and lineations). A fossil diapir tail will be a near-cylindrical, high-grade shear zone with core-up kinematic indicators throughout. Also, a rim syncline will accompany the shear zone and be most pronounced near the diapir root. Ideally, the diapir head will be accompanied by radial stretching lineations and extreme strain in the cap rock.
Figure 26 shows a cartoon of a granitic diapir with its most important structural features indicated. The deformation in the country rock, as well as in the diapir is shown. Arrows represent the plunges of lineations. Field and literature searches for the combinations of these features drew complete blanks (e.g. Bateman, 1984; England 1990; Clemens and Mawer, 1992). Diapir tracks (pipe-like, high-grade shear zones in which the cores have moved up) apparently do not exist. Structural tests have been applied to putative granitic diapirs, which have universally failed (so far) to pass these (e.g. Schwerdtner, 1990).
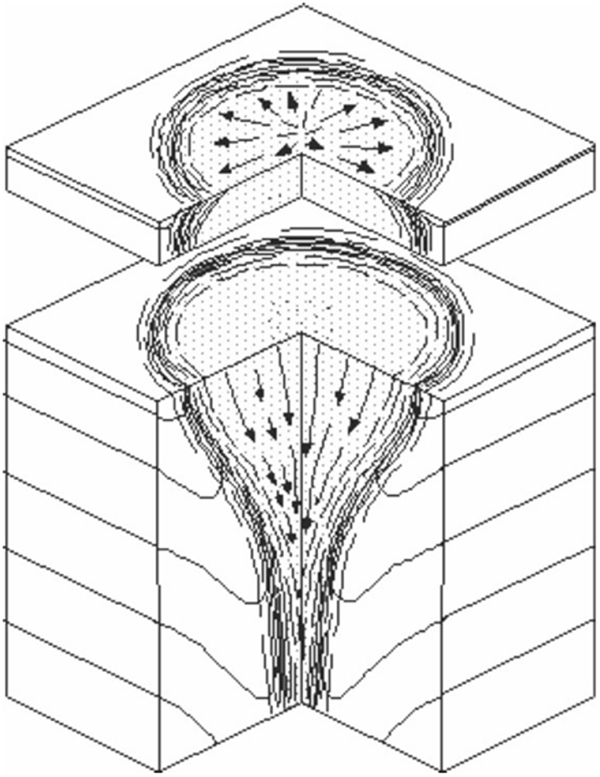
Diagram of a granitic diapir showing the structural features expected in both the pluton and the surrounding wall rocks, modified from Fig. 6.1 of Clemens et al. (1997). The arrows indicate plunge directions on lineations. Note the rim syncline in the wall rocks Experiments by Ramberg (1981) demonstrate how this structure develops and serves to efficiently exhume highly deformed sections of the wall rocks through which the diapir must pass
In contrast to diapirs, granitic dykes are common among rocks originally from many depth regions of the crust. The widths of major granitic dykes vary from metres to hundreds of metres. In migmatitic terranes, granitic veins occur on scales down to the millimetric. Late differentiates of granitic magmas (mainly aplites) are commonly intruded as small dykes that range in width from a few centimetres to a metre or so. Clearly, granitic magmas can penetrate crustal rocks by brittle fracture mechanisms operating on a variety of scales and with a great range of mechanical properties of the wall rocks.
The bases of large granitic plutons are not commonly exposed. However, where they are, many have one or more root zones fed by large dykes (e.g. the High Himalayan leucogranites, Scaillet et al., 1995 and the Chemehuevi Mountains plutons, John, 1988). Geophysical surveys have detected examples of non-diapiric smaller plutons apparently fed by small, stalk-like structures (e.g. Vigneresse, 1990) or linear, dyke-like features (e.g. Clemens and Benn, 2010). Fowler (1994) and Ablay et al. (2008) investigated the ways in which the transition is made between dyke ascent and bulbous pluton growth. The weight of field evidence thus favours dyke ascent of granitic magmas.
Thermomechanical modelling of ascent mechanisms
Diapirs
Diapiric ascent of magma in the lithosphere can be modelled assuming either Newtonian or non-Newtonian rheologies for the wall rocks. In its simplest form, the buoyant ascent velocity of a spherical, isothermal diapir through isoviscous country rock can be approximated using Stokes law

If the crust is Newtonian, a rising granitic diapir must expend considerable thermal energy to soften the surrounding rocks, lower their viscosity and continue its ascent. Heat loss, crystallisation and viscosity increase (in both magma and wall rock) all result in diapirs stalling at depths of at least 14 km (e.g. Mahon et al., 1988). Furthermore, during hot Stokes flow, deformation in the surrounding country rock should propagate outward over many body radii (Marsh, 1982). As pointed out above, there appears to be little geological evidence for the predicted ascent-induced deformation around granitic plutons.
A possible explanation for the lack of observed deformation near proposed diapirs is that ascent models based on hot Stokes flow are unrealistic and oversimplified. Indeed, since all rocks have temperature-dependent viscosities, the assumption of isoviscous wall rock around a rising diapir will be invalid. A more sophisticated approach is required to model diapiric ascent through non-Newtonian crust. In this case, diapirs may ascend more rapidly than the above analysis suggests. In country rock exhibiting power-law behaviour, viscosity will decrease toward the diapir contact, due to either thermal or strain-rate softening (Mahon et al., 1988; Weinberg and Podladchikov, 1994). Mahon et al. (1988) suggest that a diapir could rise a maximum of 15 km in 104 years (V = 5×10⁻⁸ m s−1) before freezing, with ascent velocity strongly dependent on the rheology and ambient temperature of the country rock.
More recently, strain-rate softening has been suggested as an alternative to purely thermal weakening of wall rocks around a rising diapir (Weinberg and Podladchikov, 1994), permitting ascent on time-scales comparable with the cooling of large magma bodies (∼105 years). This suggestion certainly merits further investigation, but is based on long thermal extrapolations from laboratory experiments at unrealistically high T, and on materials (Westerly Granite) that may be poor models for the continental crust as a whole.
Even if the crust were to continue to deform plastically, as a substance with a power-law exponent of 1·5–2·5, the modelling of Weinberg and Podladchikov (1994) predicts emplacement depths comparable to those obtained using models that involve thermal softening of the wall rocks. Though the calculated rates are faster than those based on hot Stokes ascent (around 10−7–10−6 m s−1 for power-law crust), the diapirs would still ascend on a time scale that would allow considerable conductive cooling. This would militate against production of shallow-level, silicic magma chambers.
Thus, our current understanding of diapiric ascent implies that shallow-level felsic magma chambers should not exist. Against this prediction we have to weigh the known presence of active rhyolite magma chambers at just a few km depth (see e.g. Smith, 1979). We must also account for the huge plutons (>103 km3) apparently emplaced at similar depths. Pluton-spacing arguments, coupled with estimates of relative volumes of crust and a mobile (partially molten) layer, have also been used to show that diapirism is unlikely to account for the observed volumes of granitic rock in the upper crust (Vigneresse, 1995). Interestingly, diapiric thermal death by increasing crystallisation (even with the latent heat that this provides), carries with it the important implication that diapiric ascent should give rise mainly to diapiric emplacement, since the magma would have little or no potential to migrate farther once the diapiric process had finished.
Dykes
Buoyant ascent of magma in, or propagation of, a fracture (dyke) of width w is powered by the same buoyancy as in diapirism. However, the factor limiting the vertical ascent velocity V is not wall-rock viscosity but the magma viscosity (ηm):

Over many years, there has been a common perception that granitic magmas are extremely viscous. In contrast to this view, it has been shown above that granitic melts will have rather moderate viscosities of ∼105 Pa s. Increasing pressure will lower the viscosity slightly, but the effect is very small at crustal pressures, and crystal contents up to 30 vol.% should produce only a relatively small increase (≤ one order of magnitude) in effective viscosity.
Using the above value for magma viscosity, the equation above predicts ascent at about 3×10⁻³–1 m s−1 for dykes of 3–13 m width. A typical ascent rate would be 0·1 m s−1. These values are 104–108 times faster than any modelled diapir. The kinematic analysis of Spence and Turcotte (1990) has shown that dyke (fracture) propagation is commonly catastrophic, and this holds true for fracture propagation with granitic magmas (Clemens and Mawer, 1992). That is, the effective strength of the crust is negligible and the fracture will be self-propagating, as long as it contains buoyant magma with a viscosity in the calculated range.
As for diapirs, magma freezing will limit the degree of magma ascent in a dyke, so a granitic dyke must attain a critical minimum width wc such that the flowing magma can advect heat faster than conduction through the walls. Petford et al. (1993, 1994) showed that the critical minimum dyke width varies with the fourth root of the magma viscosity ηm according to the relation

The next question concerns the efficiency of fracture ascent of granitic magmas. Can dykes supply magma to a growing felsic pluton at rates sufficiently high to permit formation of a molten (or partially molten) mass faster than solidification by conductive cooling? Modelled as a horizontal sheet 3 km thick, emplaced into wall rocks at 100 MPa and 100°C, the core of a granitic magma chamber would cool from 850°C to the solidus (∼700°C) in 30 000 years. The typical magma ascent rates (see above) can be used to calculate the time required for ascent through the crust, say 20–30 km. Thus, a continuously fed and extending dyke would penetrate the crust in a matter of days to weeks. Once an ascent path was established, a dyke 1 km long (in plan) and only 3 m wide could supply a growing pluton with 1000 km3 of magma in ∼1200 years. Solidification of the chamber would take at least 25 times as long.
Thus, there is little doubt that dyke transport of granitic magma can be both rapid and efficient. Though small fractures cannot survive for long, they can interconnect to feed larger viable fractures or they can feed into existing faults or shear zones. Such large faults are prominent in Andean margin settings. In South America, granitic intrusions seem to be elongate in a N–S direction and many are localised along crustal-scale fault zones. This suggests that these deep faults may have facilitated both magma ascent and emplacement (e.g. Wilson and Grocott, 1999). The rate-limiting step in pluton formation is unlikely to be magma ascent, but rather the rate of melting (thermal transfer) in the source region or the rate at which deformation can accommodate magma emplacement. Table 1 lists various features of granitic diapirism and fracture ascent and indicates the differences as well as the observations and characteristics that strongly favour dyke ascent of granitic magmas.
Features characteristic of the two main competing models for ascent of granitic magmas through the crust
assuming differentiation actually occurs.
NB Features in italics are those that most firmly favour dyking over diapirism as the main mechanism for magma ascent.
Emplacement of granitic magmas
Emplacement of granitic magmas has traditionally been subdivided into:
forceful mechanisms that create their own space (e.g. diapirs)
passive mechanisms, in which the magma fills a space created by other means (e.g. fault jogs).
This huge topic is largely beyond the scope of this review. Suffice it to say that emplacement has been shown to take place by a large number of different mechanisms, sometimes with combinations of mechanisms acting in concert. Granitic diapirism appears not to exist. However, ballooning, laccolith formation, roof lifting, floor depression, cauldron subsidence, permeation of shear zones, emplacement into fault jogs, fault wedging, stoping and various forms of eruption (mostly explosive) all appear to play their parts. The question of depth of emplacement is also complex. The idea that magmas are emplaced at their neutral buoyancy levels cannot be supported, otherwise basaltic magmas would stop in the deep crust and never be erupted, and granitic plutons would not show their characteristic negative gravity anomalies (see Vigneresse and Clemens, 2000). Clemens and Mawer (1992) suggested that ascending magma-filled cracks can be deflected or stopped when they encounter things such as freely slipping fault planes, prominent joint surfaces and easily deformable rock bodies (e.g. limestones), all of which can blunt the crack tip and cause ascent to cease. Some of these mechanisms have certainly operated. However, many granitic bodies are found emplaced with no apparent relationship to any of these features. It seems likely that one control on emplacement may be changes in the orientation of the principle stress directions within the crust. Another factor is probably the shutting off of magma supply, which would shorten the height of the magma column and reduce buoyancy in a magma-filled fracture.
Tectonic context: Batholiths, volcanoes and subduction
An important question is whether we can equate the behaviour of volcanoes in arc settings with the formation of granitic batholiths. This is not just a question of the compositional equivalence of arc volcanic rocks and batholithic rocks, but one of the exact role played by subduction of oceanic lithosphere in batholith formation.
The 2000 km long Coastal Batholith of Peru, and associated volcanic rocks that lie along the western edge of continental South America, provide what has become a type example of subduction-related (Andean) magmatism. It is also an example of how geological misconceptions are propagated. This region is commonly held to show an array of mid-crustal plutonic complexes that represent the eroded core of a former volcanic arc that possibly collided with the adjacent mainland. In fact, most of the plutons that make up the Batholith were emplaced at pressures less than 100 MPa, with many of the high-level stocks emplaced virtually at the surface (Atherton, 1990). There are close field relationships between high-level ring complexes and surrounding volcanic rocks. However, the volcanic rocks are, on average, 30 million years younger and separated from the ring complexes by a major erosion (peneplanation) surface (Pitcher et al., 1985). Thus they are unlikely to represent vented products of the crystallising Batholith (Petford and Atherton, 1995).
Even more importantly, the Batholith was intruded in an extensional tectonic environment, during a period of intense intracrustal rifting. Extension was such that the country rocks, into which the Batholith was emplaced axially, form a basinal sequence (up to 10 km thick) of mid-ocean ridge basalt to enriched basalts and basaltic andesite lavas, hyaloclastites, mafic volcanic rocks and minor intrusive rocks. Geochemical studies have shown that the rocks of the Batholith are best modelled as partial melts of the predominantly submarine arc volcanic material. It seems likely that the entire Batholith was emplaced below the sea in a marginal basin similar to the present day Gulf of California (Atherton, 1990). We have only a vague notion of the role (if any) that subduction played in batholith formation, apart from providing a mechanism for hydration of the mantle wedge.
Volcanism versus plutonism
It is important to clarify the distinction between granitic plutonism and rhyolitic to dacitic volcanism. The only clear difference between these magmas (taking a global view) is one of emplacement style and depth. There appears to be nothing different between felsic volcanic and granitic magmas in terms of chemical (including initial volatile content) or isotopic composition, the initial magma temperatures or the inferred conditions of magma genesis (Clemens, 1984; Clemens and Wall, 1981, 1984). Emplacement depth seems to be an accident of local conditions encountered by the magmas as they ascend through the crust. In some cases the structures, rock-types and stress states favour volcanic and, in other instances, plutonic emplacement. Felsic magmas are not predestined to form either volcanic deposits or batholiths, nor are they predestined to form both.
How long does it take to build a batholith?
As shown above, the felsic magmas that form great batholiths were dominantly in the compositional range of granite to granodiorite. Local derivation of the melt is generally not supported by the petrological, mineralogical and isotopic data, nor is the idea that the felsic melts were the products of fractionation of mafic magmas. It seems clear that the magmas of the great batholiths were mostly generated during partial melting of the deep crust, with or without some juvenile mantle magma input at the source level. These granitic magmas were then transported vertically, up to tens of kilometres, to the sites where the future plutons grew. The most credible mode of transport is by self-propagating fractures or along existing faults (i.e. in dykes). Times required for this will vary from a few weeks to a few months, for an individual magma pulse. Provided that magma supply is sufficient, a pluton of batholithic size can then be constructed in a few centuries to a few millennia. There is no evidence that pluton formation rates are constrained by time-integrated fault slip rates.
Our training leads us to regard geological processes as very slow and more-or-less continuous. Our instinct is to regard rapid or catastrophic rates with suspicion. However, most preserved evidence for geological events indeed chronicles the special and catastrophic rather than the usual and gradual (e.g. Ager, 1993). As an illustration relevant to the formation of a felsic pluton, at Usu-san, on Hokaido island, Japan, a dacite laccolith 2·7 km long and >0·6 km wide was observed to have elevated 155 m in 100 days (Bailey, 1912). This represents an increase of ∼0·2 km3 in pluton volume. If this magma supply rate were maintained, it would require only 1300 years to inflate a batholith of 1000 km3, more of less exactly what was predicted above for a dyke-fed batholith.
Part 3: Numbers
Chemical variation and the evolution of granitic magmas
A magma chamber is not necessarily (never?) a great, circular hole filled with homogeneous magma. However, some sort of chamber must exist to form a future pluton. This section briefly deals with some of the processes that may occur within such chambers.
Compositional structure of granitic plutons
A view from the top
A survey of the literature on the compositional structure of granitic (alkali feldspar granite to tonalite) intrusive bodies reveals scant evidence for horizontal compositional layering, except on small scales, in localised areas, principally in highly evolved zones near pluton roofs. There are certainly many examples of zoned batholiths, stocks and laccoliths. However, this zonation does not seem to be (or to have been) due to horizontal compositional layering that was produced during crystal settling. Most commonly, the records describe ‘bulls-eye’ or vertically striped compositional patternation in granitic rocks. These features are viewed as the results of multiple (pulsed) intrusion or as having been formed during the inward advance of a crystallisation front, with accompanying fractionation. However, the bulls-eye pattern could also result from nested intrusion of contrasting magma batches.
A great deal of evidence has accumulated regarding the pulsed and incremental construction of granitic plutons, e.g. Glazner et al., (2004). This work shows that some ostensibly homogeneous plutons were constructed from numerous small batches of magma over long periods. Note, however, that a protracted period of assembly is not a requirement, and plutons may grow in this same incremental way over much shorter time intervals. Concerning the preservation of source-related heterogeneities, Clemens et al. (2010) have this to say: ‘many silicic igneous bodies, particularly those classified as S-types, are internally heterogeneous in their mineralogy, geochemistry and isotope ratios, on scales from hundreds of metres down to one metre or less. The preservation of these heterogeneities supports recent models for construction of granitic magma bodies through incremental additions of numerous batches (pulses) of magma derived from contrasting sources. Such pulses result from the sequential nature of the melting reactions and the commonly layered structure of crustal magma sources. Internal differentiation of these batches occurs, but not generally on the scales of whole magma chambers. Rather than being created through differentiation or hybridisation processes, at or near emplacement levels, much of the variation within such bodies (e.g. trace-element or Mg# variation with SiO2 or isotope ratios) is a primary or near-source feature. At emplacement levels, the relatively high magma viscosities and slow diffusion rates of many chemical components in silicic melts probably inhibit processes that would lead to homogenisation. This permits at least partial preservation of the primary heterogeneities (Clemens et al., 2010, p. 159).
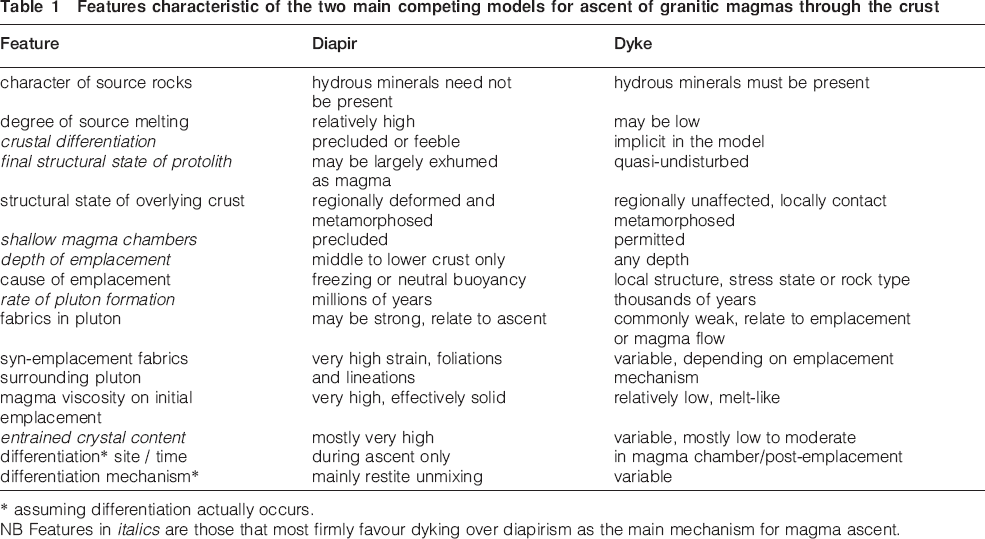
Figure 27 shows some of the internal structure of Devonian granitic plutons, as revealed by the magnetic properties of the rocks. The internal magnetic fabric of the plutons may represent patterns of flow within successive magma pulses. Additionally, the figure shows tentative assignments of magma upwelling sites (stars) and flow patterns (arrows). These are highly speculative, but stars without arrows are meant to indicate possible upwelling sites at which subsequent magma flow was somewhat more equal in all radial directions. Arrows not emanating from stars are meant to suggest the traces of earlier flow patterns, the sources of which appear to have been overprinted by flows from later pulses. The features in Fig. 27 provide evidence for compositional structure, magma pulsing and complex flow in at least some granitic plutonic bodies. Other plutons appear more homogeneous, either because they are or, more likely, because they do not contain strongly magnetic minerals that segregated during magma flow and emplacement.
Map of part of the state of Victoria in southeastern Australia showing the first vertical derivative of total magnetic intensity. The lighter the grey, the higher the magnetic susceptibility of the rocks. The map shows some of the internal structure of Devonian granitic plutons (Dg = unknown type; Dgi = I-type; Dgs = S-type) that intrude Cambrian (Csm) and Ordovician (unlabelled) low-grade metasediments. This is a greyscale version (modified from Fig. 9 of Clemens et al. (2010), reproduced by permission of The Royal Society of Edinburgh) of a section of the 1∶1 000 000 scale map of Simons and Moore (1999), published as an enclosure in VandenBerg et al. (2000)
A view of the bottom
The bases of granitic plutons are seldom exposed. However, when they appear to be, the floors of the former chambers do not seem to have been occupied by mafic magma. In some cases the pluton floors contain accumulations of mafic and large crystals precipitated from the granitic magmas. Hence, we see patchy development of rocks such as hornblendites, glimmerites and logjams of huge K-feldspar phenocrysts. Some of these deposits show structures that resemble scour-and-fill and flow fabrics. It is debated whether these features are really analogues of such sedimentary structures. When mafic magmas do accompany granitic magmas, they are invariably the volumetrically minor phase, by orders of magnitude. Rather than forming mafic layers, they commonly occur as independent satellite stocks. Whereas these show close spatial relationships with the more felsic rocks, they are (with the exception of syn-plutonic mafic dykes and enclave swarms) generally older, and reflect an earlier (precursor?) phase of more mafic plutonism (e.g. Pitcher et al., 1985). It is possible that many igneous enclaves in granitic rocks represent low-volume, precursor magmas that were chilled against cold wall rocks and were fragmented during subsequent pluton growth.
Magma chamber replenishment
The long-lived, periodically replenished rhyolitic magma chambers of the western USA are commonly thought of as models for felsic magma chambers in general. However, there is apparently little evidence for periodic replenishment of granitic batholith chambers, except by pulsed addition of felsic magma during the early stages of pluton formation and space creation. Indeed, pulsed magma supply seems to be inevitable (Clemens and Mawer, 1992). As an example, Wilson (1996) concluded that the intermediate to felsic volcanoes of the Taupo Volcanic Zone (New Zealand) were not fed by any large, long-lived magma chamber; he suggested that this is atypical of arc volcanic regions. However, as pointed out by Whitney and Stormer (1986), many other recent ash-flow eruptions have not left behind large, shallow magma chambers. Instead, pulses of magma were delivered periodically from much deeper sources. Thus, Taupo should probably be considered as relatively typical of felsic volcanic regions.
Magma mingling
It is abundantly clear that many granitic complexes are accompanied by emplacement-stage injection of more mafic (usually dioritic to monzodioritic) magma. There are banded pumice flows, syn-plutonic dykes, enclaves with fractal contacts and chilled margins and net-veined complexes. Syn-plutonic dykes are commonly seen frozen in the process of fragmenting into swarms of magmatic microgranular enclaves. It has thus become very common to ascribe chemical variations in granitic suites (containing enclaves) to processes of magma mixing, a process first proposed by Durocher (1857).
What we see in the field is almost always evidence for magma mingling, not mixing. Mingling is the mainly physical interaction between two magmas, ultimately forming a suspension of the minor phase in the major, with both magmas retaining their recognisable separate identities. Mixing is the formation of homogeneous hybrid magmas through a combination of physical stirring (chaotic stretching and folding) and chemical diffusion (e.g. Flinders and Clemens, 1996; de Campos et al., 2011). Some true hybridisation does occur, as evinced by enclave reaction zones, selvages, gradational contacts and disequilibrium mineral assemblages and textures. Indeed, limited volumes of hybrid mafic to intermediate magmas may commonly be formed adjacent to the sites of intrusion of mafic magmas that provide the heat sources for crustal melting.
Pseudoplastic substances (such as partially crystallised magmas) exhibit huge changes in their apparent viscosities with only small changes in T. This suggests that deterministic chaos may govern their behaviour. Thus the principles of chaotic mingling apply, and we can consider the roles of elliptical and hyperbolic points in chaotic flow patterns, and how they respectively impede and promote mixing. Sparks and Marshall (1986) made the following points regarding these processes:
Intimate mingling causes major changes in magma rheology.
Thermal diffusion is orders of magnitude faster than chemical diffusion. This means that mingling magmas will thermally equilibrate long before mixing by diffusion and shearing.
Mixing depends on the thermal properties of the magmas after thermal equilibration, which will essentially be at the T of the felsic magma.
Three scenarios can be envisaged:
mafic magma remains less viscous than silicic magma
mafic magma becomes more viscous than felsic magma, through crystallisation
mafic magma solidifies (as dykes or enclaves).
The last of these alternatives occurs when the T difference between magmas is large or (as is common) the silicic magma is vastly more voluminous than the mafic magma.
True mixing can only occur when both magmas behave as liquids at the same T. This is not particularly common in shallow magma emplacement sites. When the silicic magma dominates volumetrically, true mixing will only occur with an evolved, more mafic magma (e.g. an andesite). Factors that influence mixing include:
heat contents of the end members
mass fractions of the end members
relative volumes, temperatures and viscosities.
In the majority of cases the more mafic magma will quench against the felsic and the large viscosity difference will then prevent the formation of hybrids. Indeed, it has been shown that many supposed examples of liquid-liquid mingling structures in mafic-felsic systems (e.g. pillows of mafic rock that have scalloped and cuspate margins, Fig. 28) are actually features characteristic of mingling between a relatively low-viscosity felsic liquid and a high-viscosity mafic magma with a high crystal content (Bremond d'Ars and Davey, 1991). Homogenisation is only likely if:
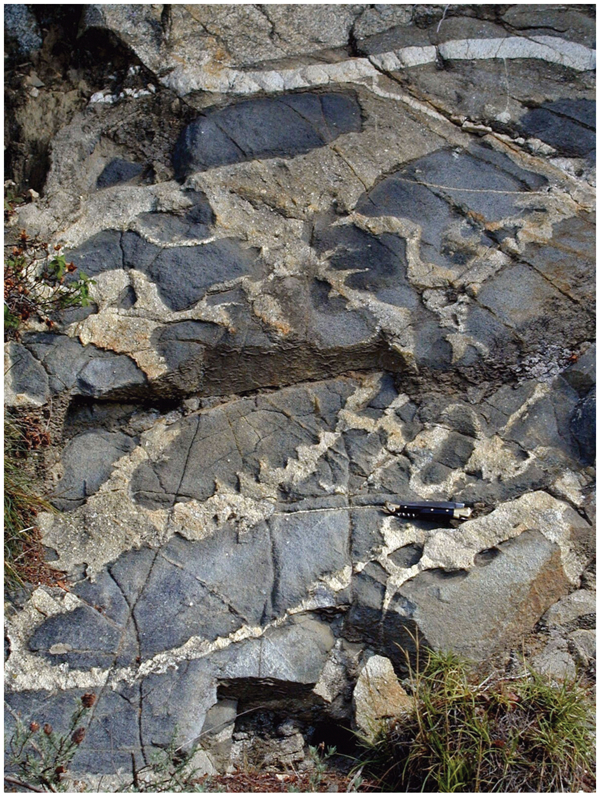
compositional differences between end members are small (around ±10%)
the mass fraction of the mafic magma is large (>0·5).
All this means that magma mingling is the dominant process, as confirmed by field observations. We should not make mixing models for a granitic rock body just because it contains some more mafic enclaves.
The graphs in Fig. 29 show the relationships between ϵNd isotope characteristics of magmatic enclaves and their host granitic rocks from Glen Fyne in Scotland. Although, in this example, the enclaves are consistently more primitive than the host granite (higher ϵNd), the variation is complex, with enclaves that have different characteristics found within a given host rock. Note that there are examples of granitic rocks that have the same or higher ϵNd than their enclaves. Clemens et al. (2009) attributed this complexity to chaotic hybridisation processes involving magma flow, stretching and folding in the enclave magmas. The relationship to the chemistry of the host granite magma is unclear here, and similar patterns have been found in a number of other complexes worldwide (e.g. Zorpi et al., 1989).
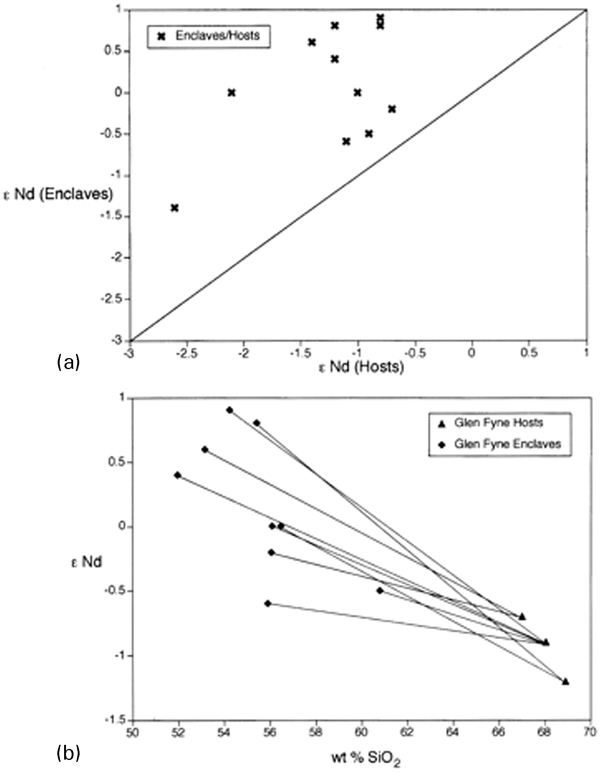
Graphs showing the relationships between a ϵNd for host rocks and enclaves in the Glen Fyne I-type granodiorite pluton in Scotland (Flinders and Clemens, 1996, Fig. 9) and b conjugation lines between enclaves and their specific host rocks on a plot of SiO2 versus ϵNd, for the same rocks (Flinders and Clemens, 1996, Fig. 10). These figures have been reproduced with permission of the Royal Society of Edinburgh
Actually, we can clarify one aspect of the relationships here, with reference to Fig. 30. This plot shows larger grey squares that represent granitic to dioritic host rocks that appear to have been derived through some form of deep-seated mixing process involving hyper-enriched mantle and high-SiO2 crustal melts represented by the cluster of analyses ∼70 wt% SiO2. However, the important feature, in the present context, is the smaller grey squares, which represent the enclaves. Dashed lines ‘d’ join enclaves to their hosts. What this shows is that the enclave magmas were probably derived from an enriched mantle source (similar to EM1?), but were apparently hybridised by mixing with the crustal melts. It also shows that the volumetrically minor enclave magmas experienced this hybridisation, probably through mechanical ingestion of host magma crystals (e.g. Elburg, 1996). Meanwhile, the host series shows variations that suggest that the enclaves hardly influenced the compositions of the much larger volume of host granitic magmas.
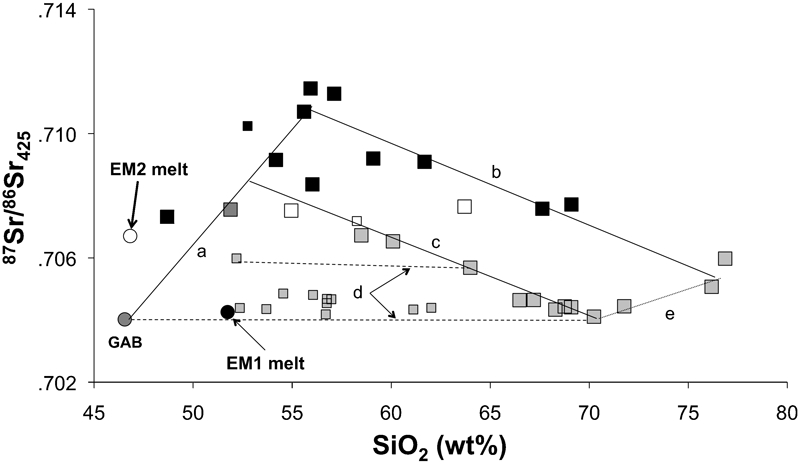
Plot of initial Sr isotope ratio against SiO2, for the rocks of the Glen Fyne and Arrochar intrusions in Scotland, modified from Clemens et al. (2009, Fig. 8, reproduced with permission from Elsevier). Original data sources are specified in Clemens et al. (2008). Glen Fyne granitic rocks are plotted as the larger grey squares and their enclaves as small grey squares. Arrochar points are plotted as black squares (large for hosts and small for the one enclave analysed). Points for melts from the enriched mantle (EM1 and EM2) and an alkali basalt from Greenland (GAB) are plotted for comparison. Note that the points for the Glen Fyne enclaves seem to form arrays (labelled d) that indicate progressive hybridisation of an enriched mantle magma with granitic crustal melts represented mainly by the more felsic Glen Fyne monzogranites. There are various other probable mixing lines plotted (a, b, c and e) but these are not germane to the present discussion regarding enclaves
Some cautions concerning the uses of geochemical data plots
The following are some things that we should remember when attempting to manipulate geochemical data and draw conclusions from statistics or plots of the data. See Chayes (1971) and Rollinson (1993) for more exhaustive treatments.
The use of arithmetic means (averages) masks the wide variations that are common in complex natural systems. Unfortunately, it is impossible to devise a valid statistical test that will reveal true relationships between groups of compositional means, since the real data have already been discarded.
The constant-sum effect (in major-element analyses that sum to 100%) produces closed arrays. With the small number of variables common in geochemical petrology, the number of independent variables is small, or even zero.
The components of data that are quoted as constant-sum ratios (e.g. wt% whole-rock analyses), are interdependent. This induces non-zero null values for correlation coefficients.
Simultaneously obtained, multivariate data are all subject to similar errors. Thus, they cannot be validly analysed by least-squares regression techniques. Robust and weighted least-squares regression both depend on the same theory of least-squares regression, and are similarly flawed. Additionally they filter the data, rejecting some points by using what could be questionable criteria.
Unrelated data produce spurious negative correlations on bivariate plots. Related data from a small number of variables (e.g. oxide percentages in rock analyses) produce enhanced correlations, with small negative gradients, on bivariate (e.g. Harker) plots.
Trivariate plots, that form subcompositions summed to 100% (or 1 whole), produce dependent variables with enlarged variances that no longer retain their initial variance ratios.
Data with zero correlation produce spurious non-zero correlations when calculated as ratios. The induced correlation is greatest when the coefficient of variation of the common denominator is greater than that of the numerators. This is very common in geochemical plots and especially in discriminant diagrams.
Assimilation and fractional crystallisation models: Another caution
The major uses of whole-rock, and isotope geochemical analyses of granitic rocks are to characterise magma source regions (protoliths) and possible processes by which the magmas evolved. Processes commonly considered to be responsible for chemical and isotopic variations include partial melting, hybridisation (magma-mixing), fractional crystallisation, and wall-rock assimilation. Evidence for the effects of these is commonly drawn from interpretation of trends on bivariate element-element, isotope–element and isotope–isotope plots. The need to explain such trends has led to the development of a number of different mathematical models. The results of this modelling ideally permit characterisation of the processes that may have produced the ranges of rock types in a given igneous suite or lineage.
A popular group of models sets out to account for the combined effects of wall-rock AFC, assuming that these processes actually do occur to a significant extent in nature. The AFC equations of DePaolo (1981) became the most widely employed formalism. The mathematical expressions are used to calculate isotope ratios and elemental compositions of hybrids formed as the assimilating or original magma undergoes fractional crystallisation, while simultaneously mixing with another magma or assimilating wall rocks (the assimilant). Trace-element and isotope compositions, derived from the equations, generate curves on bivariate isotope–isotope and isotope–element plots.
This model has been effective in reproducing some trends commonly seen on plots of Nd and Sr isotope data. The governing equations allow assumptions to be made on the ratio r of the rate of assimilation to the rate of fractional crystallisation (an arbitrary fraction) and the bulk distribution coefficient D for the element under investigation. Choices of the values for r and D are typically based on those that produce the best fit to the data set (usually within a broad spectrum of what is considered possible) rather than being founded on any solid geological, mineralogical or experimental data.
One of the widespread uses of this model has been in formulating hypotheses for the formation of calc-alkaline granitic magmas by variable degrees of ‘contamination’ of mantle-derived mafic magmas with crustal materials, at destructive plate margins and in other tectonic settings. However, little or none of this modelling has taken into account the effects that this hypothesised mixing would have on the major-element (and sometimes even trace-element) compositions of the calculated hybrids.
The application of AFC formalism has thus demonstrated how magmas with appropriate Sr and Nd isotope ratios can be modelled using an enormous but poorly constrained range of parameters. Considering this, it seems that such approaches may have little value in petrogenetic studies. Curves generated in this fashion, on bivariate isotope–isotope and isotope–element plots, will always form arrays between the two end-member compositions. This is an artefact of the mathematics governing two-component mixing, as used in the AFC equations. This may explain why such petrogenetic modelling commonly makes use of isotope data in preference to major- or trace-element data. In addition, it is worth noting that isotope data from geographically and tectonically unrelated rocks, plotted on isotope–isotope variation diagrams, form trends similar to those shown for many individual igneous complexes. Hence, the apparent trends produced by these actual rocks, and/or calculated model values, and the resulting interpretations, may be petrogenetically meaningless.
Bearing in mind these features, AFC petrogenetic modelling for the formation of calc-alkaline granitic rock series should be treated with caution. It is easy to assume that data arrays on variation diagrams, of all kinds, are petrogenetically significant, and that they may be interpreted as evidence for the occurrence of a particular process. Models such as AFC are viewed as powerful because of their ability to mimic faithfully these trends, although the presence of such features does not even necessarily imply the existence of a single magmatic lineage. On such plots, data arrays can equally well be interpreted in favour of a number of different petrogenetic processes (see e.g. Wall et al., 1987). Thus, data dispersions on variation diagrams should be viewed with cautious scepticism, as they commonly imply little about the causes of the variation in any specific data set. Mathematical models that attempt to reproduce such trends may be petrogenetically misleading.
Restite unmixing versus other processes
Wall et al. (1987) and Clemens (1989) criticised and largely debunked the restite-unmixing hypothesis for the origin of chemical variations in granitic complexes (see Chappell, 1987). Essentially the restite unmixing idea states that the entire, partially molten source rock is exhumed and ascends diapirically. The progressive separation of pure melt from pure solids (restite) then forms the observed series of rocks. By implication, the source composition lies somewhere along the trends defined by the rock compositions, on Harker plots. The various fallacies involved in this model have been well summarised by Clemens and Stevens (2012). As an example, Chappell and co-workers ascribed the chemical variations in the Jindabyne suite of I-type granitic rocks, Australia, to restite unmixing. As part of their study, Wall et al. (1987) attempted to model this suite as the products of crystal fractionation.
The plots in Fig. 31 show that the trace element variations in the Jindabyne suite are equally well explicable in those terms, provided that the more mafic parts of the suite are regarded as mixtures between accumulated magmatic crystals and residual liquids. However, the reader should bear in mind that there is actually little evidence that fractional crystallisation and crystal accumulation have occurred. As we shall see below, there is significant doubt that granitic magmas ever undergo widespread fractionation by any hypothesised mechanism (see e.g. Clemens et al., 2010; Clemens et al., 2011; Clemens and Stevens, 2012). Rather, it seems more likely that the agglomeration of small batches of magma with different compositions produces much of the observed variation, with differentiation (by whatever mechanism) as a relatively minor ‘overlay’ on the primary, source-related heterogeneity.
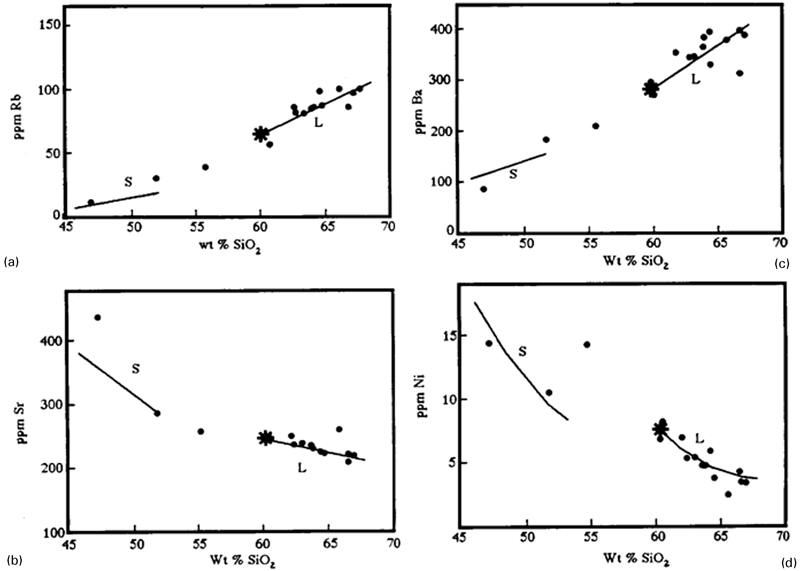
Harker plots showing a Rb, b Sr, c Ba and d Ni variations among the analysed rocks of the Jindabyne suite (from Hine et al., 1978 and Chappell 1984). Calculated liquid and solid crystal fractionation trends are shown, together with an assumed starting liquid composition (star). This figure is reproduced from Fig. 3 of Wall et al. (1987), by permission from the University of Chicago as publisher and copyright holder
Straight lines on Harker plots
As in the case of restite unmixing, simple magma mixing and the unmixing of equilibrium magmatic crystals will produce straight lines on Harker plots of the compositions of the resulting rocks. However, Wall et al. (1987) graphically demonstrated that the degree of curvature on a Harker plot of rocks affected by crystal fractionation is not particularly great, since the bulk distribution coefficients for most elements fall within a narrow range (0·3–3·0) (see Fig. 32).
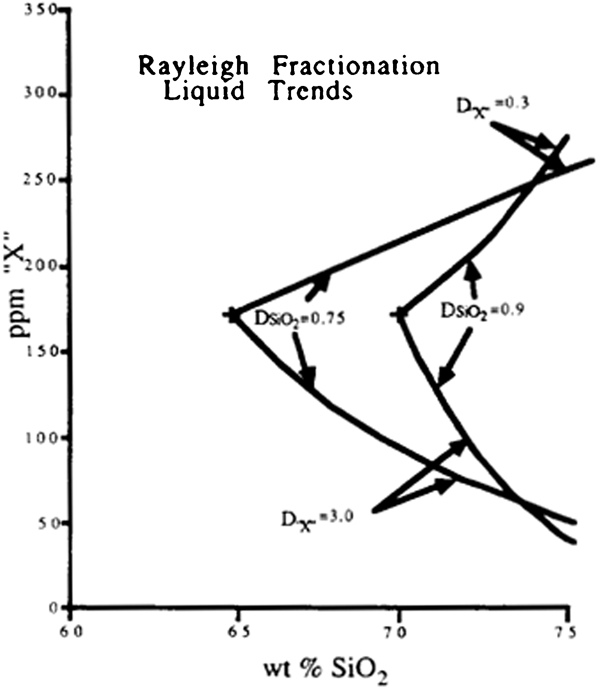
Harker plot showing model liquid fractionation trends (∼50% fractionation) for a compatible element with bulk D of 3·0 and an incompatible element with bulk D of 0·3, for two different starting compositions. Note that none of the curves is particularly strongly curved, especially for the first 20–30% fractionation. This figure is reproduced from Fig. 2 of Wall et al. (1987), by permission from the University of Chicago as publisher and copyright holder
The same authors also produced the pair of models (Fig. 33) for the Jindabyne suite. Plotted on the same diagram it is evident that the curve for the fractional crystallisation model fits the scattered rock data just as well as the linear fit. This has been confirmed by statistical tests. The inescapable conclusion is that Harker plots, and particularly those that show straight-line variations, cannot be used to reliably diagnose any particular petrogenetic process as having operated. Only with a good deal of other data should any model be accepted. So, if all these traditionally favoured processes are rejected, what actually does control the compositions of granitic magmas?
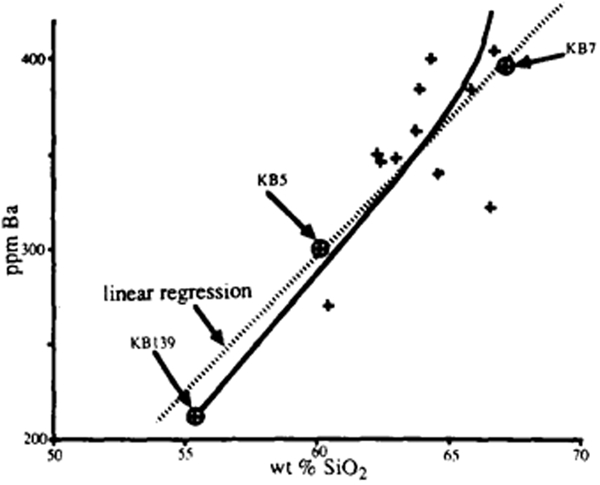
Harker plot showing Ba concentrations in rocks of the Jindabyne suite, together with a linear fir to the data and a model Rayleigh fractionation curve. Statistically there is no difference in goodness of fit (reproduced from Fig. 6 of Wall et al., 1987 by permission of the University of Chicago as publisher and copyright holder)
Peritectic assemblage entrainment
In recent years, a series of papers emanating from the Centre for Crustal Petrology at the University of Stellenbosch has demonstrated that magma mixing, restite unmixing and fractional crystallisation are all inadequate to explain the compositional arrays shown by most granitic series (Stevens et al., 2007; Villaros et al., 2009; Clemens et al., 2011; Clemens and Stevens, 2012).
One fundamental observation is that experimentally produced partial melts of crustal rocks only reproduce the compositions of the most silicic (felsic) of granitic magma compositions, and that the compositional trends for the melts do not plot in the directions followed by granitic rock (magma) compositions. Moreover, only the lower-temperature experimental melts plot within the fields for the natural rocks (at the felsic end of the compositional spectrum). This is illustrated in Fig. 34 and it means that increasing T of partial melting is not what causes the progression of magmas toward more mafic, less silicic compositions. We shall see below just what mechanism is in play here. Note that the parameters in Fig. 34 are in units of moles per 100 g sample (Ti = titanium, FM = Fe+Mg). These units make it easy to relate the trends to particular minerals, if that is desired.
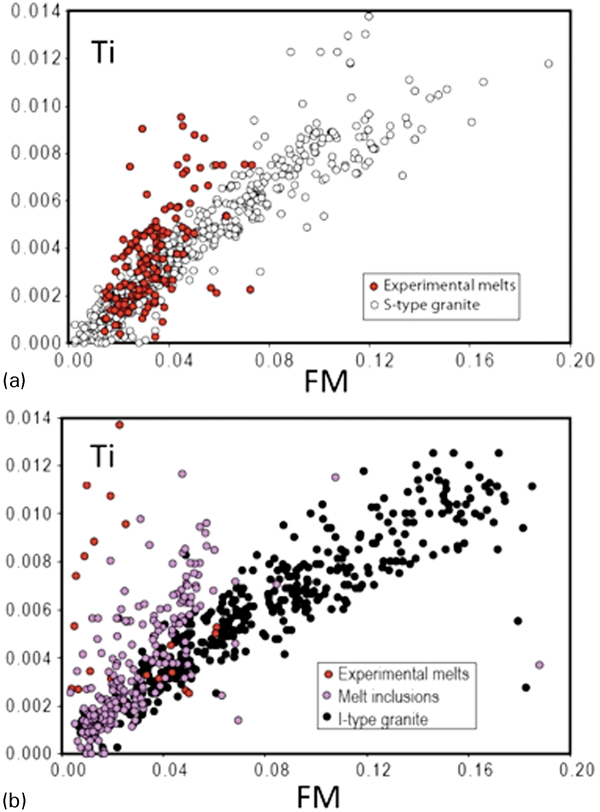
Variation diagrams comparing the Ti–FM compositional trends for granitic rocks (worldwide) and those for partial melts produced from experiments, on crustal rocks, at T≤1000°C, a for S-type rocks and partial melts of metasediments and b for I-type rocks and partial melts of dacitic to andesitic rocks. These plots are reproduced from Figure 3 Figs. 3a and 4a, respectively, of Clemens and Stevens (2012), by permission from Elsevier. Ti and FM (maficity) are in units of moles per 100 g and FM = Fe+Mg
Another key observation is that the geochemical trends shown by both granites, in general, and by rocks from single complexes, in particular, do not project into the fields occupied by normal mafic igneous rocks. Fig. 35 illustrates this point for I-type granitic rocks, worldwide. Here, the points for the granitic rocks (black circles) define an array that extends to higher FM but nowhere near into the main part of the field occupied by basaltic rocks (grey squares and green squares). This must mean that, in general, mafic-felsic magma mixing cannot be responsible for the compositional variation among I-type granitic rocks.
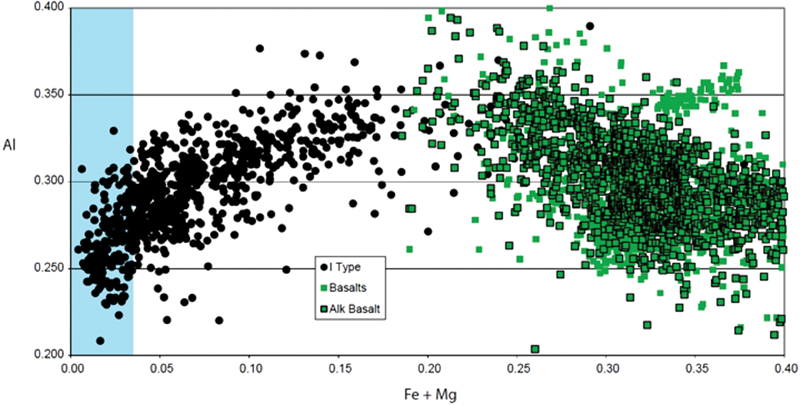
Plot of molecular Al2O3 against maficity for I-type granitic rocks (worldwide), along with points (in green) for all basaltic rocks. This plot is from unpublished work (personal comm. Professor G. Stevens of Stellenbosch University, South Africa; reproduced by permission from the author)
A third significant point is that, for the majority of granitic series, major- and trace-element variations cannot be explained as series of liquids derived through crystal fractionation from a parent magma that lies toward the mafic end of the compositional spectrum. This is because the required proportions of fractionated minerals are commonly far larger than can be found in any rock in the complex. Thus, our traditional favourite variation mechanism is also inadequate to explain what is happening in granitic rock series.
The first inkling of a solution to the problem came when Stevens et al. (2007) discovered that the compositions of S-type granitic rocks of the Peninsula batholith (Western Cape, South Africa) follow linear arrays parallel to those that would be produced if leucogranitic melt were mixed with varying amounts of garnet. Where would such garnet come from? These authors reasoned that crystals of peritectic garnet, produced as a solid product of the melting reactions that created the magmas, could potentially be entrained, in varying amounts, along with the segregating and ascending granitic melt. Thus, the magma compositional series would not be caused by unmixing of all the solid crystals in the protolith. That would constitute restite unmixing, in which the whole source would need to be mobilised and then the different rock compositions formed by linear unmixing of the solid (restite) fraction. Rather, peritectic phase entrainment would produce an initially variable set of magma compositions through selective entrainment of only the peritectic garnet crystals, without any significant fractionation occurring.
As observations (on both igneous and partially melted metamorphic rocks) accumulated, and the model was tested, it was realised that it is the small grain sizes of the newly formed peritectic phases (compared with the larger grains of pre-existing minerals) that allow these peritectic phases to be selectively entrained into the magmas. Furthermore, it became apparent that, in most granitic series, the melting reactions would produce several peritectic mineral phases, such as garnet, pyroxenes, new plagioclase and ilmenite, and that all these small new crystals could be entrained, in fixed proportions that reflect the stoichiometries of the melting reactions. Thus, this mechanism of producing primary magma heterogeneity is now known as peritectic assemblage entrainment, reflecting that, for any given rock series, it is not a single peritectic mineral that is entrained but rather an assemblage of minerals formed by the melting reactions.
With reference to Fig 34, in the case of the upper panel (Fig. 34a), the S-type granites can be modelled as mixtures of melt plus peritectic Opx, Grt, Pl and Ilm. For the I-type rocks (Fig. 34b), mixtures of melt plus Opx, Cpx, Pl and Ilm produce the magmas, but the band of compositions is wider than for the S-types. This is because the melting reactions for the S-types all involve essentially biotite breakdown. However, in the I-type sources, hornblende and biotite are both breaking down in the melting reactions, and the proportion of biotite relative to hornblende varies, resulting in a range of mixing slopes. Note that, in both cases, if we plot only rocks from a single pluton or complex, the variation shows much less scatter and is far more linear. This means that individual I-type plutons have sources with relatively fixed mineral proportions (biotite-hornblende ratios).
Comments on crystallisation and rock texture
Contrary to general perception, coarse-grained texture implies neither long crystallisation times nor great crystallisation depths. There are numerous examples of subvolcanic batholiths and stocks (emplaced at P<100 MPa) that have coarse-grained textures. Some of these intrude relatively thin volcanic piles of similar age and some contain miarolitic cavities (see e.g. Harker 1904; Phillips et al., 1981; Clemens et al., 1986). The large crystals (2–6 mm) grew because nucleation density was low, typical of tectosilicate crystallisation in slightly undercooled felsic melts (e.g. Swanson, 1977). Experimentally determined growth rates of feldspars and quartz in granitic melts (Swanson and Whitney, 1972; Muncil and Lasaga, 1988) are in the range of 10−6·5–10−11·5 m s−1, for a magma at temperature 100°C below its liquidus. This means that crystals 5 mm across could form in a few hours to 25 years. Another important factor is the absence of pressure quenching or chilling to produce medium to small crystals. Indeed, pressure quenched rinds have been described on the roofs of coarse-grained granite batholiths (e.g. Phillips et al., 1981). This said, it is important to consider whether the long-lived volcanic magma chamber represents a good model for the formation of granitic batholiths.
Experimentally determined crystallisation phase relations and some final comments
There have been numerous experimental studies of granites and related rocks. Most of the early work was done under H2O-saturated conditions and is thus only appropriate to the later stages of crystallisation. Also, a good deal of this work was actually melting of crystalline solids rather than crystallisation. More recent experimental studies used glassy starting materials and controlled the melt H2O contents by various means. From such data, T–H2O content diagrams, such as Fig. 36, can be constructed. Such diagrams can be used, in conjunction with texturally determined crystallisation sequences, to constrain the possible ranges of early and late magmatic conditions during crystallisation. Note that, in common with many granitic magmas, pyroxene figures as an early magmatic phase. We rarely find pyroxenes in the subsolidus mineral assemblages of granitic rocks because late-magmatic crystallisation enriches the residual melts in H2O and alkalis, and the pyroxenes react out to form biotite and or hornblende, depending on the magma chemistry. If readers look carefully at their high-level and subvolcanic granites in thin section, they will almost certainly be able to spot aggregates of biotite-quartz or amphibole that pseudomorph the original pyroxenes.
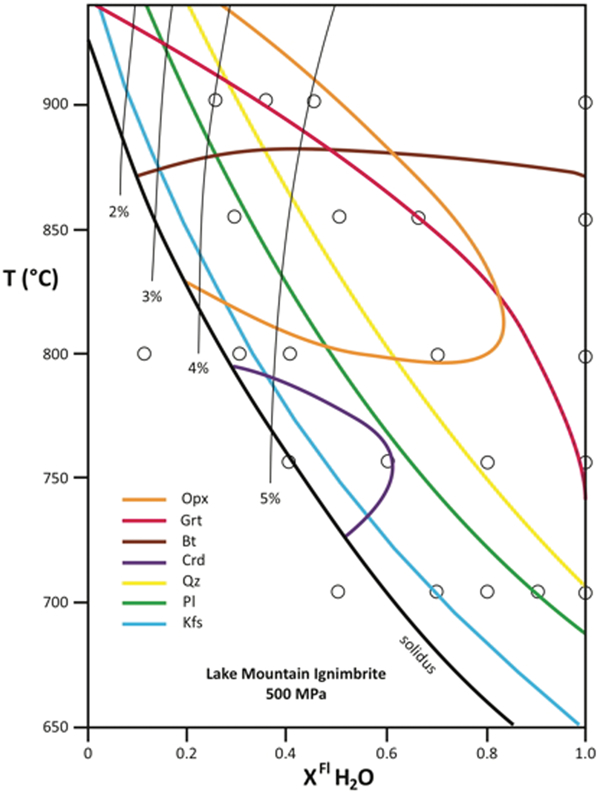
Plot of temperature against the mole fraction of H2O in COH fluid (XFlH2O) for 500 MPa (5 kb) experiments on the Lake Mountain Ignimbrite (a ‘rhyodacite’) with the experimental points marked as small circles. The mainly calculated solidus is shown as a thick black curve, along with the inferred positions of the stability limits of various mineral species, as indicated. Mineral abbreviations are: Opx = orthopyroxene, Grt = garnet, Bt = biotite, Crd = cordierite, Pl = plagioclase feldspar, Kfs = potassic alkali feldspar and Qz = quartz. Thin black lines show the calculated H2O contents of the melts. This plot is reproduced from Fig. 14 of Clemens and Birch (2012), by permission from Elsevier
A second example (Fig. 37) shows the 100 MPa (1 kb) crystallisation phase relations for a metaluminous A-type granitic magma from SE Australia. In this case, the melt H2O content is given directly on the x-axis. Using textural data from this rock, it was evident to Clemens et al. (1986) that the magma must have initially had a high T (>900°C) and also a relatively high H2O content (∼4 wt-%). High T is generally accepted for such A-type magmas, but the rather normal H2O content (for a granitic magma) was (and still is) a surprise to many, who subscribe to the dogma that ‘A’ stands for ‘Anhydrous’ as well as ‘Alkaline’ and ‘Anorogenic’. Nevertheless experiments ought to be given greater credence than mere belief.
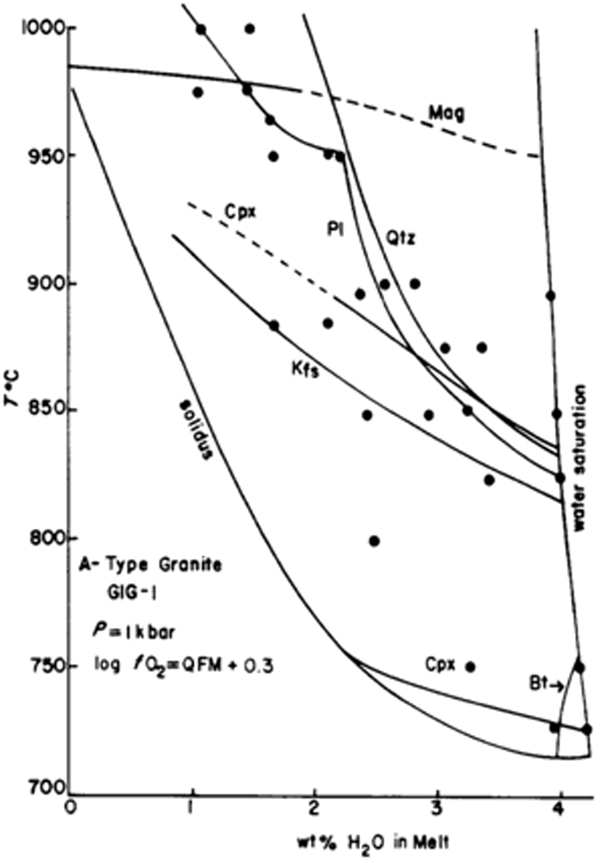
Plot of temperature against melt H2O content for 100 MPa (1 kb) experiments on the Gabo Island Granite (a metaluminous A-type rock) with the experimental points marked as black dots. The calculated solidus is shown, along with the inferred positions of the stability limits of various mineral species, as labelled. The mineral abbreviations are as in Fig. 35, except that Qtz = quartz, Mag = magnetite and Cpx = clinopyroxene. This figure is reproduced from Fig. 2 of Clemens et al. (1986)
Footnotes
Acknowledgements
The early core of this review was compiled for a short course delivered at the University of Witwatersrand, under the aegis of the then Economic Geology Research Unit. This was enlarged and enriched with new material, for use as a teaching aid in advanced igneous petrology at the University of Stellenbosch. Professor Neil Phillips encouraged me to produce this journal version so that the information could reach a wider audience. A good deal is owed to all the academic colleagues and students with whom I have interacted, positively and negatively, over the 30 years or so that it has taken to accumulate the views expressed here. I cannot mention all of them, but the following people, in rough chronological order, particularly enriched my knowledge bank: Dr V. J. Wall, Dr C. K. Mawer, the late Professor A. J. R. White, Professor J. R. Holloway, Dr D. Vielzeuf, the late Professor W. S. Pitcher, Professor N. Petford and Professor G. Stevens. Lastly, I acknowledge the careful in incisive comments and suggestions of two anonymous reviewers, which significantly improved various parts of the text.