
Abstract
This paper summarises the technologies available in exploration and mining and describes techniques of core orientation, marking-up, structure measurement and the visual representation of structural data. We provide a critical comparison of tools and methods available at each stage of the process.
Keywords
Introduction
In the mineral exploration industry, diamond core drilling provides the opportunity to collect structural data relating to a target or deposit. This enables improved and early knowledge and understanding of geological and mineralisation controls of a target, with an outlook to creating all-inclusive informative models from combined surface mapping, geophysics and downhole lithology and geochemical assay data. Quality structural data are invaluable to any project, from greenfield exploration to ore body definition in an advanced project with established reserves. Understanding the structural context of a project enables further exploration, ore envelope and shoot definition, and geological control on parameters for grade interpolation.
The key aim of collecting structural data is to produce a useful structural model. Too often structural measurements are collected as part of the logging routine by core-yard geologists, who are not informed of why and what to measure. This process results in databases full of useless structural measurements that are never interpreted representing a waste of time and money. This paper summarises the process of core orientation, mark-up and subsequent data collection and interpretation, with an aim to empower geologists with the knowledge needed to collect less, better and more useful structural data.
The process of core orientation, mark-up, measurement and subsequent representation can be time consuming and has many potential errors. Quality assurance and control procedures are needed, and care must be taken at every stage of the process in order to produce three-dimensional (3D) representations accurately and cost effectively. Modern technology allows us to produce detailed 3D representations from drill core data but it is important that the structural data collected correctly represents the geology.
Drill core acquisition and preparation
Prior to collecting and interpreting structural data it is imperative that errors during the core acquisition and preparation process are kept to a minimum. Errors can be reduced by ensuring the downhole survey tools and orientation methods are suited to the project, are the most accurate available (constraints on this may include timing, budget and location) and are calibrated correctly. Downhole structural data are of no value if errors that occur during acquisition and preparation of the core are not constrained. To collect useful structural readings from drill core it is important to have an accurate location and orientation of the drill core in 3D space. To obtain these two downhole tools are required:
drill hole depth and deviation measured using a downhole survey tool
the orientation of the core defined using a core orientation tool.
The following section provides a critical comparison of downhole survey and core orientation tools. It is important to note that an accurate collar location is required prior to visualisation of data in 3D, all collars should be surveyed with the most accurate tool available.
Downhole survey tools
Downhole survey tools provide data on up to seven parameters: azimuth, dip, roll angle relative to gravity, roll angle relative to magnetic north, temperature, magnetic field strength and magnetic dip angle. Downhole survey tools fall into two broad categories, those that use magnetometers and magnetic north to orient themselves, and those that use accelerometers, a non-magnetic gyro or optical methods, appropriate if highly magnetic rocks are encountered. A critical comparison of downhole survey tools available at the time of writing is provided in Table 1.
Comparison of downhole survey tools
Drill core orientation methods
There are various methods available for orienting core, some are more appropriate for particular conditions. The geologist should take the following into consideration when planning diamond drilling programmes, and deciding on methods of orientation:
the condition and competency of the rock expected downhole
the accuracy and reliability of the data recovered
the cost of the method, and furthermore, if the method appears to be cheaper than another, does it result in a greater amount of time lost from drilling
ease of use, which can also affect the accuracy of the data
the limitations and benefits of different methods.
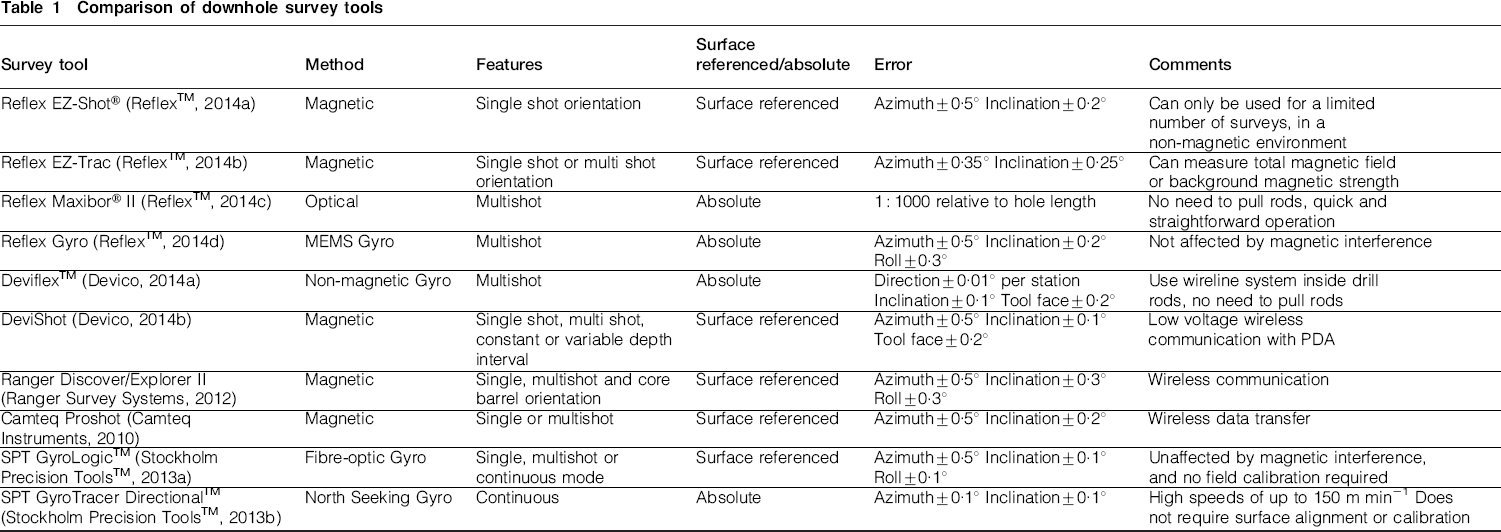
Broadly speaking, the methods fall into two categories. Front-end (contact) methods, that mark or take an imprint of the top of the core stub prior to a run being drilled and back-end (non-contact) methods, which orientate the core or barrel at the moment of core break. Back-end methods rely on the core having not already broken and spun within the inner tube before the end of a run. A critical comparison of core orientation methods is provided in Table 2, a selection of which are shown in Fig. 1.
A selection of core orientation devices discussed and compared in table 2. a Ezy-Mark tool; b Ballmark tool; c Coretell ORIshot tool; d REFLEX ACT III RD tool
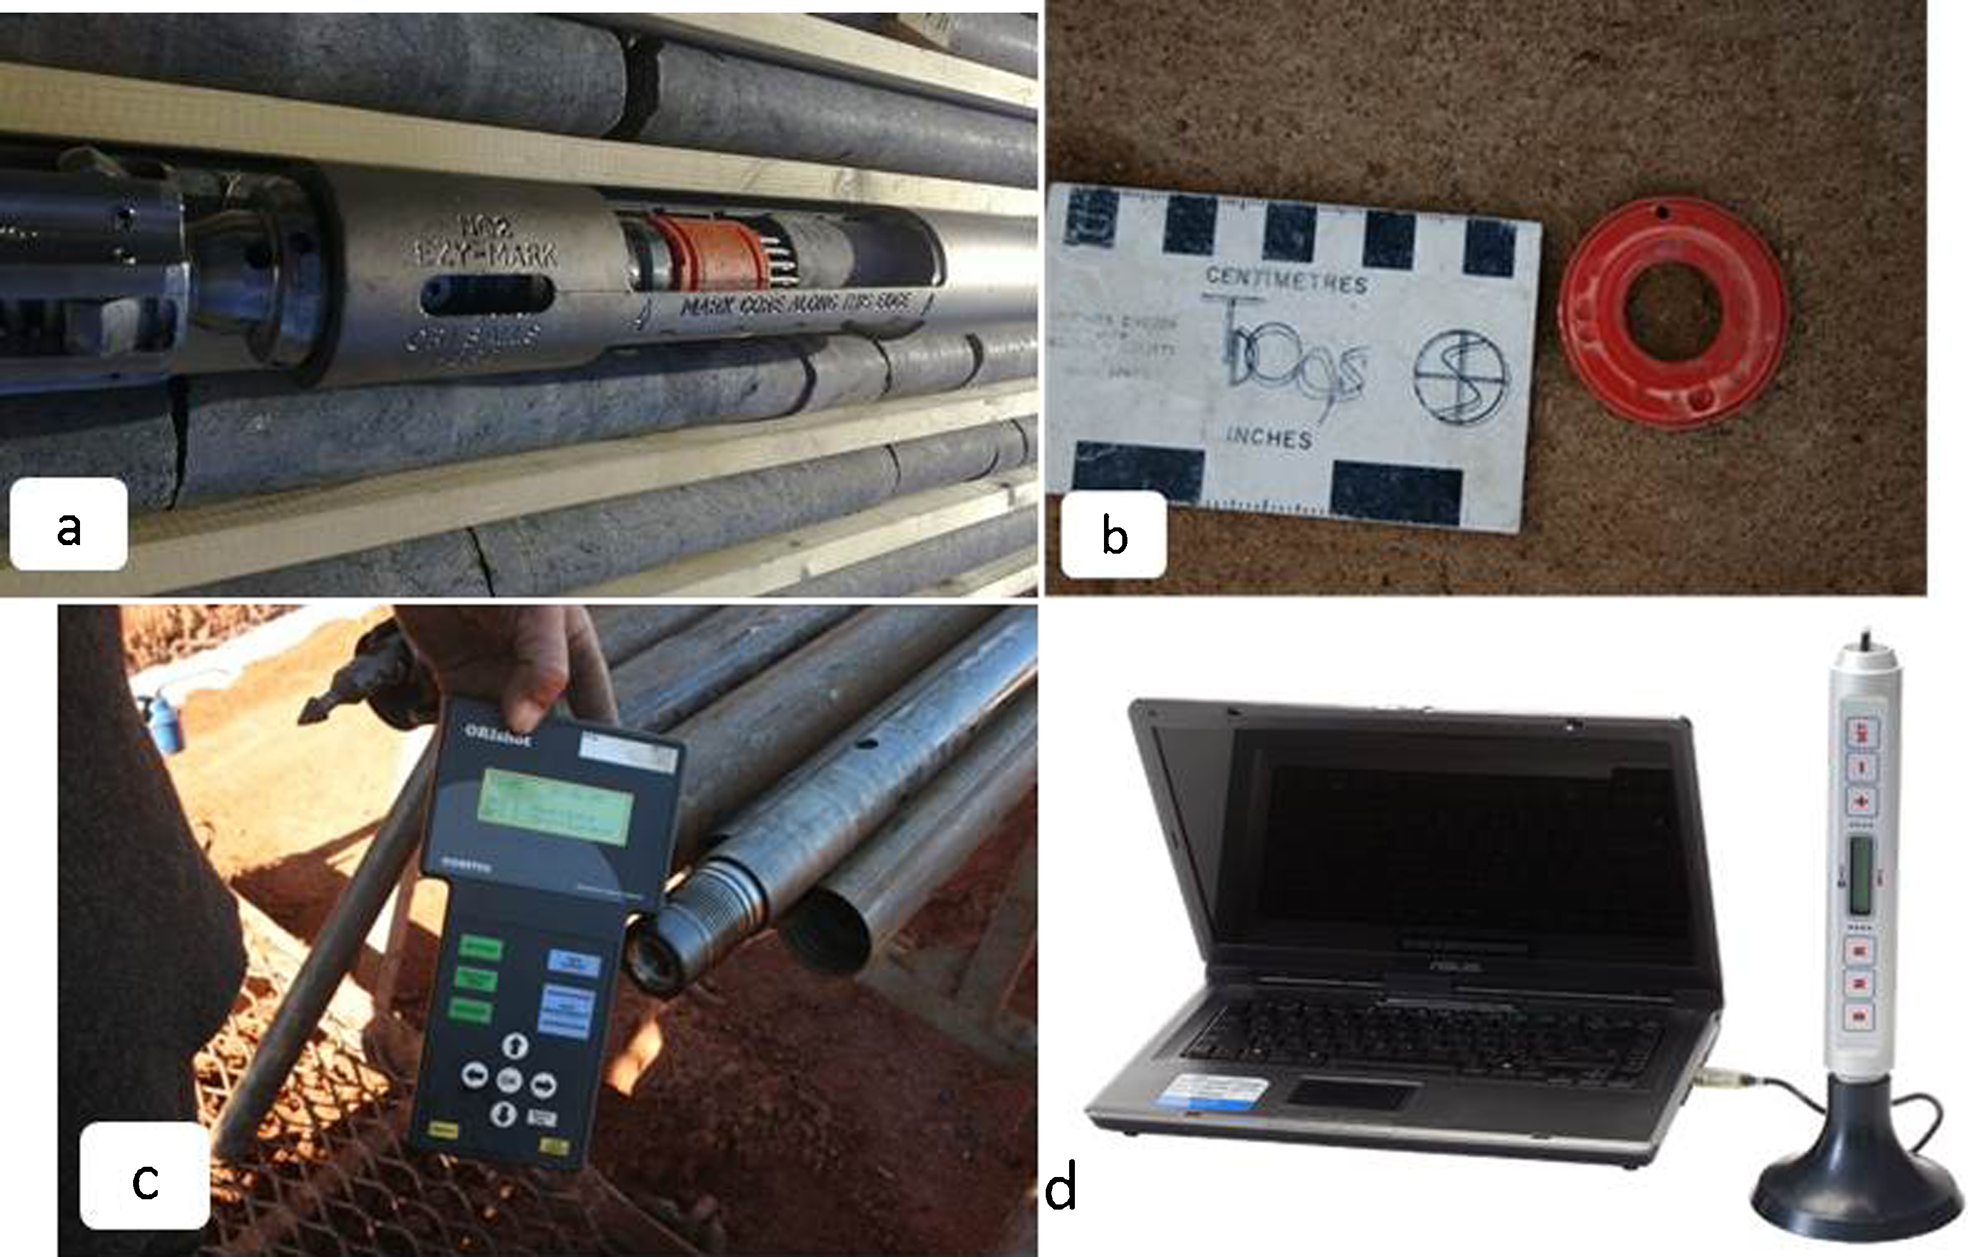
Critical comparison of widely used core orientation methods
Front-end methods
The following methods mark or take an imprint of the top of the core stub prior to a run being drilled.
The spear method uses a heavy steel spear lowered on a wire line inside the drill rods, until contact is made with the core. A sharp point or wax tipped pencil on the end marks the bottom edge of the core (at the top of a run), the spear having slid down the lowest side of the rods due to gravity. Problems may be encountered during the process if the mark is made too close to the edge of the core and then lost during drilling, the pencil mark is made elsewhere on the core due to the pencil not being firmly attached or the spear dropped too quickly, or no mark is made due to the spear being dropped too slowly.
The CraeliusTM consists of a metal holder the same diameter as the core being drilled, containing six movable prongs. The device is clamped in the front of the core barrel and lowered into the hole, its orientation fixed by the orientation of the core barrel or by a simple marker within the device. When the prongs hit the bottom of the hole, they take up the profile of the surface, are locked into place and the device released in order to move up the core barrel as drilling proceeds. When the core is removed from the barrel, the tool is matched to the upper end of the core and the first piece is orientated with respect to the known orientation of the device at the time of locking the prongs. Problems may be in countered if the core spins at the top of the hole as it can erode or destroy the original profile, giving the prongs nothing to match up with.
The Ezy-MarkTM is a mechanical system that is an integral part of the core barrel within the drill rods. Prior to drilling, the Ezy-MarkTM is armed with a wax pencil and fitted into the barrel. It is lowered down to the base of the hole and makes contact with the rock. The position of the tool against the rock is determined by a number of spring-loaded pins. The Ezy-MarkTM produces a mark with the wax pencil to be used for reference when the tool and core are extracted from the hole. When the Ezy-MarkTM is sitting at the bottom of the hole, the tool determines a gravity vector for its position. It uses three balls that are free to move in three annular oil filled races. Once the tool is settled on the bottom of the hole and the pins and pencil have made their template and mark, then the balls are locked in position. Ezy-MarkTM then unlocks itself from the barrel and travels up ahead of the core. A problem that may arise using this method is a loose piece of rock may fall or be sitting on the core stub at the top of the run, and the Ezy-MarkTM will not work. A similar device is the Verti-OriTM, a combined core orientation and borehole survey tool, which uses the same mechanical pins and pencil on the front end of the device to take a footprint of the core stub, just prior to taking a magnetic survey.
The clay imprint/impression technique uses an old inner core barrel half filled with lead. Modelling clay is packed in the core lifter case, which is attached to the downhole end of the orientor. After each run, the device is lowered down the hole and a clay imprint of the bottom of the hole is taken. When the run is removed, this imprint is matched to the top of the succeeding core run; the orientation determined by the ‘way up’ of the device, the lead weight being on the bottom of the hole. The problems with the clay impression technique lie mostly with the surface at the bottom of the hole, if the break is very smooth and flat an impression will be hard to determine alternatively if the break is gravelly or discontinuous this will also result in an indeterminable impression.
The Ballmark® technique relies on punching an aluminium or plastic washer with a ceramic ball that revolves under the influence of gravity and this mark represents the bottom of hole. With this technique, errors can occur if the washer is punched too soon, i.e. before the ball has stopped revolving in the hole. In some cases two indents can be produced on the same washer. This can be due to lowering the rods too quickly, causing compression of the spring when the rods hit the bottom of the hole and bounce.
Back-end methods
The following methods orientate the core or barrel at the moment of core break. A problem with all back-end methods is that core may have broken free and rotated by some unknown amount in the core barrel. Spun core is useless for structural measurements as the orientation has failed and the core can no longer be joined to adjacent runs.
The Reflex ACT core orientation tool is attached to the top of the core barrel, and whilst drilling the ACT uses in-built electronic hardware and software to determine the direction of the down gravity vector across the tool, and records this information in digital memory against a time clock, orienting the barrel. The orientation of the core barrel is determined immediately after a run of core has been drilled and prior to breaking the core free from the ground. After lifting the core barrel out, the orientation of the barrel at that time (established by the Reflex ACT electronics) can thus be transferred to the piece of core locked in the core lifter after the core has been extracted. This provides a bottom of hole mark. A problem with this method is that core may have broken free and rotated by some unknown amount in the core barrel before the ACT tool takes its reading. When this happens, any assumption that the orientation of the core is the same as the orientation of the barrel leads to major error. There is no easy way of knowing when an error has occurred, for the Reflex tool successfully orients the actual core barrel every time. An error can only be picked by the geologist when lining-up adjacent oriented runs. Two other tools that work in a similar way to the Reflex ACT are Coretell ORIshot and DeviCoreTM BBT.
Ezy-OriTM uses gravitational alignment of three balls, which are free to rotate in the tool until the drilled core in the inner tube is retrieved. The orientation is transferred to the core through lining up the oriented balls with a spirit level. The Fordia CorientR is a similar device that again uses three balls which sit in a device at the back of the core barrel and are released when the core barrel is full, to fall to the bottom of the hole. The balls are held in place by a spring mechanism as the device comes up to the surface.
Other methods
Other methods of orientating core are based on the structures or other features in the drill core. Core can be oriented using a known structural orientation as a reference. The accuracy of this method relies on identifying the youngest cleavage, as this has the most consistent orientation throughout the hole (Annels and Hellewell, 1987) and a good knowledge of the area.
An optical televiewer device enables the collection of structural data using 360° images down the drill hole rather than orientating drill core. This method allows the collection of structural data in all drilling including RC holes, but requires significant computer processing so is not suitable for use at the drill rig.
Drill core preparation
Drill core preparation is required prior to the collection of structural data from drill core. Preparation involves marking the core with downhole metre marks and an orientation line along the top or bottom of the core. Although it does not matter whether the orientation line is marked on the top or bottom of the core it is important to keep a note of what convention was used and that the same rule is strictly adhered to throughout the project.
Core mark-up
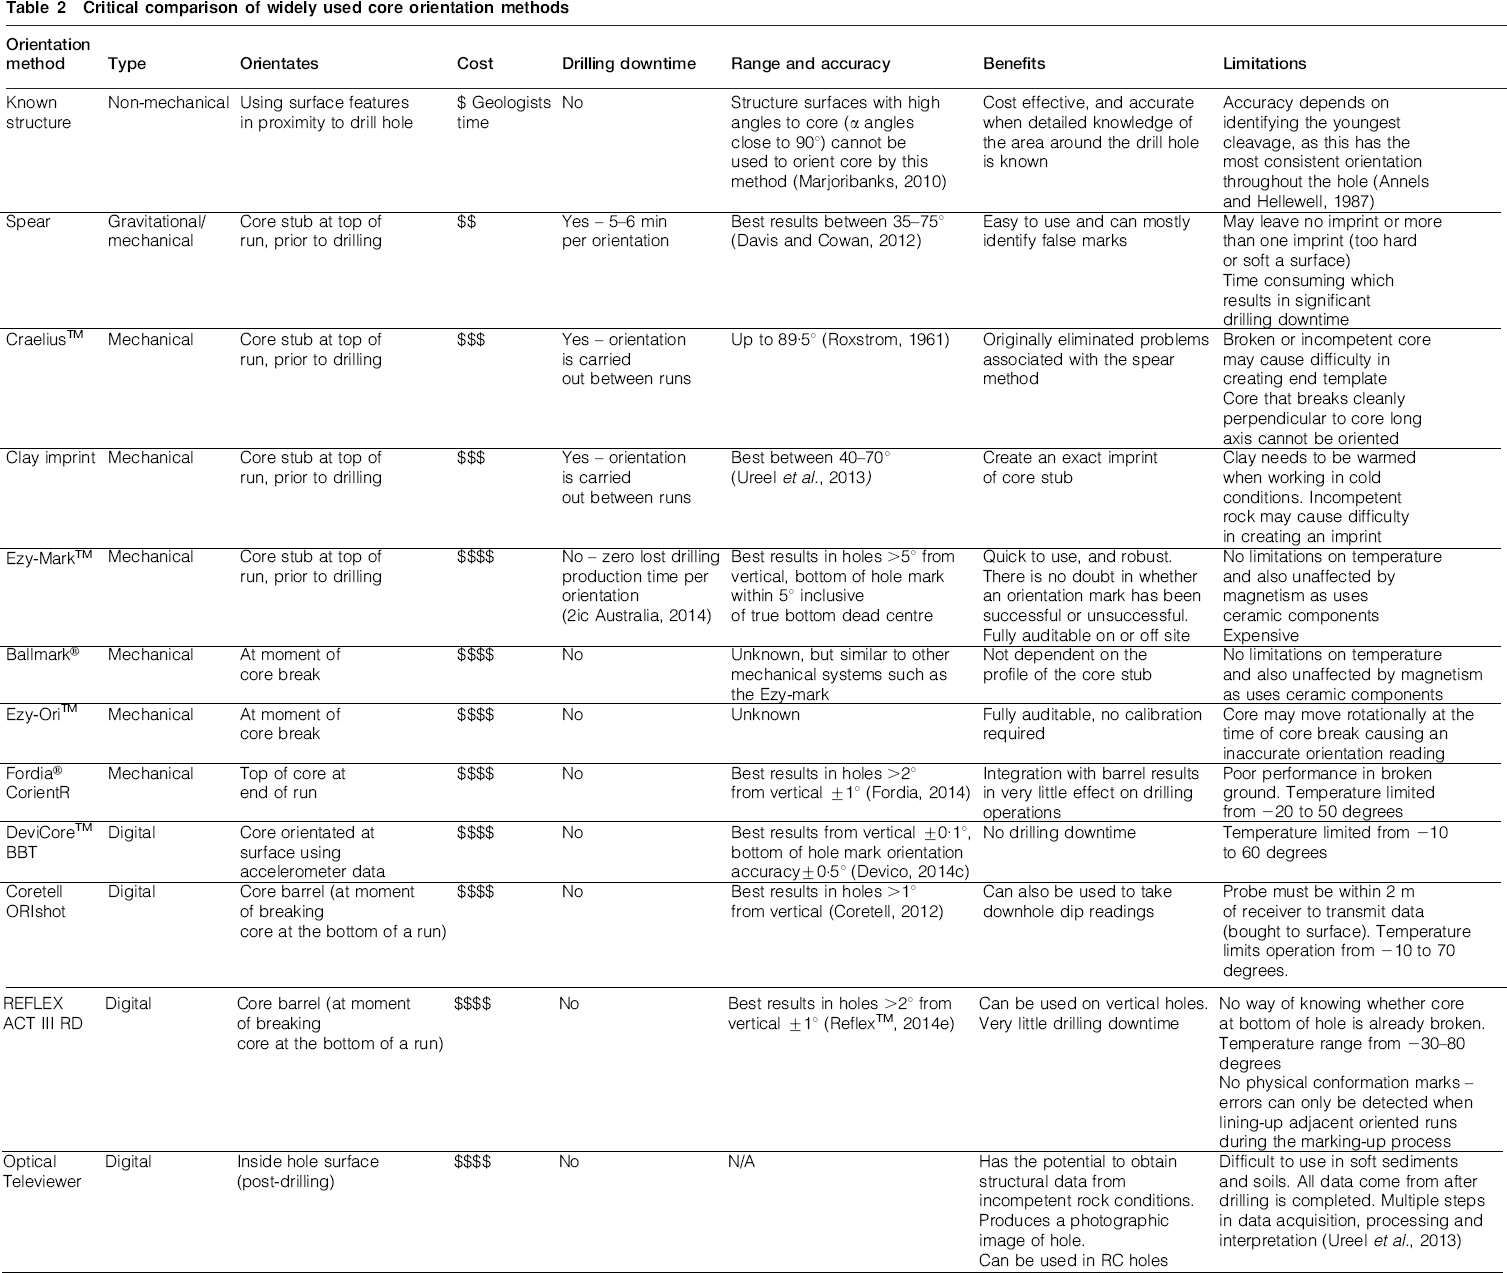
To enable the accurate collection of structural data the orientation of the drill hole must be carefully marked onto the drill core. The most reliable way of achieving this is to use a channel greater than 7 m in length, preferably much longer (∼30 m), to enable as many orientation marks as possible to be lined-up. Importantly core should be joined and locked together (Fig. 2b) and aligned with reference both forwards and backwards between orientation marks. A solid line should only be drawn on sections of core where at least three orientation marks match up with very little variation (a few degrees variation is acceptable). However, if an orientation fails but the core is locked together with at least three other matches occurring around the spurious mark, then it is acceptable to draw on a solid orientation line. A solid orientation line should only be drawn when there is 100% confidence in the joins and orientation marks. A dashed line should be used where there are poor joins between pieces of core (Fig. 2a), where orientation marks do not match or where core has spun in the barrel. Structural data should only be collected where there is 100% confidence in the orientation line (i.e. a solid line) and should never be collected from core with a dashed line. Data collected using orientation lines that are not 100% trustworthy is worse than having no data, as it generates an unreliable output that will carry through to the interpretation and structural model.
Examples of good and bad joins observed in the marking-up process. a a poor join where core breaks cannot be matched accurately together; b good join where the core break locks together
A downhole arrow should be drawn on every piece of core to preserve the downhole direction when core is moved to take structural measurements. Metre marks should be marked on after orientation of the core using drilling core blocks as a guide. When core is cut for sampling it is important to cut to the side of the orientation line and keep the side with the line remaining. This preserves the ability to collect structural data from the drill core in the future.
Geological logging
Before structural measurements are recorded it is preferable to produce an overview log of the drill hole and record the lithology and highlight interesting structural and geological features. This enables structural data to be collected with reference to the local geology and mineralisation.
Structural data collection
Structural logging of drill core should be done for a specific purpose and with a view to the data end-use. A primary aim of structural data collection is to aid understanding of the geology and mineralisation controls of a deposit with an outlook to creating an inclusive informative model, whether a project is in the exploration stage or at an advanced mining stage.
Recording structural data – quantitative and qualitative
The collection of structural data from drill core is a quantitative and qualitative process. The structural logging sheet should accept this, be non-dependent of the equipment used to take measurements or whether data are being entered digitally or on paper. There are two methods that can be used to collect structural readings:
the strike and dip method, where strike and dip readings are taken for planar features, and azimuth and plunge for linear features
α–β methods, where measurements of core angles are taken, α and β for planar features, and γ and δ for linear features.
Quantitative logging of structures should include depth of structure, structure type (structure terminology covered later in this paper), structure fill and texture (for veins), and structure thickness. For the strike and dip method strike, dip, qualifier (NW, NE, SE, SW) and dip direction should be noted for planar features, and azimuth and plunge for linear features. Detailed, sensible and systematic data entry allows geologists of all backgrounds to understand the data (Vearncombe and Vearncombe, 1998). If using the α–β method α and β should be noted for planar features, and δ and γ for linear features.
Although quantitative logging is vital, there are a host of qualitative observations and processes that can be performed to maximise the effectiveness of structural data. In the structural logging sheet there must be a column for comments. Firstly, comments should add value to the data rather than repeating information, e.g. if a vein has been measured and a fill of quartz has been noted, then it is not required to note ‘quartz vein’ in comments. Secondly, common features should not be incorporated into comments, rather put into the rest of the logging sheet, with tailored codes, e.g. if quartz-molybdenite veins appear a sufficient number of times, it is worth creating a code for this specific vein fill, rather than noting ‘qt’ (for quartz) in vein fill, then writing ‘quartz and molybdenite’ in comments. Examples of useful information to put into comments include:
cross-cutting relationships, e.g. one set of veins cutting and offsetting another set of veins, or ductile shears cutting lithological contacts, veining or bedding
folding observations, e.g. s- or z-type folding, open or tight folding
sedimentary features, e.g. fining upwards, flame structures or fossils.
Pictorial logging of structure in core can be completed on the same hardcopy log sheet as the analytical logging, or on a separate sheet if analytical logging is onto a computer. Simple schematic representations of important features supplementing observational comments are a powerful tool in understanding the structure of a drill hole and subsequently, a deposit.
Creating interpretive illustrations of structural relationships must be continual throughout the logging process. Times when illustrations are effective include:
schematic representations of important features while structurally logging
summary diagram (drill trace, cross-section or 3D image) accompanying a written memo at the end of each diamond hole
schematic cross-section interpretation of each drill line
schematic conceptual 3D model of the deposit once a suitable number and spread of drilling has been completed. It is likely multiple models will be developed, then discarded or fine-tuned as more holes are drilled.
Core yard geologists should not be detached from the deposit modelling process. Observations and data collected in the core yard are crucial for creating an integrated model(s) that honour real world observations. The minimum a core yard geologist should contribute is a structural summary report with illustration at the end of each drill hole, including important structures observed and measured how they relate to mineralisation. This can aid deposit interpretation at a later stage.
Representative readings: How many measurements, terminology and what features to measure?
How many measurements?
Collecting a large volume of data are not usually synchronous with understanding the structural geology. Features should be measured based on importance to understanding, not based on a set number of readings, for example two or three readings per tray, or one reading per metre. Taking readings for the sake of having data should be avoided. It is important to identify and measure relevant features, rather than building a large database of measurements measurements that do not aid the understanding of the geology and mineralisation. Often a large volume of data can obscure important features. A drill hole with many bedding readings all of the same orientation is of little use other than to plot a stereonet to show the bedding direction, whereas bedding readings taken every time the orientation changes or there is a major lithological change will be useful later in the interpretation process.
Terminology
Terminology is an important aspect relating to good structural geology. Problems with many code sheets that manifest themselves in the analysis and interpretation of the structural data include:
collective nouns, e.g. foliation and shear. Foliation can describe a number of layered features including cleavage, schistosity and gneissic banding. Shearing can describe a host of deformation intensities, from mylonite to fibres on a small fault
too many codes that describe similar features, e.g. mullion axis and mineral elongation
too few deposit-relevant codes such that different features (some of which would be mineralisation significant) are logged as the same feature, e.g. bedding and sulphide banding.
We recommend creating a deposit or site-specific code sheet for structural logging. Codes designed by site geologists who are familiar with the geology of the deposit will yield an intuitive and practical code sheet. Once a site-specific code sheet is developed it is important for geologists to log and record structural features consistently, especially where there may be several geologists collecting data for the same project. Simple, clear definitions of each structure should be provided to all geologists working on a project and geologists encouraged to communicate effectively with each to ensure they are measuring and identifying the same features.
What features to measure?
Examples of features that should be identified and recorded from drill core include:
Bedding
Bedding should be recorded with particular emphasis on changes in orientation and lithology (Fig. 3f). Where folding is observed bedding should be recorded from both limbs (Fig. 3e), the fold axis lineation may also be measured. Observations that can be recorded as comments include way-up structures such as graded bedding or flame structures. Details that should be recorded include:

A selection of structures that can be identified in diamond drill core. a cross-cutting relationship between quartz veinlet and vein with phlogopite alteration halo; b s-fold in core; c brittle–ductile shear zone; d schistosity in drill core; e folding in drill core; f geological contact in core; g quartz veins in drill core; h mineral lineations on the stub end of a piece of core; i folding in core where the fold axis can be measured
Orientation
Bedding style – the nature of the contact such as gradational, sharp, sheared, faulted or veined
Comments based on observations that will add to future interpretation such as way up structures, folding observations (style of folds or s and z folds), younging.
Mineral banding
Mineral banding can include any bands of different minerals such as sulphide rich bands or bands of alteration minerals.
Mineral alignment
Foliation, schistosity (Fig. 3d) and brittle ductile shear zones (Fig. 3c) are often used to describe the same feature. Codes should be defined for different mineral alignments at a project and all geologists given a site-specific definition on the code sheet.
Veins
Veins are a common feature of many mineral deposits and should be recorded in detail (Fig. 3g). Examples of different features that should be noted are:
Orientation
Vein texture – based on internal structure and/or alteration halo
Mineral fill – dominant or important minerals comprising vein
Comments based on observations that will add to interpretation such as cross-cutting relationships with other features (Fig. 3a)
As a minimum orientation, style (or type), texture, fill, width and associated alteration should be recorded for each vein measurement.
Folding
Large-scale folding can be measured and analysed in core by taking a number of planar measurements downhole and across multiple drill holes. Where small-scale folding is present within core, it is possible to take fold axis lineation measurements. This can be used with bedding information to predict the style of large-scale folds, as the geometry of small-scale folds generally mirrors the larger-scale. Small-scale folding observations, namely s-folds and z-folds identified in core can give the geometry of the large-scale folding, as well as the position on the fold.
Lineations
Measurements from planar features such as foliations (including spaced cleavage, slaty cleavage, schistosity and gneissic banding), shearing (including faults, ductile shear zones, fault breccia and mylonite), joints, fold axial planes and veins are common in the structural logging process in most core yards. However, lineations are often undervalued and rarely measured relative to planar features. Some reasons for this include:
lineations are not immediately obvious when studying core, they occur on the stubs of pieces of core
on-site geologists are unaware of lineations
γ-δ measuring tools are not present within the core yard, or on-site geologists are unsure of how to use them.
Important structural lineations commonly measured in drill core are mineral lineations. Mineral lineations are an alignment of elongate minerals in a preferred direction and are often observed on the ends of pieces of core (Fig. 3h) and hence often missed. These measurements are important, as mineral lineations commonly plunge sub-parallel to ore shoots, therefore can be essential for the prediction of ore body shape and orientation. There are many examples of deposits where mineral lineation directions are related to the plunge of high grade lodes including, gold and antimony-gold deposits in the Zimbabwe and Kaapvaal Cratons (Nutt et al., 1988) and gold deposits in the Norseman-Wiluna belt, Western Australia (Vearncombe et al., 1988). In low-strain systems, ore shoots are aligned with the intersection of foliation and tension gash veining. In high-strain systems, ore shoots are aligned parallel to the mineral stretching lineation. Mineral lineations can also give a sense of fault movement.
Fibrous vein orientations are another example of lineations that can be measured directly from drill core. By measuring the lineation direction of displacement-controlled vein fibre growth, an incremental vein opening history can be deduced. By presenting these lineations on maps and stereonets relationships between vein deformation and macro-scale structures can be identified. Analysis of these measurements are useful in understanding gold mineralised systems in particular complex vein systems in Archean mesothermal gold and other hydrothermal mineral deposits (Vearncombe, 1988).
Other lineations to be aware of in drill core that can also provide indications of ore shoot directions are intersection lineations. The intersection of any two planes is an intersection lineation and examples of this include bedding and cleavage, bedding and fault planes or two fault planes. Although these lineations are sometimes difficult to measure directly, the two planar features can be measured separately then plotted on to a stereonet whereby plunge and azimuth of the intersection can be calculated.
Fold axis lineation measurements taken from small-scale folds in core (Fig. 3i) can be used to predict the plunge of large-scale folds.
Structural measurement techniques
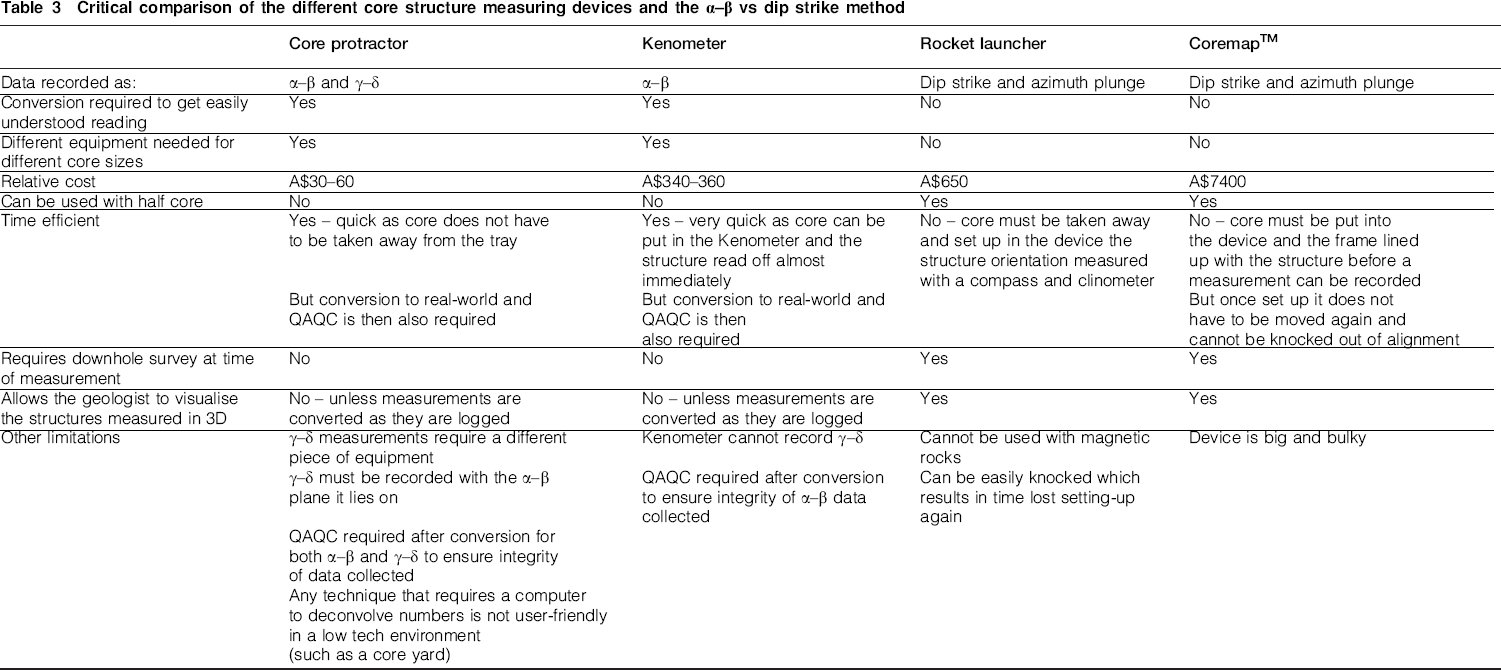
When measuring the orientation of structures in drill core there are two approaches that can be taken with regard to taking and recording measurements. Structural features can be measured and recorded as if the core was an outcrop, where the core is positioned to its true orientation and a strike and dip measurement is taken of a planar feature, or azimuth and plunge for a lineation. The alternative is to take measurements of core angles, which are recorded as α, β, γ and δ. Both techniques have advantages and disadvantages, which are discussed in Table 3.
Critical comparison of the different core structure measuring devices and the α–β vs dip strike method
Strike and dip method
For measuring strike and dip of structures in core the core needs to be positioned as if it were in-situ. To achieve this, core is placed in a device that is set up at the same orientation of the drill hole at the depth of the structure. There are two common devices that can be used for this purpose; the rocket launcher also known as the core orientation device (Fig. 4b) and the CoremapTM (Fig. 4a).
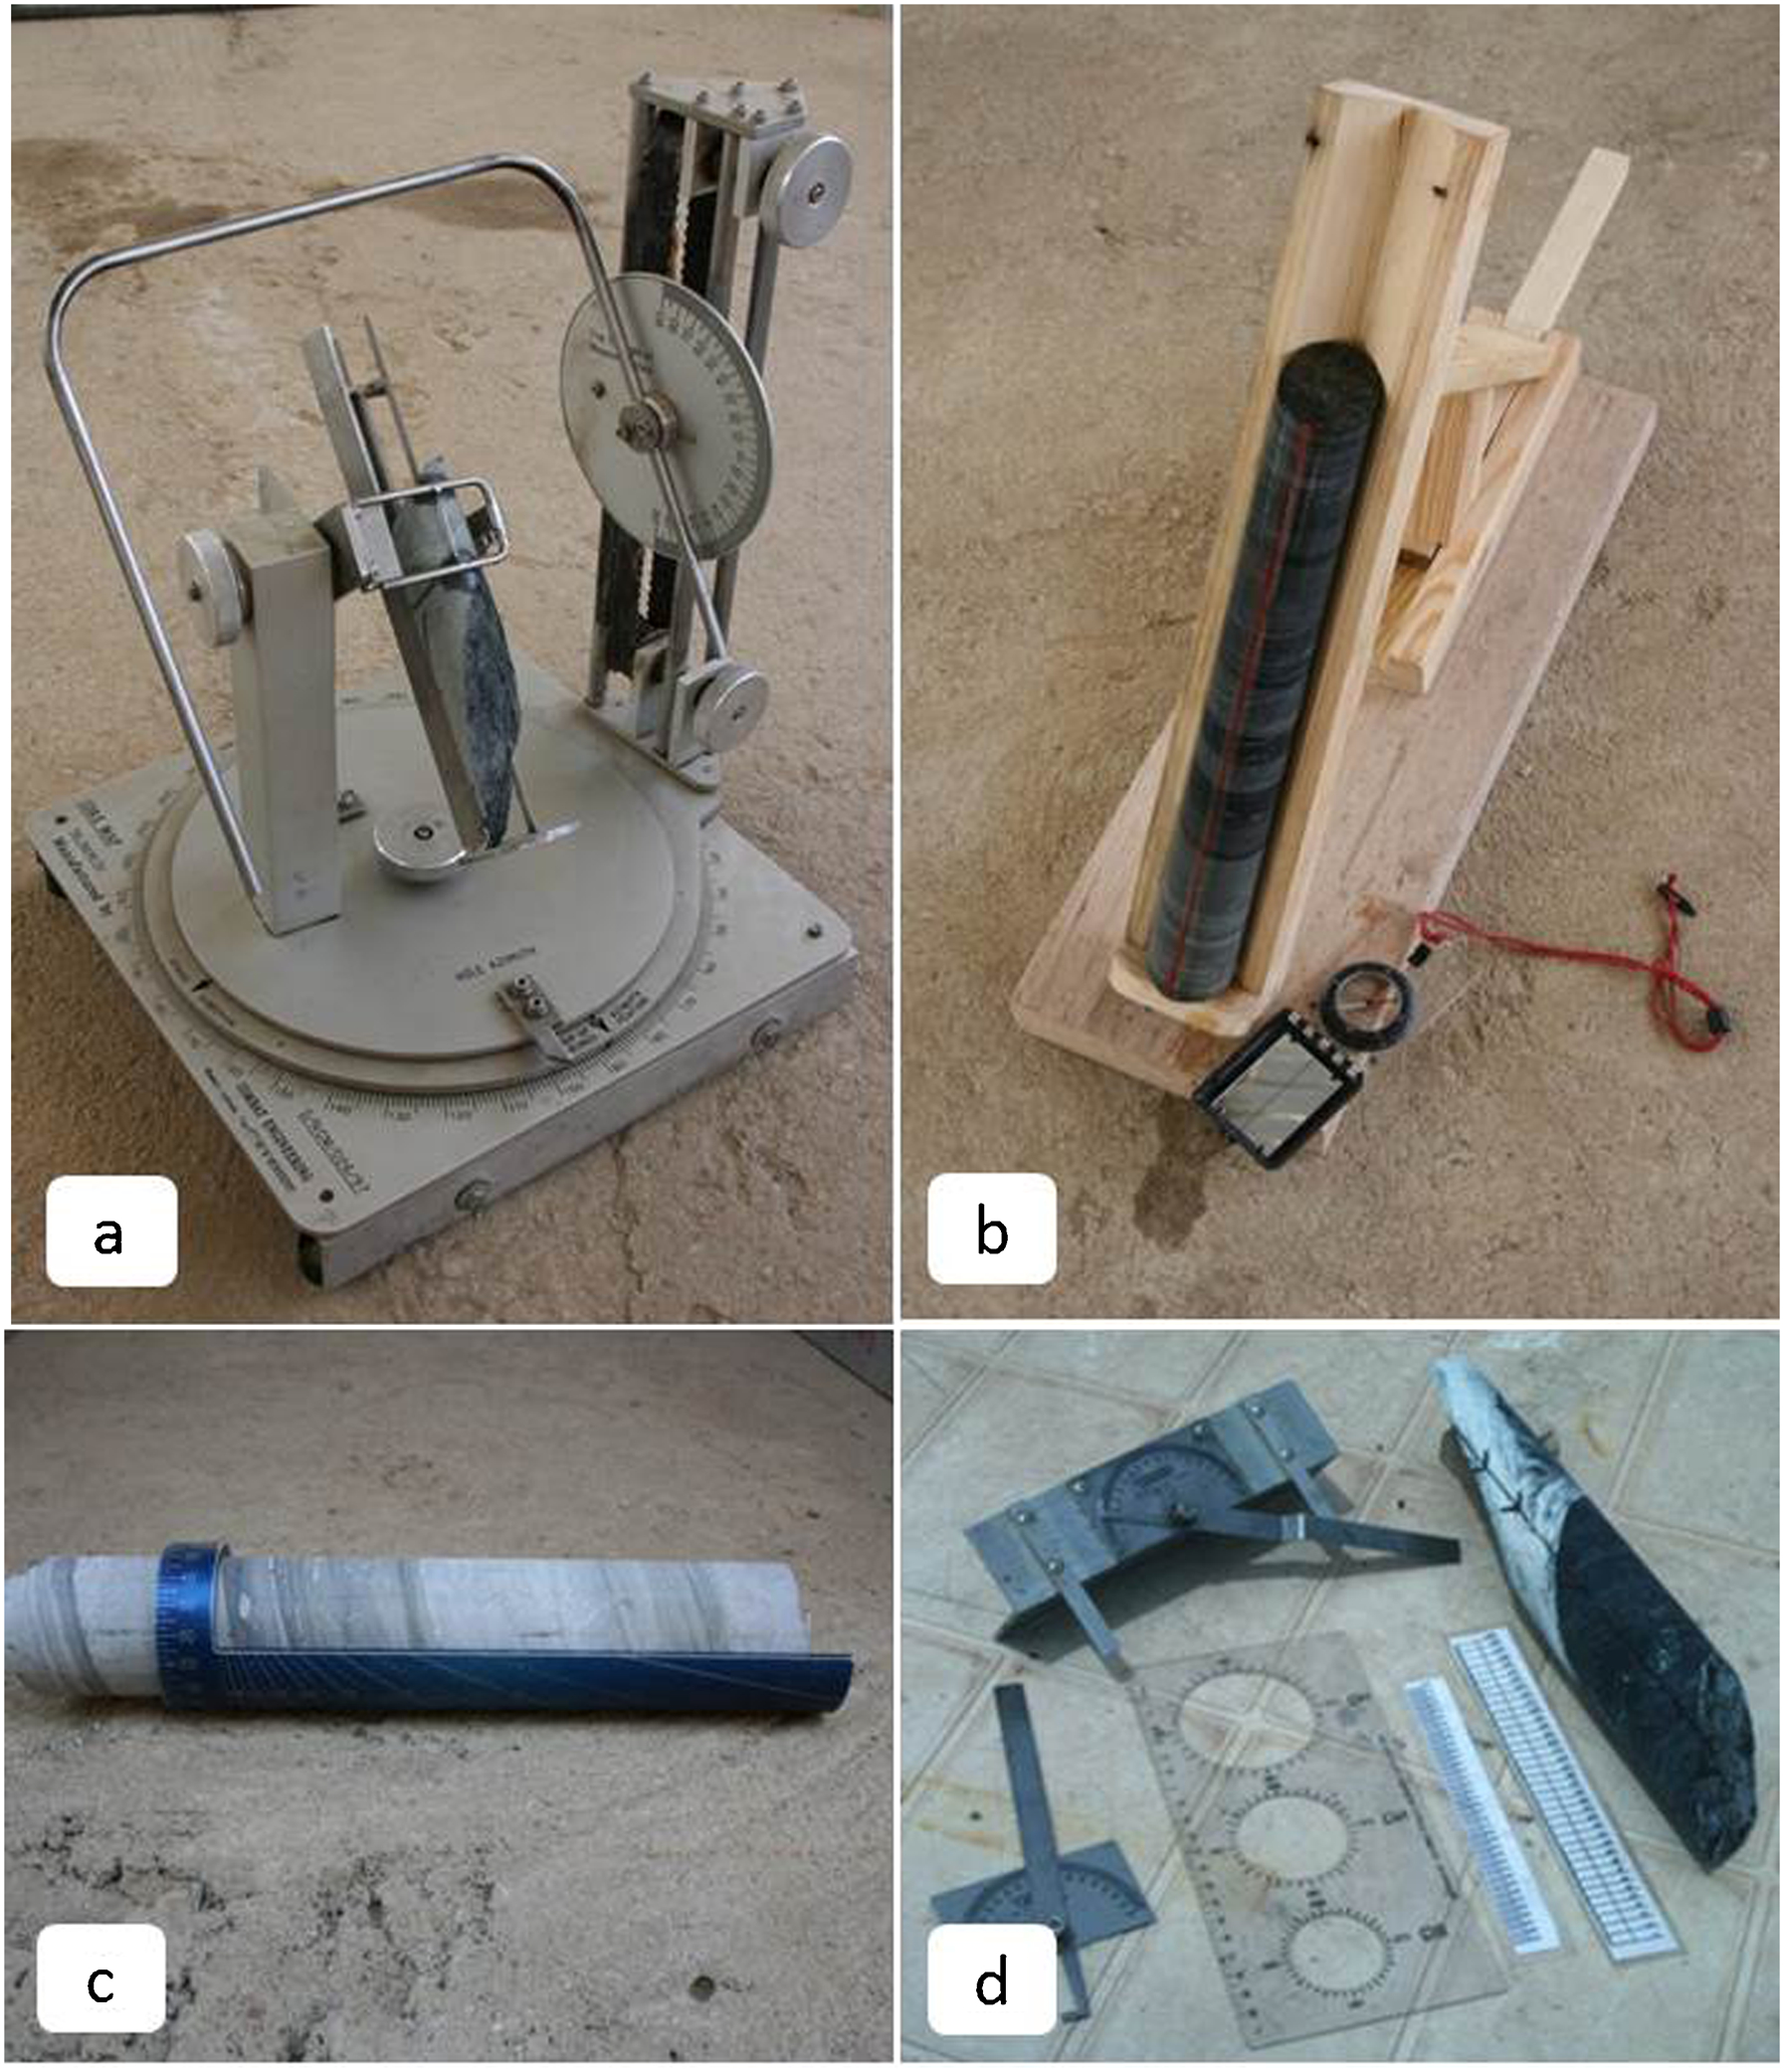
Core structure measuring devices discussed and compared in Table 3. a the CoremapTM device; b rocket launcher; c the Kenometer device; d α and β core protractors including wrap-around protractors
The rocket launcher is a wooden device that has a compass at the base. The compass is used to orient the stand to the same direction as the drill hole. The wooden stand is then set to the inclination of the hole. Core is laid into the stand and structures are measured with a compass the same as you would do with an outcrop. A limitation of this device is that it cannot be used for areas with significant magnetism (e.g. banded iron formations and ultramafic rocks) as it relies on a compass.
The CoremapTM device (manufactured by Combat Engineering Pty Ltd) works in the same way as the rocket launcher but does not require a compass for set up or measurement. The CoremapTM is setup by rotating the upper base plate to the required drill hole azimuth and tilting the core cradle to the appropriate drill hole inclination. Core is loaded into the core cradle with the top of hole aligned with the wire centre line marker on the core clamp. The core is then secured in place by closing the clamp. The clamp can be adjusted to fit different sized core and half core. To measure a structure the U-shaped frame is rotated to parallel with the strike of the structure and the frame can then also be tilted to the dip of the structure of interest. The strike can then be read off the base dial on the base of the device and the dip read off the top of the sighter bar on the upper dial.
Both methods can also measure mineral lineations by holding a metal rod along the lineation and then measuring the dip of the rod which is the plunge and the direction the rod is dipping which is the azimuth.
When using these two devices accuracy of measurements can be improved by having a flat plate with a V-shaped notch to hold at the orientation of the plane to be measured and a rod to help visualise lineations.
Alpha–beta (α–β) methods
There are two main devices available for measuring core angles in drill core; core protractors (Fig. 4d) and the Kenometer (Fig. 4c). These devices measure angle α, the angle of the core axis with the plane of the structural feature, and angle β, the angle measured between the bottom (or top) reference line and the lowest point of the ellipse made by the planar structure.
To measure α–β with a core protractor β is measured by placing the core protractor around the core with 0 degree set on the orientation line. Beta is then read off by counting clockwise round the core protractor. Alpha is then measured using a protractor. The α–β method is quick to perform but has a number of drawbacks:
the closer α gets to 90 the less accurate β becomes, as it is difficult to see where the lowest point of the ellipse is
two different pieces of equipment are needed when measuring planar features if using a core protractor and a protractor
it is difficult to accurately measure small pieces of core, half-core or core that is broken.
To measure α–β using a Kenometer core is put into the Kenometer and the bottom of the ellipse is lined up with the 0 mark on the Kenometer. The β value is then read off by counting anticlockwise to the orientation line and α can be read straight off the side of the Kenometer without the need to move the core or use another device. Using the Kenometer solves the problem of having two pieces of equipment and allows small or broken pieces of core to be measured as the pieces can be laid in the Kenometer.
Both methods have accuracy issues as α approaches 90 degrees, but the design of the Kenometer (allowing both α and β to be read off simultaneously) improves the accuracy at high α angles. With all methods of measuring α–β, a core protractor corresponding to the exact core size is required or errors will occur when reading the β measurement.
To measure lineation's using core angles delta and gamma (γ–δ) can be recorded, with δ being the angle from the orientation line to the lowest point of the lineation and γ being the dip of the lineation. Limitations on using this method are that only lineation's that go through the core axis can be measured which excludes features such as fold axis measurements. It is also important to note that to convert lineation's measured as γ–δ the α and β of the plane the lineation is measured on must also be recorded. In practice the γ–δ method is prohibitive to the collection of structurally significant lineation data.
Visualisation of structural data
With large volumes of structural data being collected in mineral exploration, it is important to discuss how software can be integrated to make the data useful. There are three main ways structural data can be used or analysed once it has been collected from drill core:
data can be used to visualise orientations at the true locations of measurements in 3D space in 3D packages such as Leapfrog® or Micromine®
data can be visualised in 2D in GIS software or Google Earth
data can be analysed as a dataset using stereonets.
Integration of data with technology
Structural data formatting
Before structural data can be incorporated with any technology it must be prepared and formatted to be compatible. Structural data are required as different formats in different software but it is advisable to convert planar data into strike and dip rather than core angle measurements at the earliest stage.
Software for α–β conversion to strike and dip
A common source of structural data within the mining industry is α–β readings. Too often they are recorded in a semi-rigid fashion (for example two joint measurements a tray) and filed away in the geological database where they are seldom used. The first hurdle to overcome before any interpretation can begin is converting them to a useful format, i.e. strike and dip.
Although α–β readings provide a quick and easy method to record structural data in drill core, they are not useful unless they can be converted to meaningful strike and dip readings. There are a number of methods to convert α–β to strike and dip, both manual and computer assisted (Table 4), but all methods require knowledge of how the data were collected. There is only one software (that these authors are aware of) that can convert linear measurements, and in this software α–β of the plane the lineation is on also needs to be recorded.
Methods of converting α–β readings to strike and dip readings
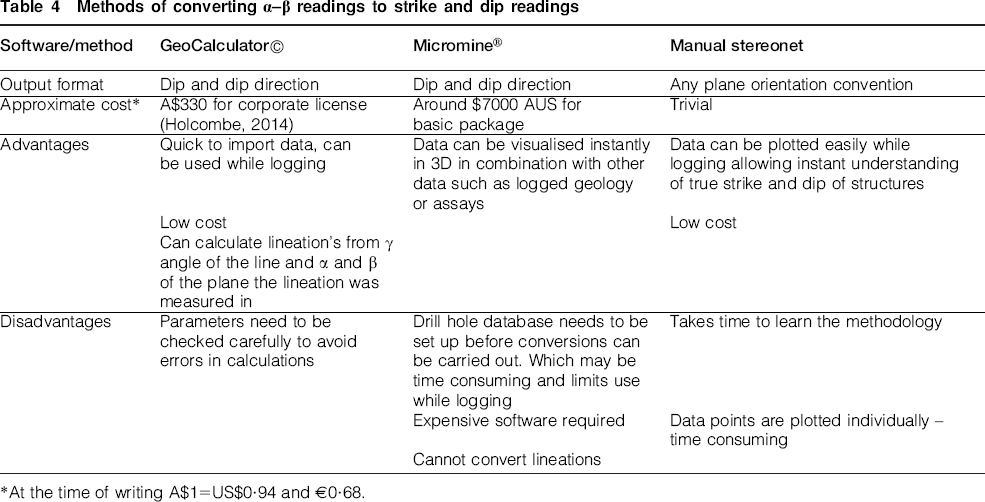
At the time of writing A$1 = US$0·94 and €0·68.
It is also important, no matter what method is used to convert α–β measurements, that the conversion is validated by taking a few quality control measurements from core using a strike and dip method, preferably using an accurate method such as a rocket launcher or CoremapTM device.
As a minimum all methods require:
position of orientation line on core (i.e. orientation line drawn on the top or bottom side of the core)
the orientation of the drill hole at the depth the measurement was taken
how the measurement was taken (i.e. taking the β reading from the top or bottom of the structure ellipse).
The following software is commonly used for α–β conversions:
GeoCalculator©
GeoCalculator© provides a low cost (one off payment of $330 for a corporate licence at time of writing) (Holcombe, 2014) method of converting α–β data. Geocalculator is also the only software (that these authors are aware of) that can convert linear δ–γ readings to azimuth and plunge.
Data are entered into GeoCalculator© in the form of a.txt file with columns for α and β or data can be pasted in from any table format (i.e. Excel). Once imported, data are converted to dip and dip direction and provided instantly as an output txt file. Although this software enables easy conversion of readings it is important to check the conventions being used in the calculation to make sure the output is correct. The input data should be reviewed in the input data tab, to ensure the correct columns are being used for α and β and that the drill hole orientation (core axis) is correct. Drill core information should also be reviewed in the conventions tab, which has the following settings:
core orientation set to plunge which means using the azimuth and dip of the drill hole
core plunge needs to be set to negative if recording dip of drill hole as a negative, i.e. −60 to 180
orientation mark needs to be set to top of core or bottom of core, depending on which side the orientation line is drawn on
α angle needs to be set as ellipse long axis
β angle needs to be set to bottom of the ellipse (this means that you are measuring from the orientation line to the bottom of the plane in core using a core protractor or from the bottom of the plane to the orientation line using a Kenometer).
As observed here it is important that whoever is converting the readings knows exactly how the readings were taken, so that the right parameters can be implemented.
Micromine®
Micromine® 3D modelling software converts α–β readings as part of the drill hole calculations section, which is available in the basic license. In order to perform the calculation a drill hole database is required to be setup, which means this is not the best software to use if readings are required during logging, as the process of setting up and validation of the database may be time consuming. The software assumes that β is measured from to the bottom of the ellipse and the only parameter that can be changed is whether the orientation line is on the top or bottom of the core. The orientation of the hole used comes from orientation data within the drill hole database.
The data output format is dip and dip direction. Options for displaying the converted α–β readings are adding dip and dip direction columns to the input structural data file resulting in a file with columns for α, β, dip and dip direction, or creating a new file with only dip and dip direction with no reference to the original α–β data.
With all of the above software it is important to know the theory behind the conversion and be able to convert a few readings manually using a stereonet to check the orientations in the output file are correct.
Manual plotting on a stereonet
Although not easy, another way of converting α–β data is to use a stereonet. The method is outlined in Fig. 5. It is necessary to understand how the software outlined above converts the data so that mistakes during the conversion process can be identified. This manual method can be used at any drill site or core yard with no need for any computer devices and allows immediate understanding of the true dip and strike of a structure. The only requirements are a stereonet template, pin and tracing paper.
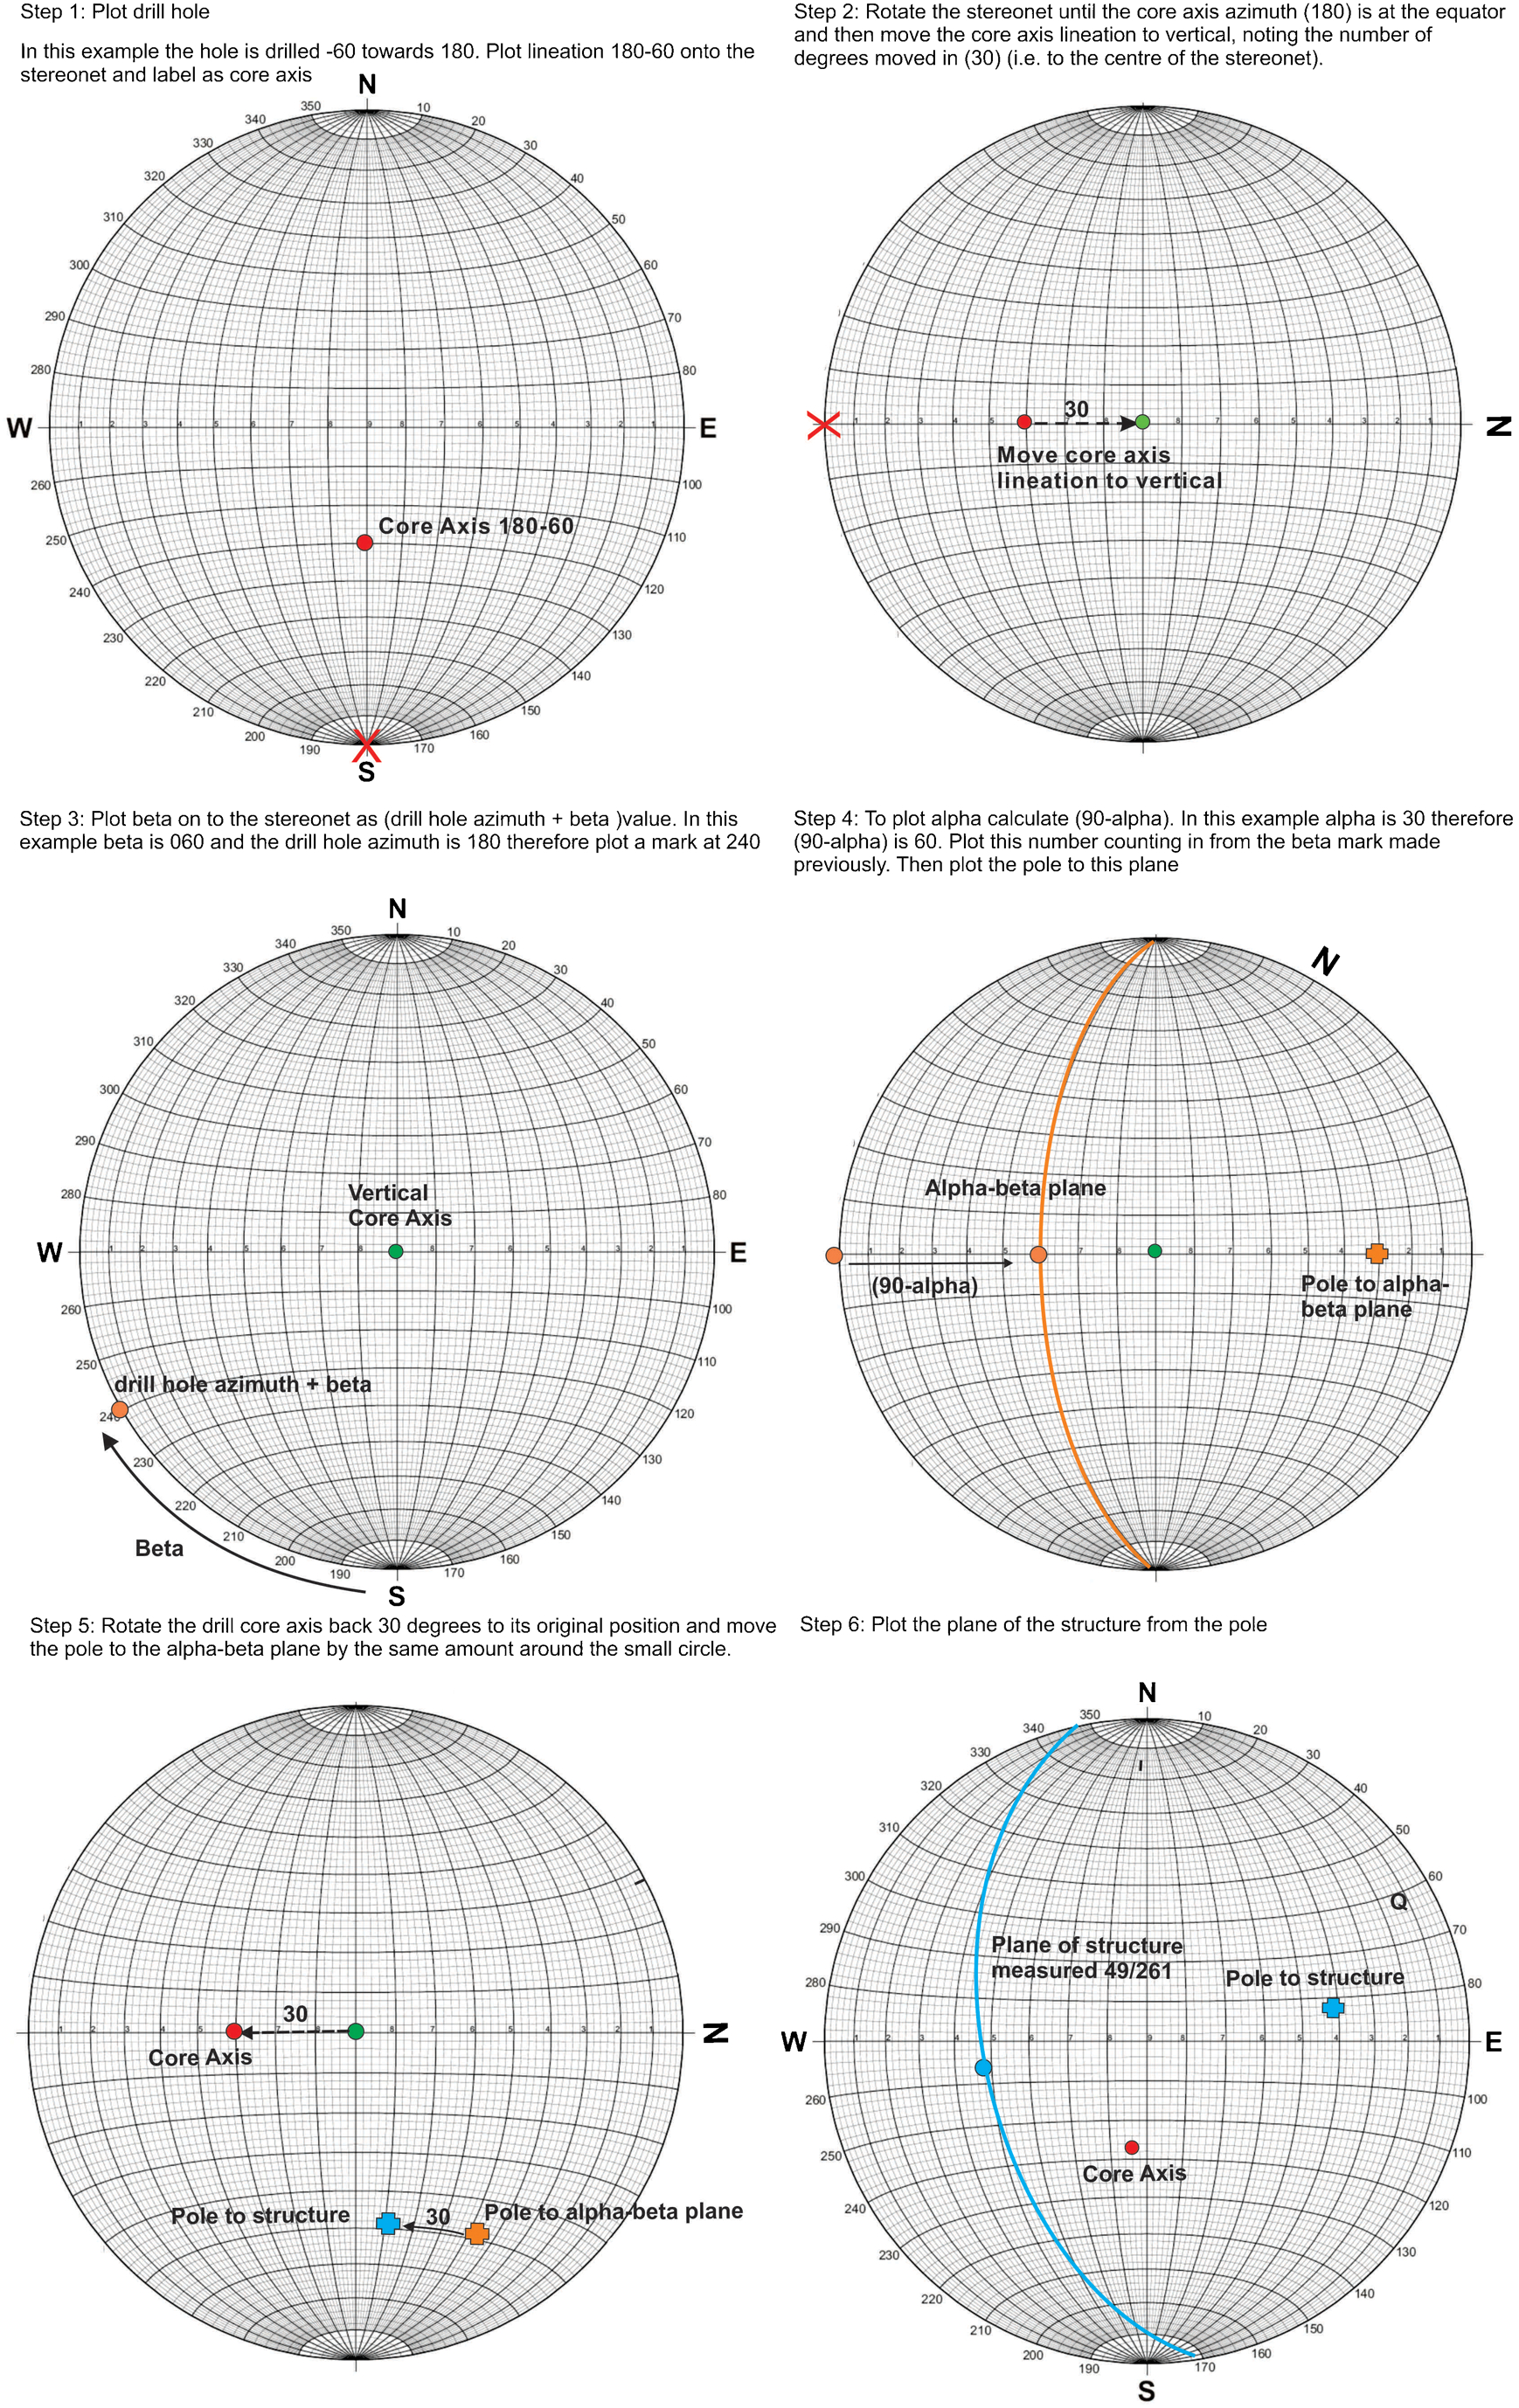
Steps used to convert α–β readings to strike and dip using a stereonet. This example uses a hole orientation of 60 to 180 and α–β readings of 30 (α) and 60 (β) with the orientation line drawn on the top of the core. (Note that if the line is drawn on the bottom of the core the same method is followed except in step 3 the β+azimuth point is moved 180 to the opposite side of the stereonet)
Stereonet software
Stereonets are a visual representation of structural data used for analysis to detect trends and patterns of structural measurements. Stereonets alone give a limited view of structure in a prospect, but combining them with sketches of key features and summary diagrams at different scales allow an interpretive picture of the relationship between structures and mineralisation to be developed (Vearncombe and Vearncombe, 1998).
There are many software packages available for plotting stereonets and most provide similar outputs, two commonly used software packages are discussed here.
GEOrient©
Data can be input in a number of formats including dip/dip direction, dip/strike/qualifier, dip/strike right hand rule (the chosen strike direction is that in which the dip direction is to your right (Holcombe, 2011) or dip/strike left hand rule (the chosen strike direction is that in which the dip direction is to your left (Holcombe, 2011). These data can be copied in from Excel or other table formats. It is important to check the conventions are correct for the data format you want to use before plotting the data, by looking in the conventions tab of the input dialogue menu. Lineations can also be added though the input dialogue.
Once data are added it can be displayed as poles or planes and poles can also be contoured to produce a contour plot.
Dips
The default format for orientation data into dips is dip and dip direction, although other formats can be used by changing the project settings. These data can be added by copying from an Excel spread sheet or other table formats.
Once data have been added it can be displayed as poles or planes Table 5
Stereonet functions useful for analysis of structural data in the mineral exploration industry
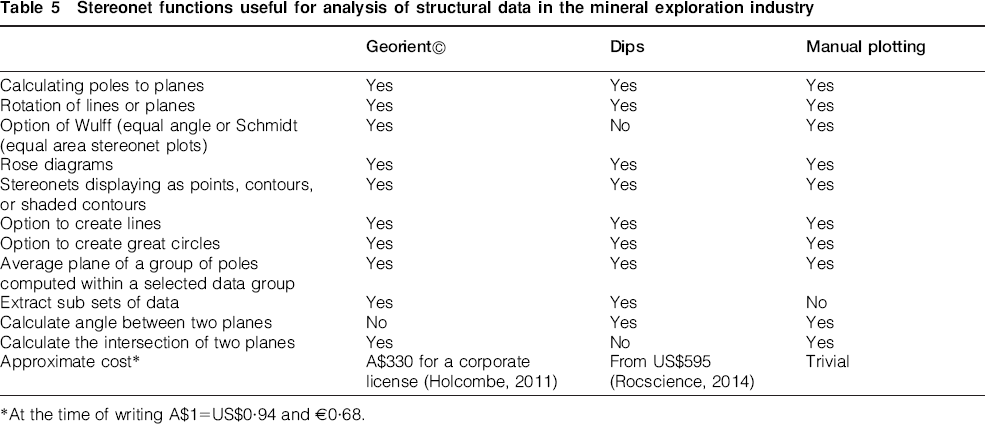
At the time of writing A$1 = US$0·94 and €0·68.
Stereonet plots can also be produced in some 3D packages such as Micromine®, although there is limited functionality, just the ability to plot poles and planes.
As with α–β conversions it is important to understand what the programs are plotting when creating stereonets. It is advisable to look at the data beforehand to get an idea of what orientations are expected, and to have an idea of how it should look on a stereonet.
Visualisation of structural data on stereonets
Once measured structural data have been edited to a computer-friendly format the data can be displayed in a number of ways, the easiest of which are stereonets (Table 5). Stereonets allow a big picture structure to be quickly displayed for an instant idea of the orientations of features in a drill hole.
The following features can be easily plotted using stereonet plotting software or a manual stereonet and the results can give an immediate understanding of features measured and provide an easy communication tool with other geologists.
Plotting bedding readings on stereonets can be used to:
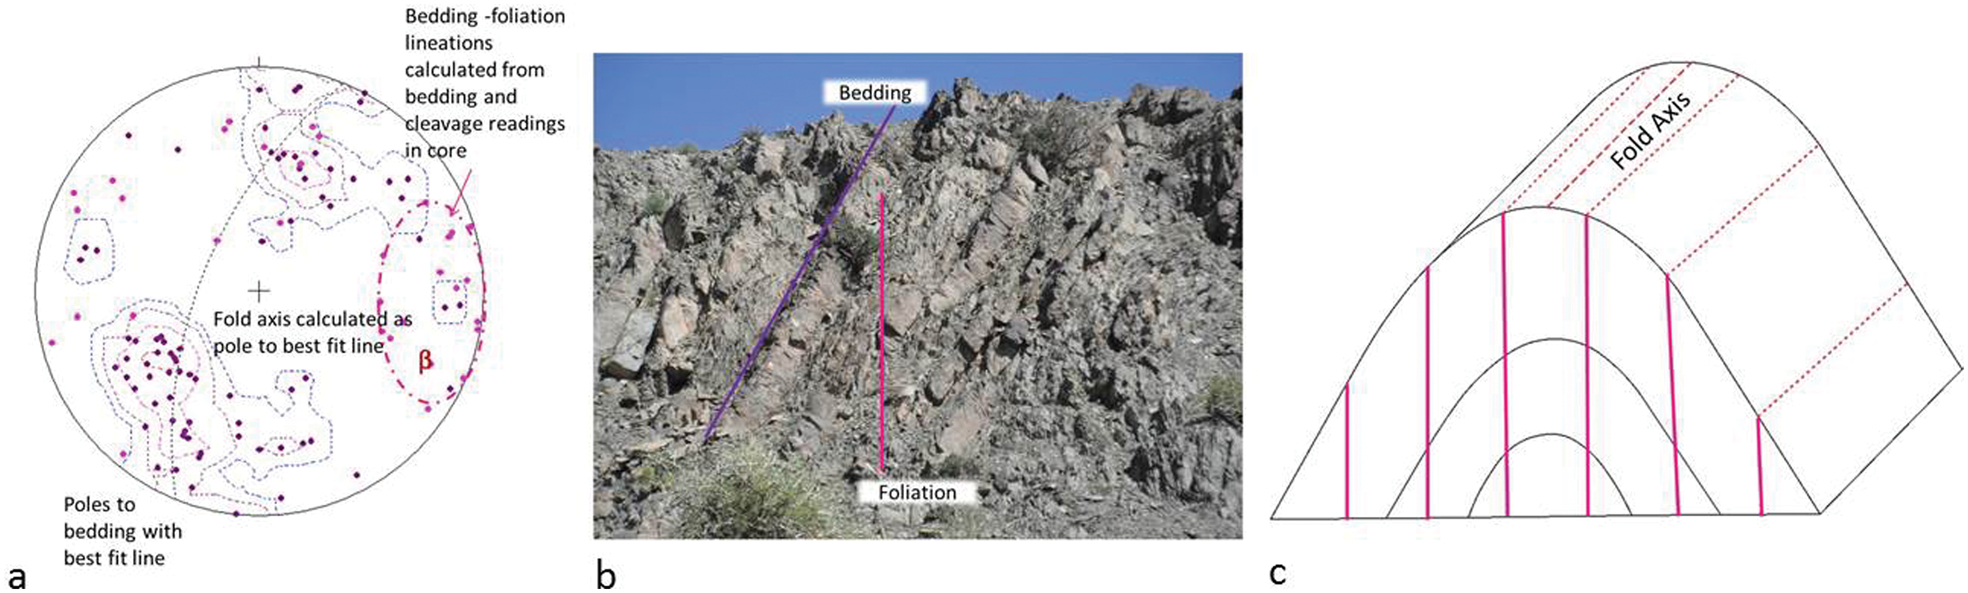
Interpret fold geometries by looking at the nature of poles to bedding clusters (Fig. 6), and then a fold axis calculated using the best-fit line through the poles.
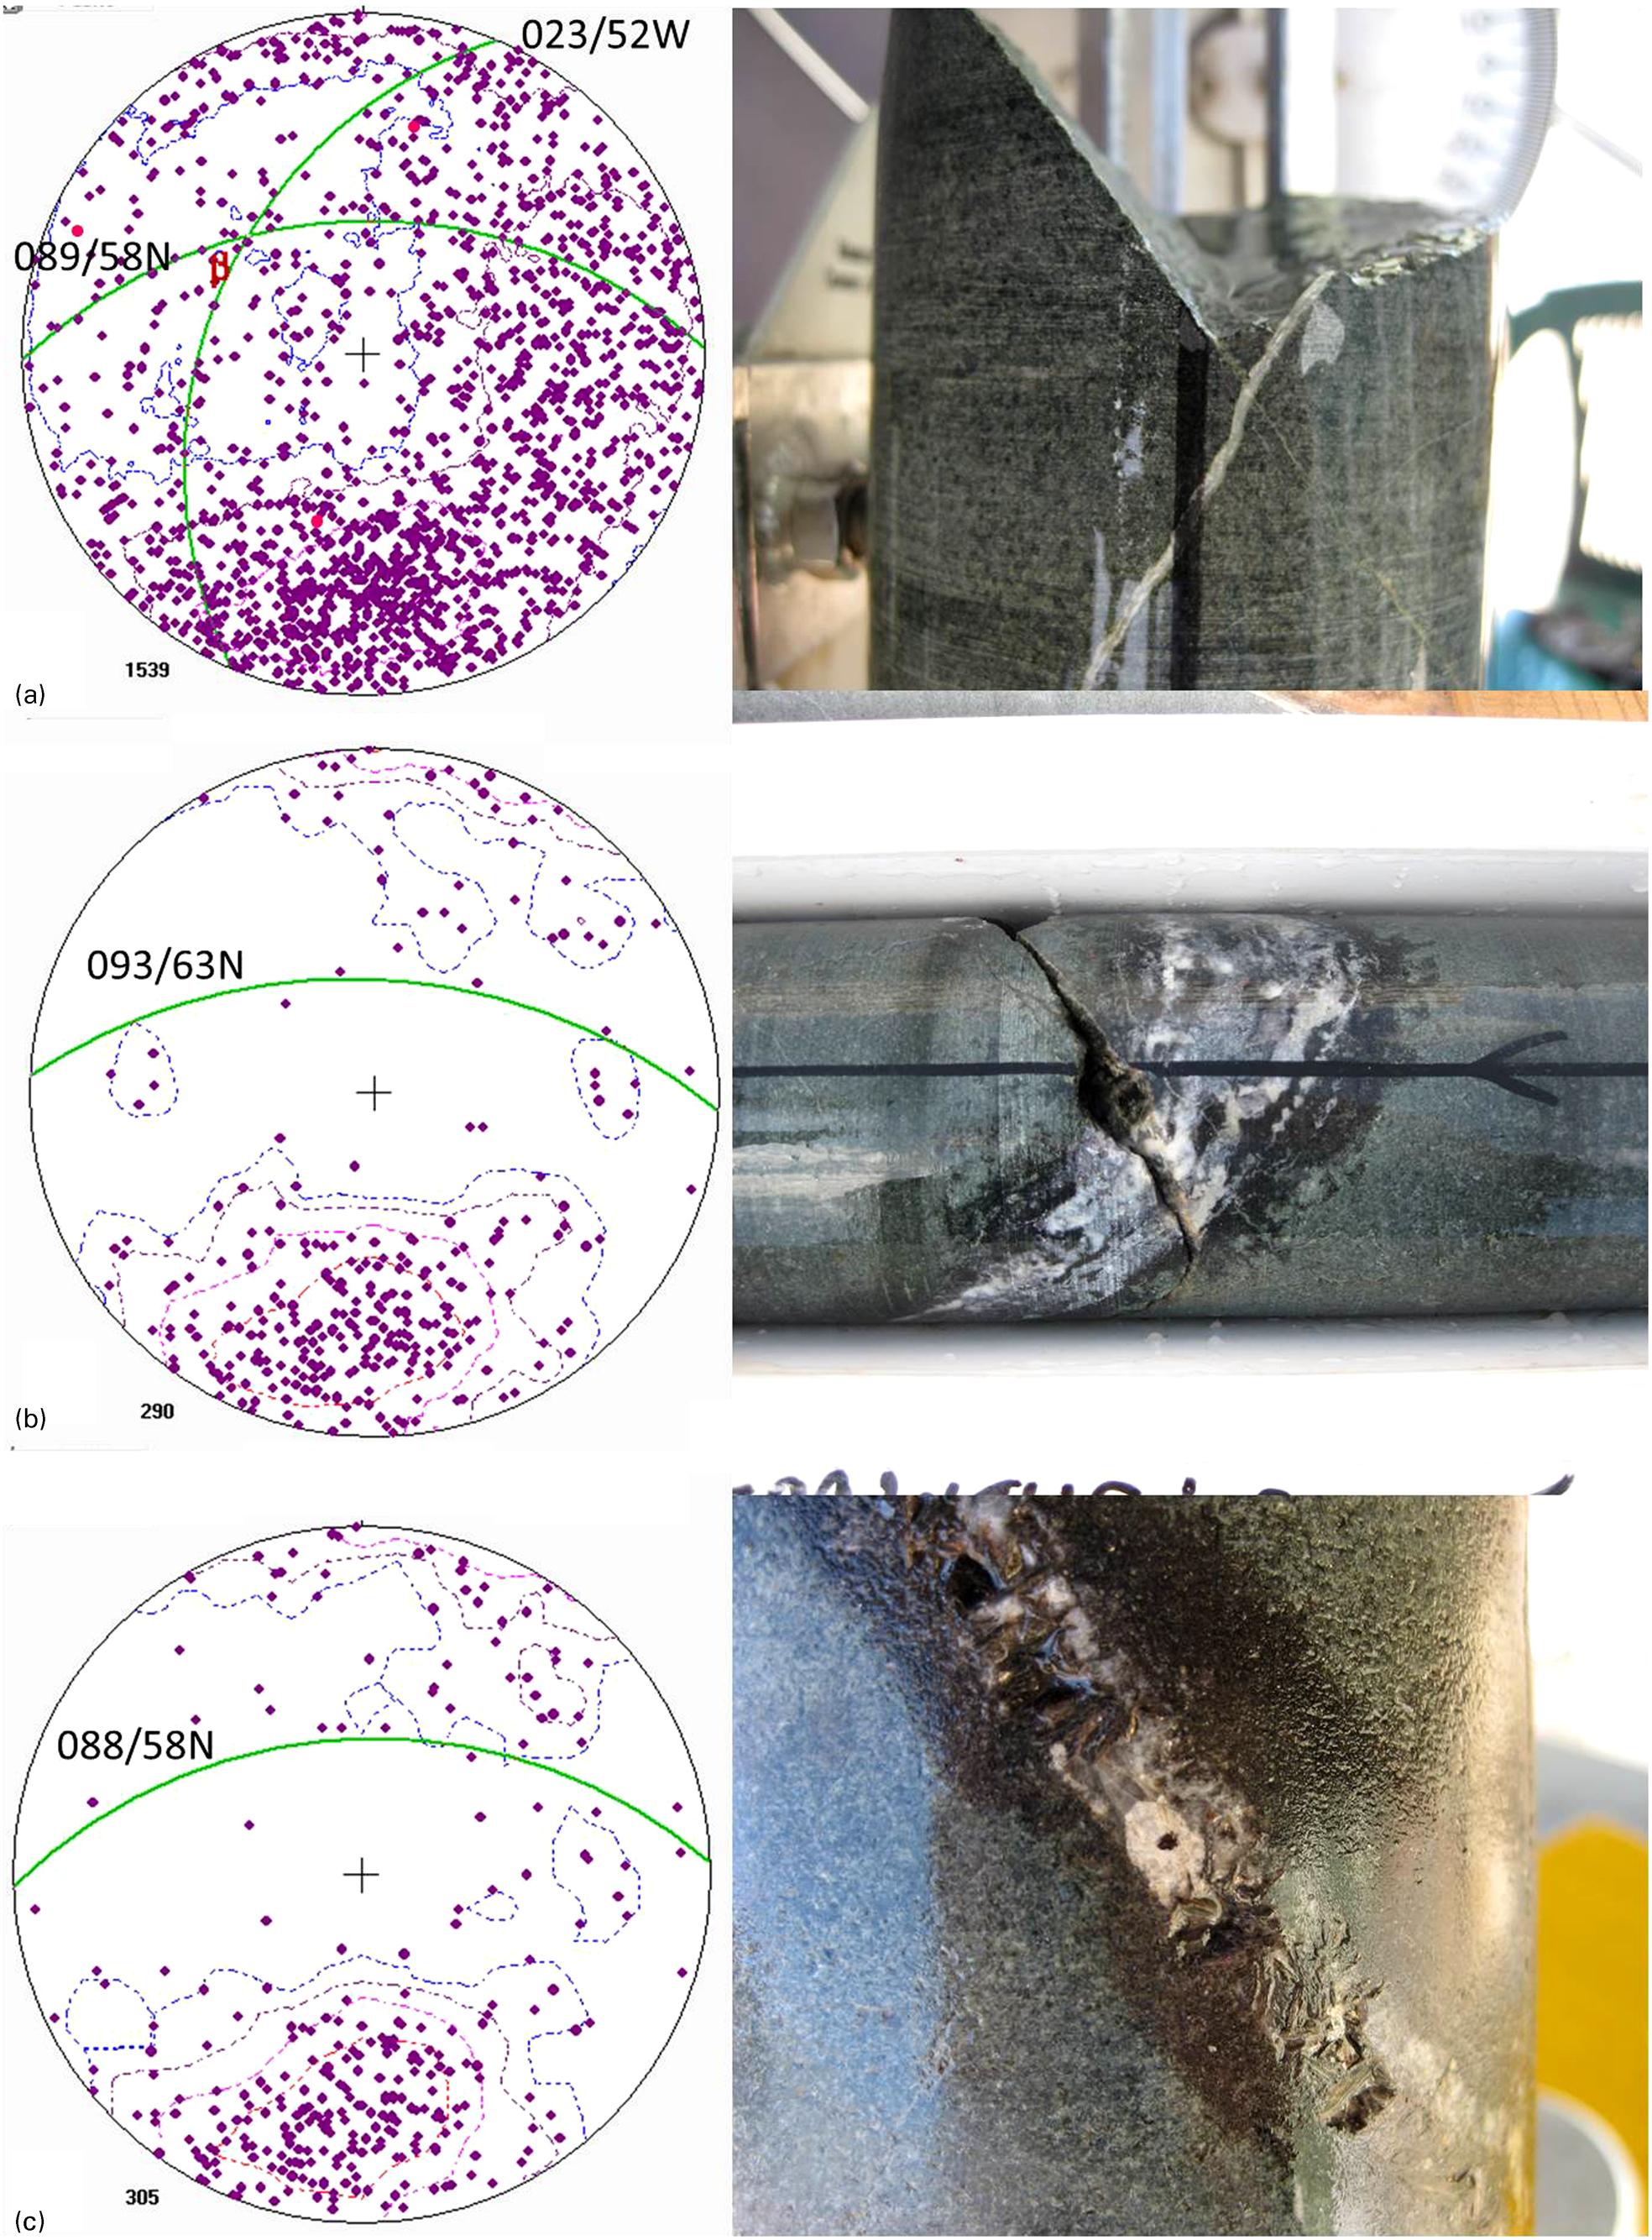
Study variations in bedding orientations over a project area by plotting an individual stereonet for each drill hole (Fig. 7).
identify relationships between veins such a conjugate pairs (Fig. 8).
estimate stress directions in conjugate pairs.
look at the relationship between mineralisation and vein orientations (Fig. 8).
calculate intersection lineations of bedding and foliation planes, which can tell you about the geometry of folding (Fig. 9).
calculate stress directions.
show possible directions of plunging ore shoots (Fig. 10).
show fold axis directions.
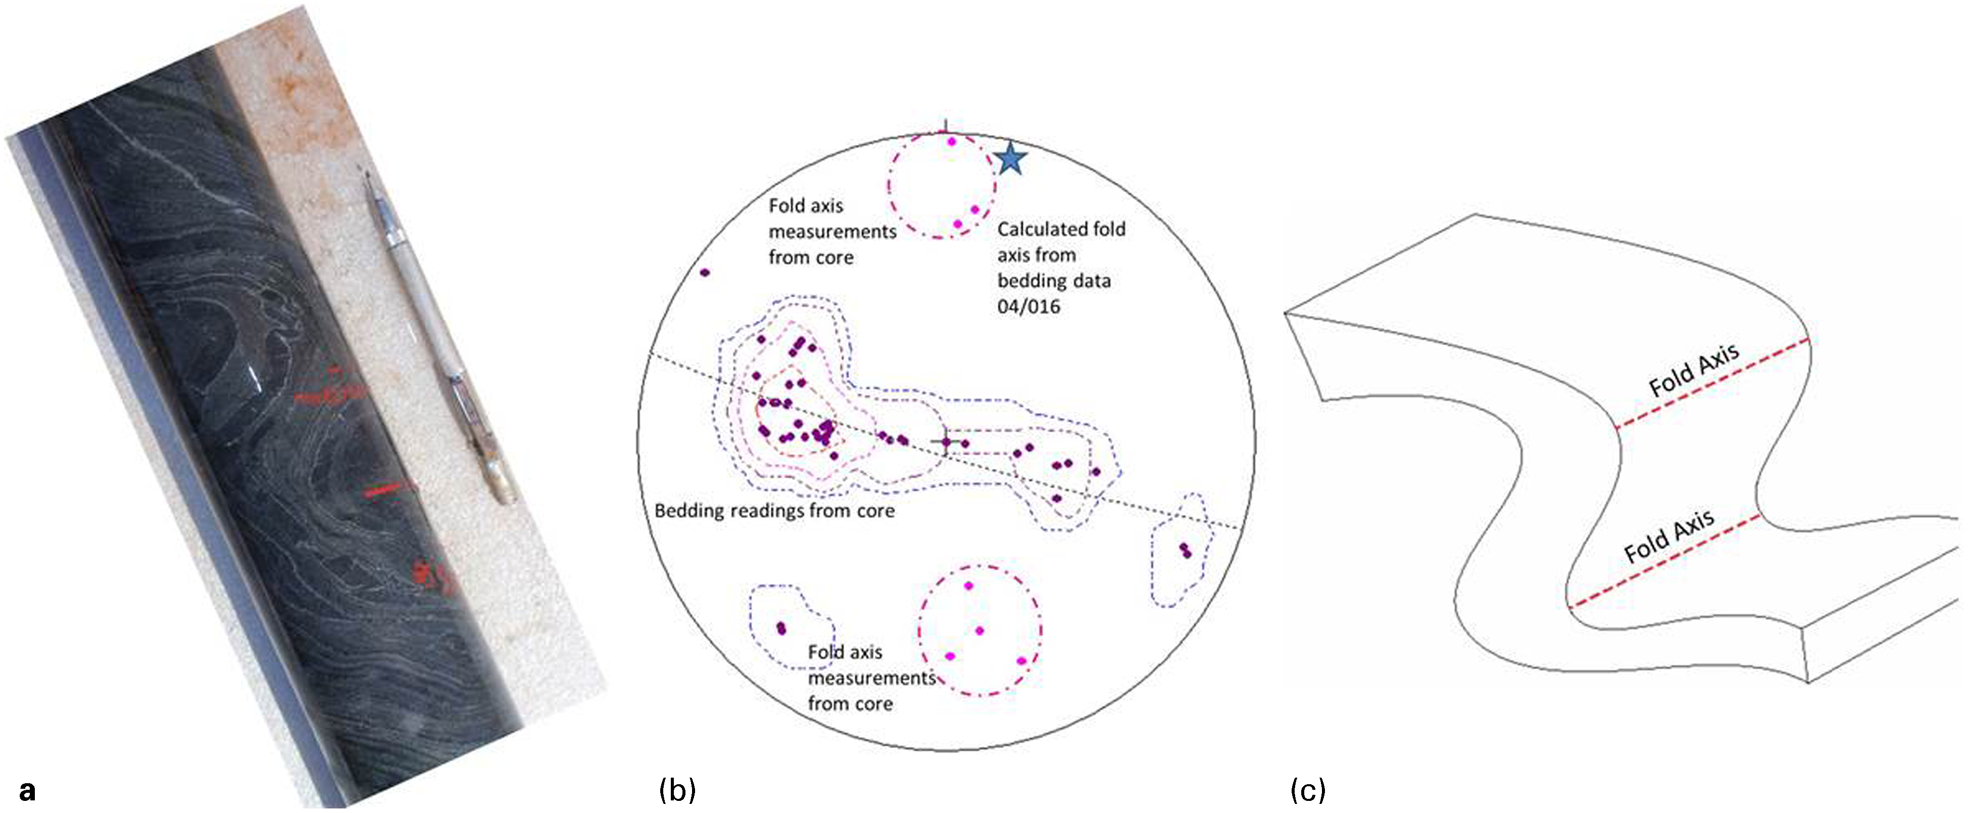
Example of how folding in drill core can be presented on a stereonet and as a 3D sketch. a small-scale folding in drill core; b stereonet of bedding and fold axis lineations measured from drill core; c schematic representation of folding observed in the drill hole
Schematic map showing individual drill hole bedding stereonets. They show a change in bedding orientation of the target horizon where there is no outcrop
Veins plotted on stereonets showing how qualitative details can be useful. The mineralised set of veins is highlighted by plotting brecciated style veins. a conjugate set of veins; b brecciated style veins; c mineralised veins
Set of images illustrating bedding-foliation intersections. a stereonet with bedding readings and bedding-foliation intersection lineations. The bedding-folation intersection lineations show the fold axis of the fold; b outcrop showing the bedding-foliation relationship; c schematic diagram showing the style of folding and bedding-foliation-fold relationship
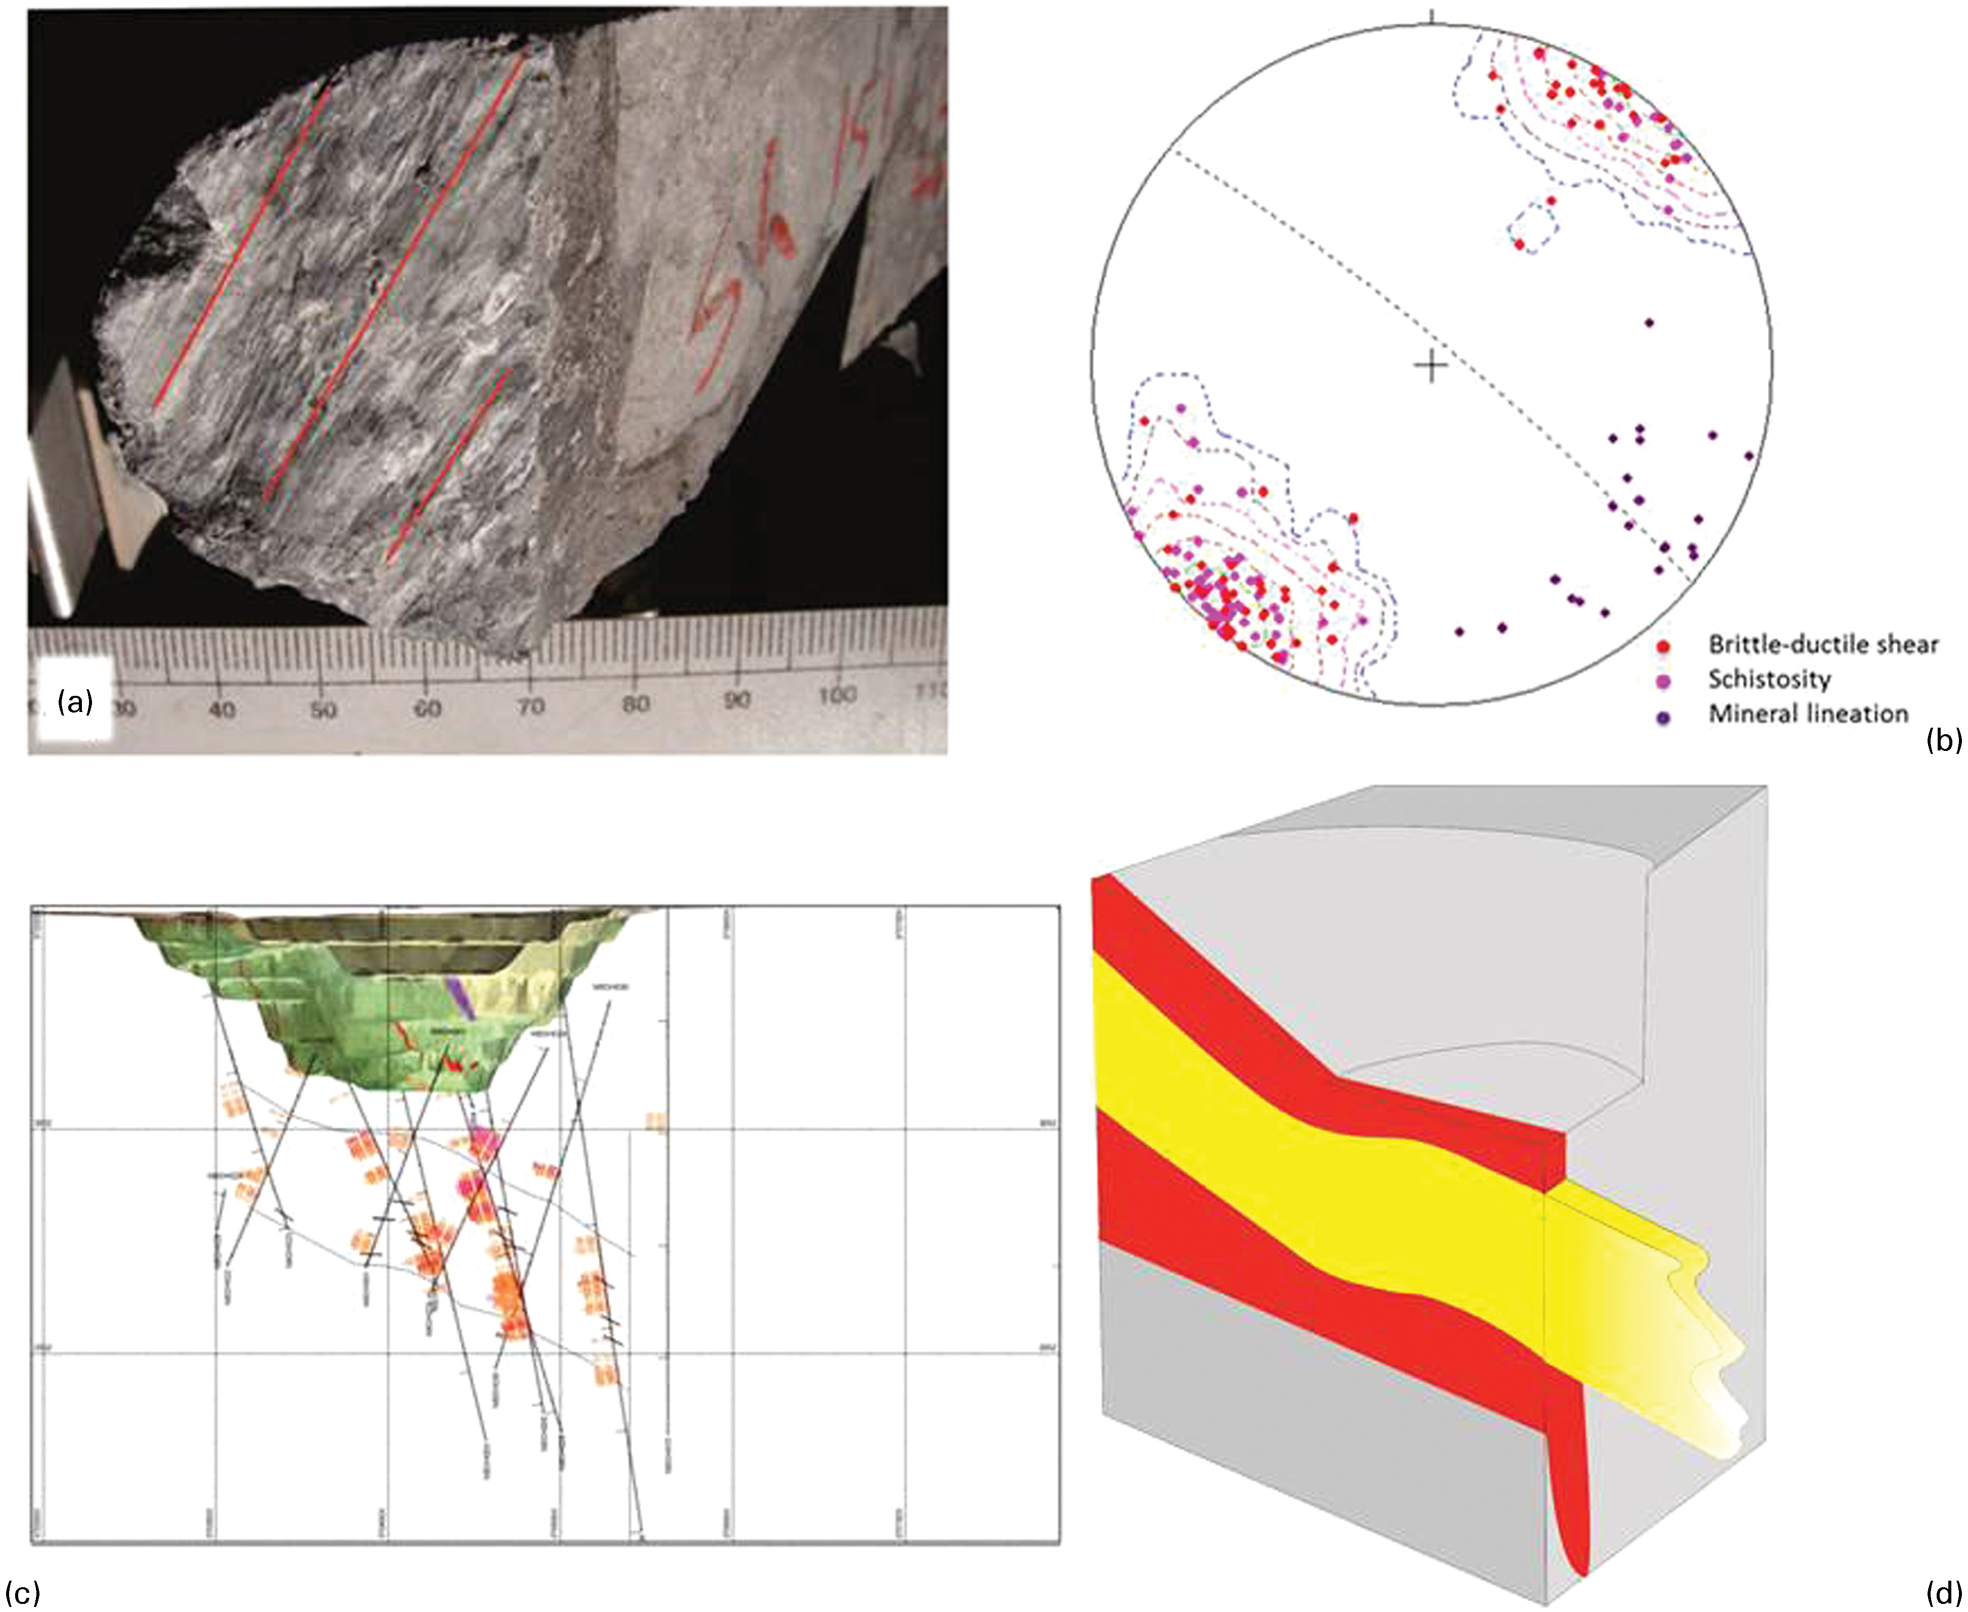
Diagrams proving the usefulness of collecting mineral lineation data. a mineral lineations on brittle ductile shear zone in drill core; b brittle ductile zone and schistosity planar measurements plotted on a stereonet with mineral lineations; c lineations plotted onto drill holes on a long section through the deposit, the lineations show the plunge of the mineralization; d 3D schematic showing mineralisation within the shear zone plunging in the direction of the mineral lineations measured in core.
Visualisation of structural data in 2D
Structural data from drill holes can be used in a 2D GIS environment by plotting representative orientations on the surface. This enables changes in orientation of key features across a prospect to be visualised. Google Earth adds to this by enabling a 3D view of the surface data with topography.
Google Earth
Google Earth is a virtual globe that uses KML (Keyhole Markup Language) files to display images, place marks, polygons and photos. Google Earth can display useful features relevant to structural geology and drilling. Transposing features into Google Earth is straightforward and intuitive, making it useful for geologists and non-geologists (shareholders and directors) alike to comprehend geological relationships. The basic, free Google Earth product is sufficient to visualise features.
Structural data can be converted from Excel workbook into a KML (Keyhole Markup Language) document via Visual Basic for Applications macro (Blenkinsop, 2012). Blenkinsop developed an intuitive and flexible downloadable macro enabled spreadsheet named S2K (Structures to KML) that creates structural symbols from structural measurements in a KML file. Symbols supplied with S2K (which includes planar and linear shapes) were created in Google Sketch Up, and there is the option to edit any of these symbols as well as create new models and colours that can be used within the dropdown menus of S2K. Other adjustable parameters include the ability to adjust model dimensions and scale (Blenkinsop, 2012).
Visualisation of structures in Google Earth has a multitude of applications and benefits, primarily relating to mapping applications (Blenkinsop, 2012). The obvious limitation with Google Earth is the incapacity to plot features sub-surface; however, in the S2K spreadsheet, by treating drill holes as lineations it is possible to plot drill holes in Google Earth by projecting drill holes upwards, above the surface.
Even given the above limitations, Google Earth is a free tool and data plotted can be used to justify drill hole design, as well as for basic 3D interpretation of structure (Fig. 11).
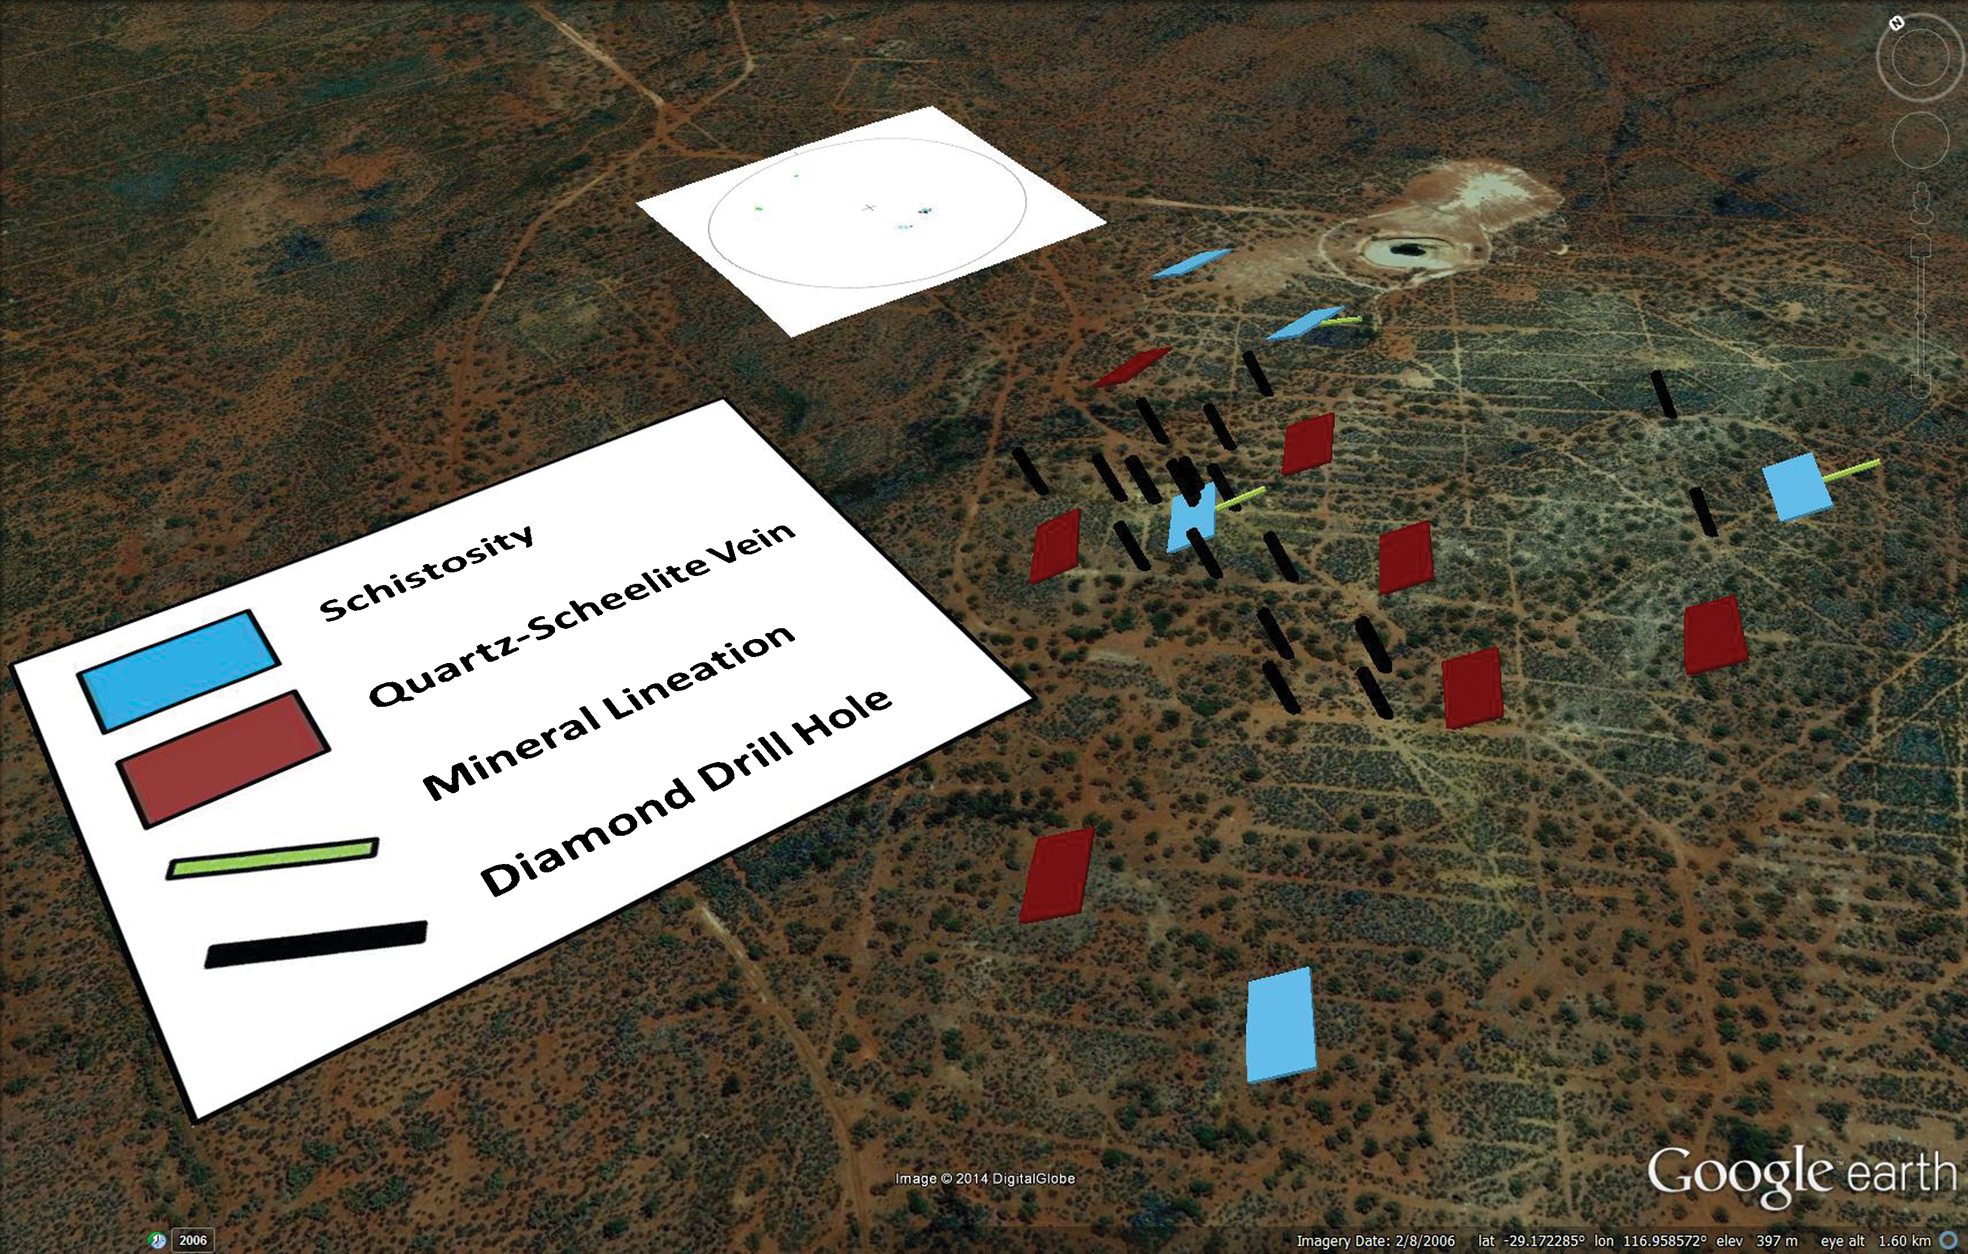
Image from Google Earth with drilling and structural readings projected above the surface
GIS software
Structural data can be displayed in any GIS program as point data. Although the visualisation of drill hole structures is limited in 2D space GIS programs can still produce useful representations of data. Examples of where drill hole structures can be useful are:
plotting variations in mineralised vein orientations across a project area. This can be displayed as representative vein orientations above each drill hole or as stereonets for different areas where the orientations are different
plotting variations in strike and/or dip of other structural data across a project area such as changes in bedding, foliation or joints.
Visualisation of structural data in 3D
Drill hole structural data can most readily be used in 3D packages to aid in the interpretation of lithological or mineralogical boundaries, whether a manual interpretation in cross-section or interpolation using software with an implicit modelling function (These authors only have experience of Leapfrog® and Micromine® and cannot comment on the functionality of other software, but if there is an option to plot structural data downhole most software's should be able to be used in the following examples).
Cross section interpretation
When carrying out a manual interpretation on cross sections in 3D software downhole bedding or geological contact orientations can be displayed. The structures are usually added in a dip and dip direction format. The structural data are displayed as the apparent dip (the inclination of the trace of a plane in a direction other than the true dip direction) depending on the orientation of the cross-section being viewed, therefore care should be taken to look at the drill holes in 3D during interpretation. The data can most readily be used to constrain the geological interpretation. During interpretation of mineralisation or geological wireframes the structural data are used to get the right orientation of geological contacts (Fig. 12). Knowing the orientation of a mineralised feature is a valuable tool when building 3D geological models as it provides confidence to join assays to assays by providing hard geological support.
Cross-section demonstrating how collected downhole structural data can be plotted and used to aid a subsequent interpretation
3D model building
Many softwares now use an interpolation method for geological interpretation. In this method of geological modelling the structural data can be used within the modelling process by altering the surface where structural data exist or adding general trend directions that are used to set up the parameters for the interpolation, i.e. setting the search directions. Plotted downhole data can be used to refine a model by adding structure data at strategic points to modify the interpretation and create a best fit model (Fig. 13).
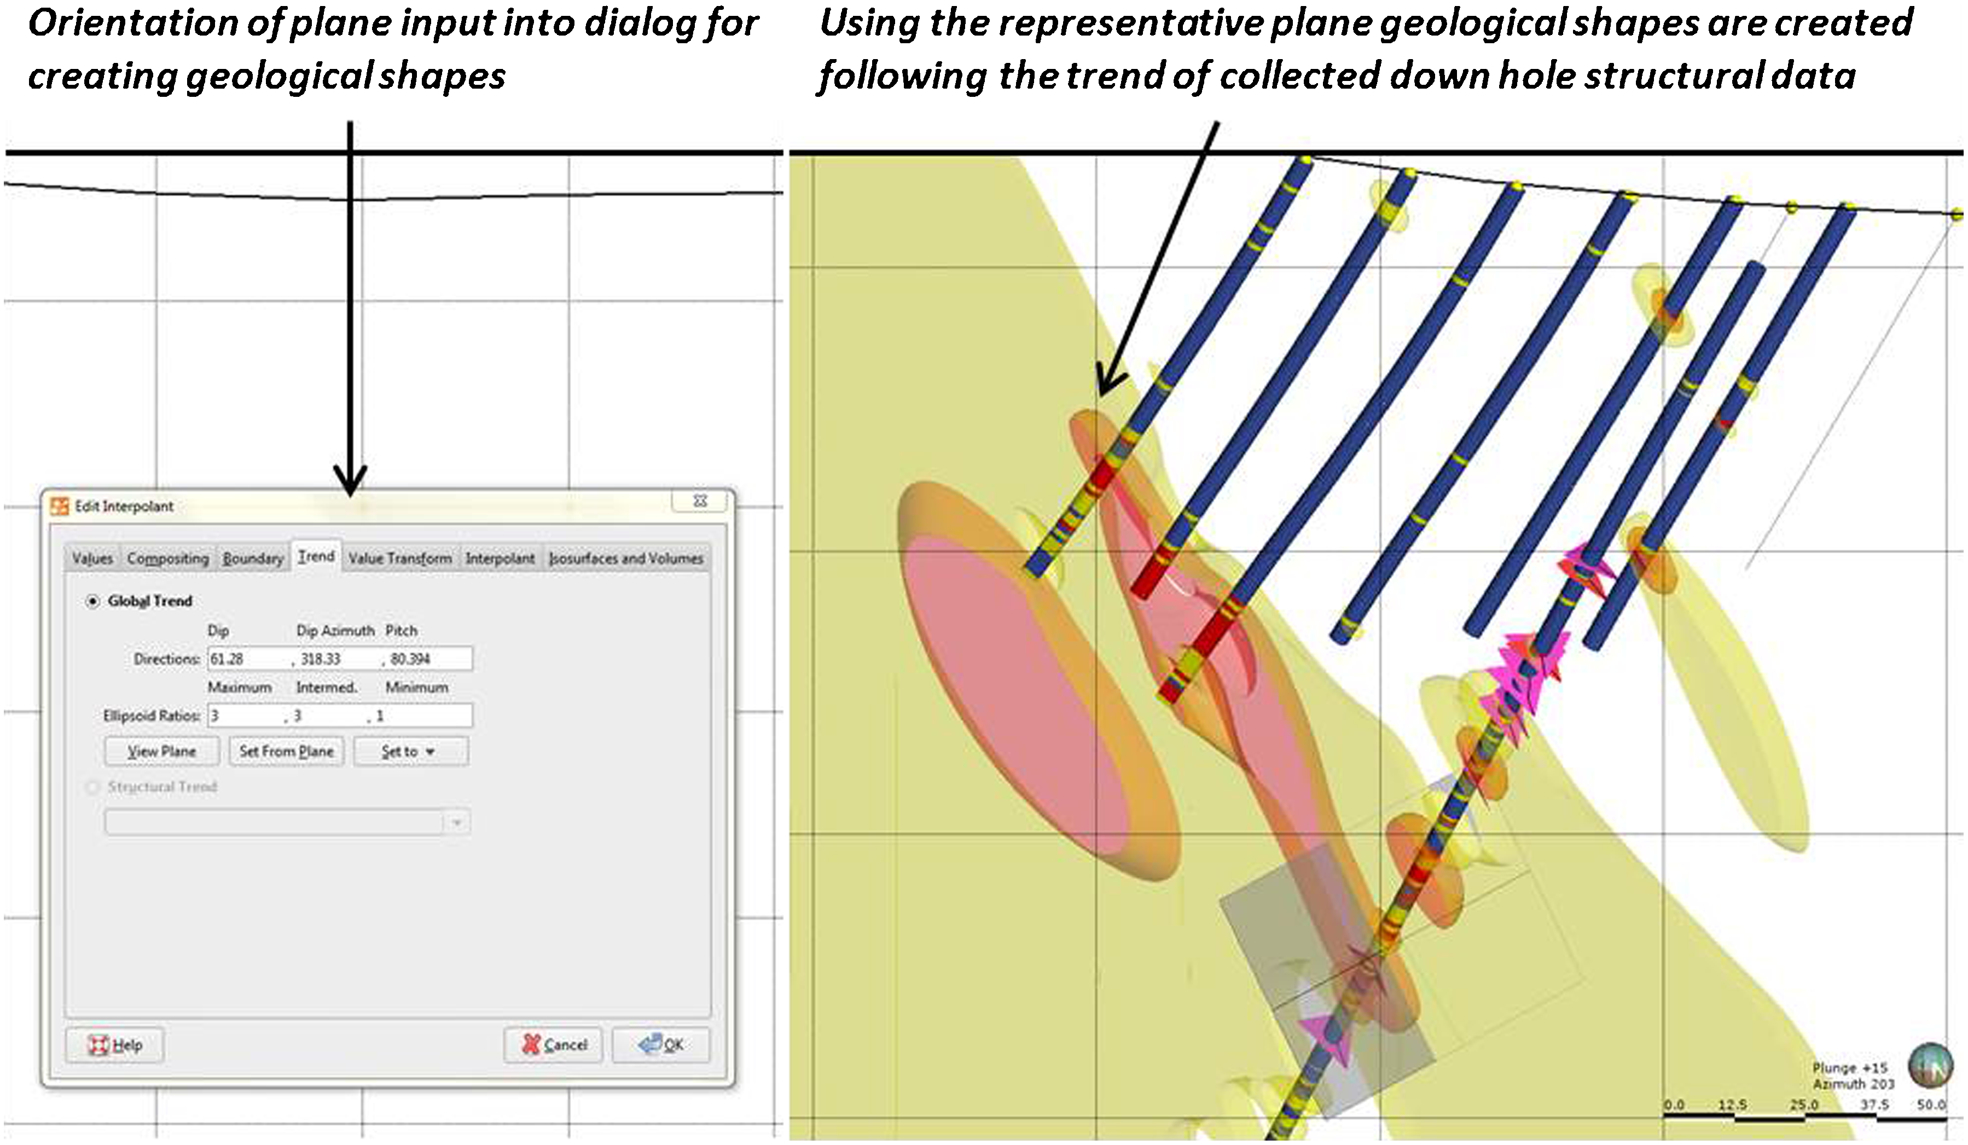
Image showing how the general trend of downhole data can be used control the trend of a geological model
Grade modelling
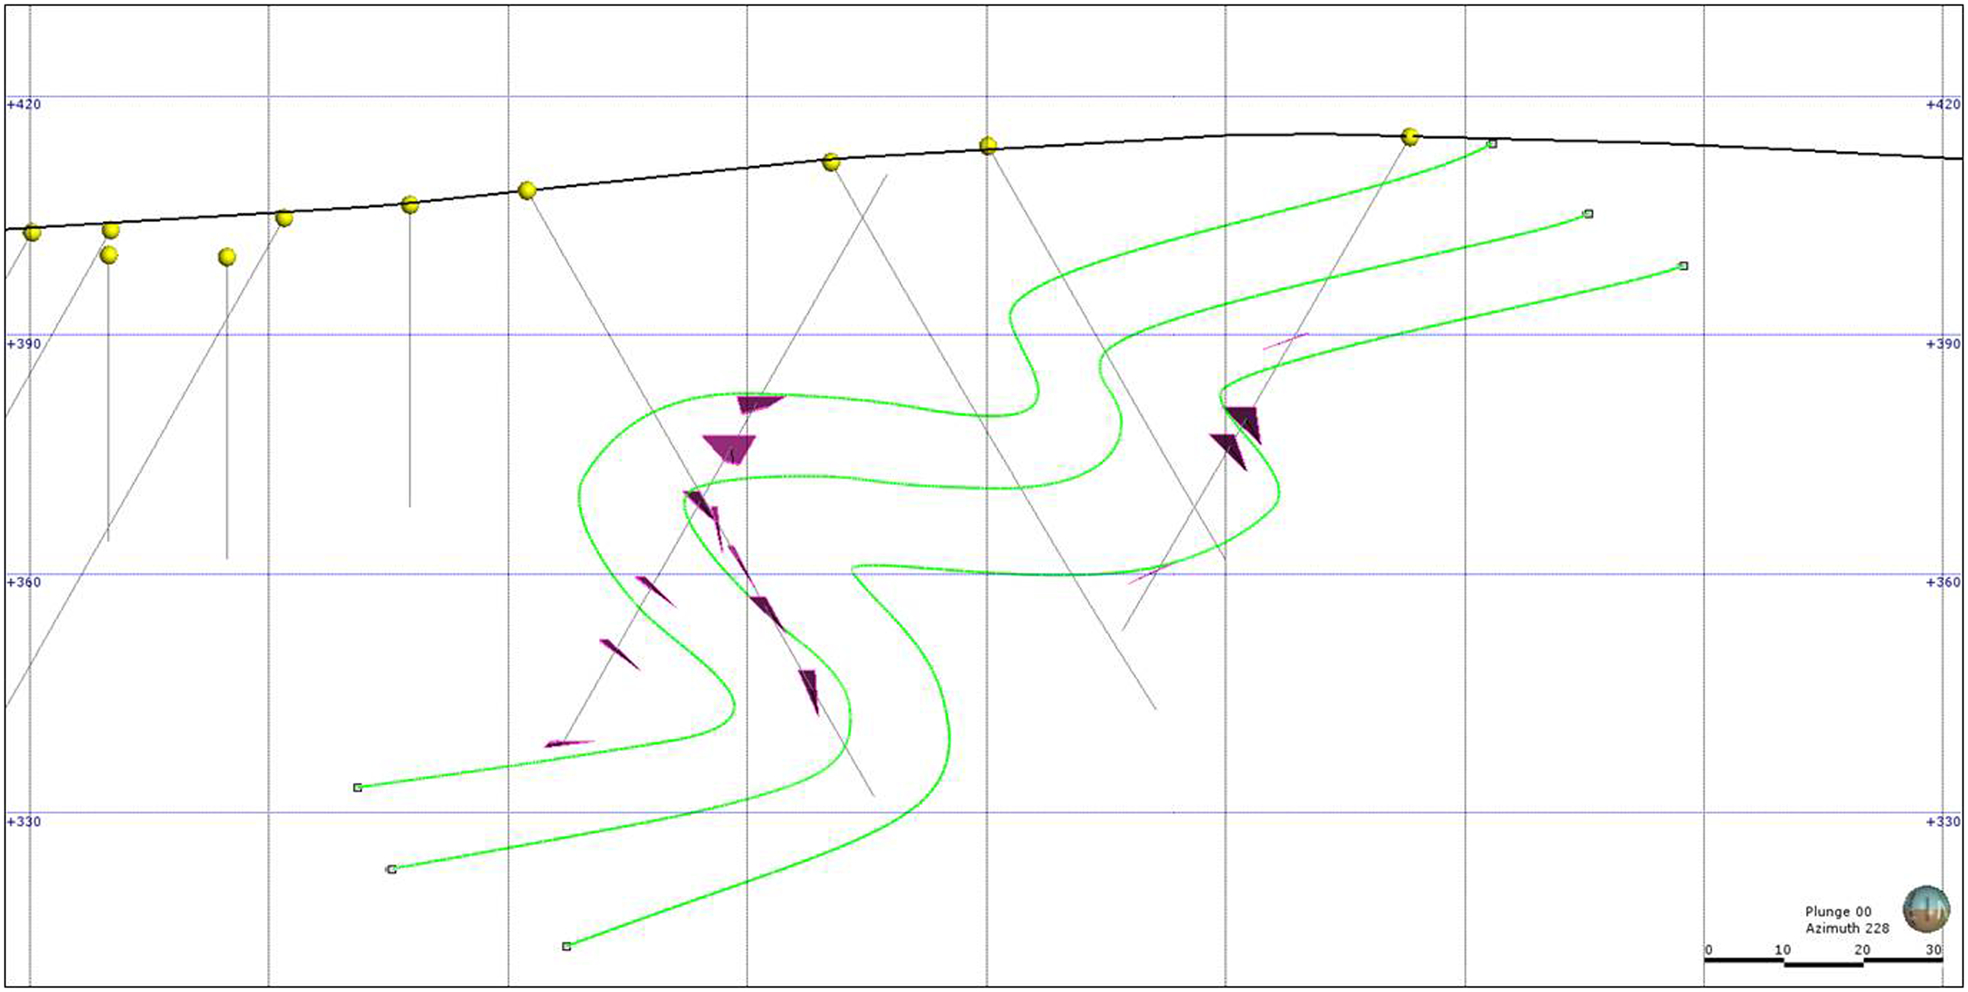
Both planar and linear measurements can be used in 3D packages to get an idea of search directions to use within assay data for grade modelling and subsequent resource estimation. Planar measurements such as geological contacts can be used in a general capacity together with variography to produce a geologically accurate resource model. Lineations can be used to identify ore shoot directions or identify the direction of high-grade lodes within a mineralised zone (Fig. 14).
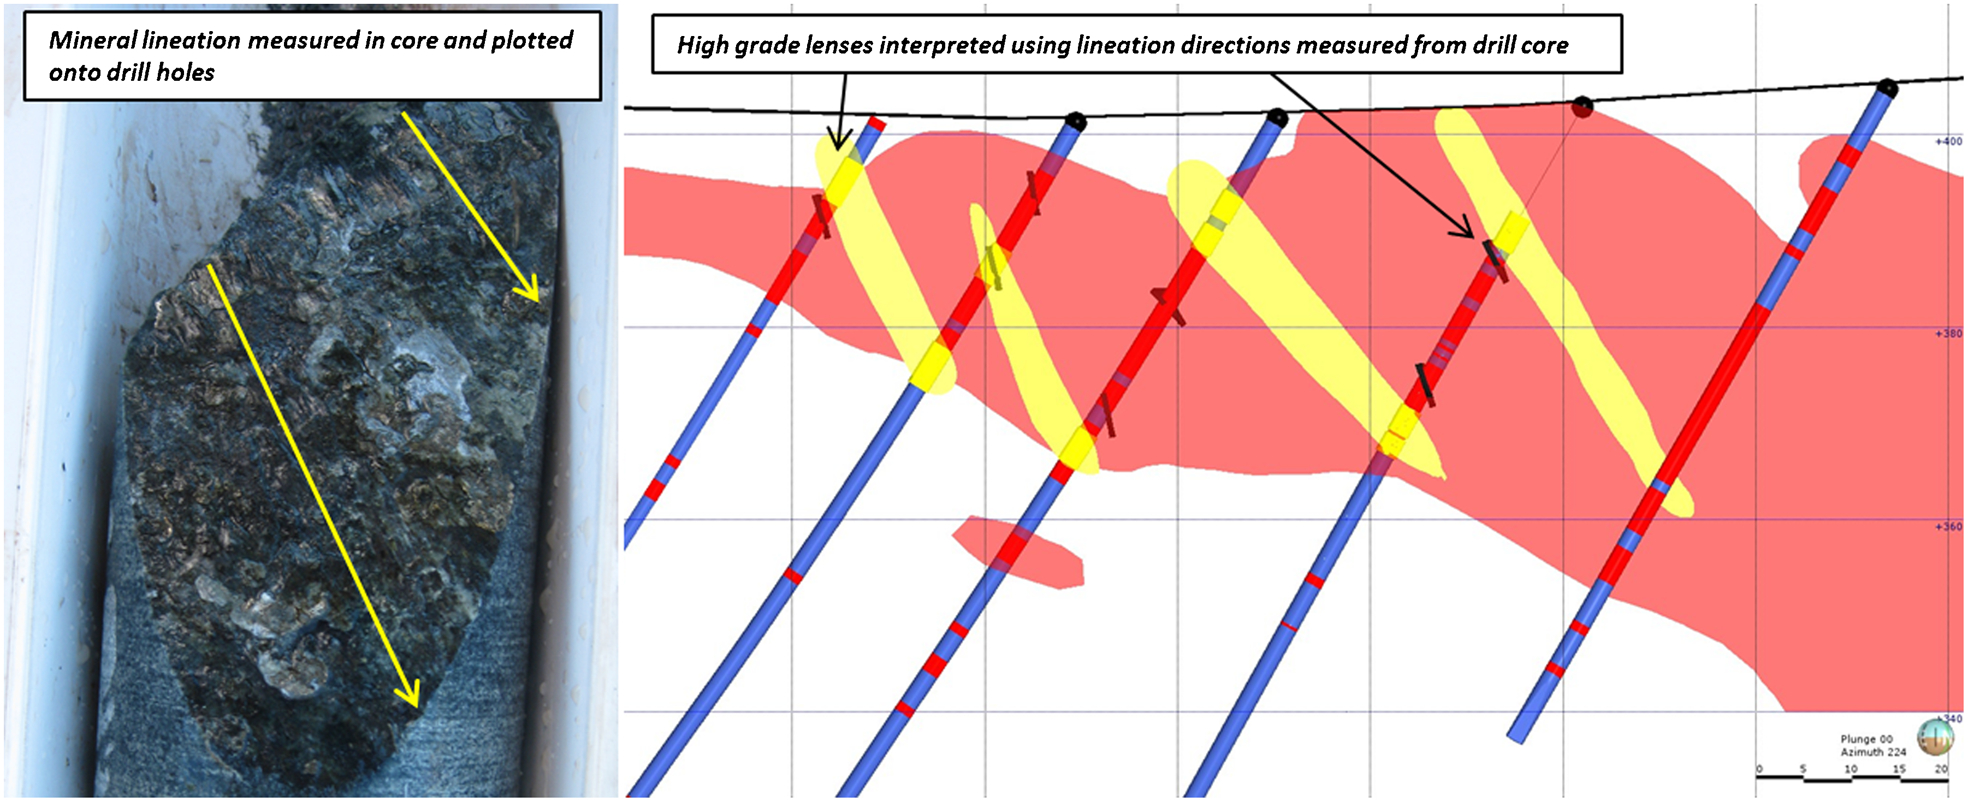
Example of how mineral lineations measured from stub ends of core can be plotted on drill hole traces and subsequently used to define a search direction for high grade lenses (yellow) within a mineralised zone (red)
Geological modelling faults and mineralisation
Qualitative data can be utilised within 3D software's to add value to the geological model. Structural observations that may be useful are comments on cross-cutting relationships of veins and/or fractures, vein fills and textures and small scale fold descriptions. For example the cross-cutting relationship between veins and fractures in core can be transferred to the larger scale and used to model the relationship between faulting and veining at a deposit scale (Fig. 15).
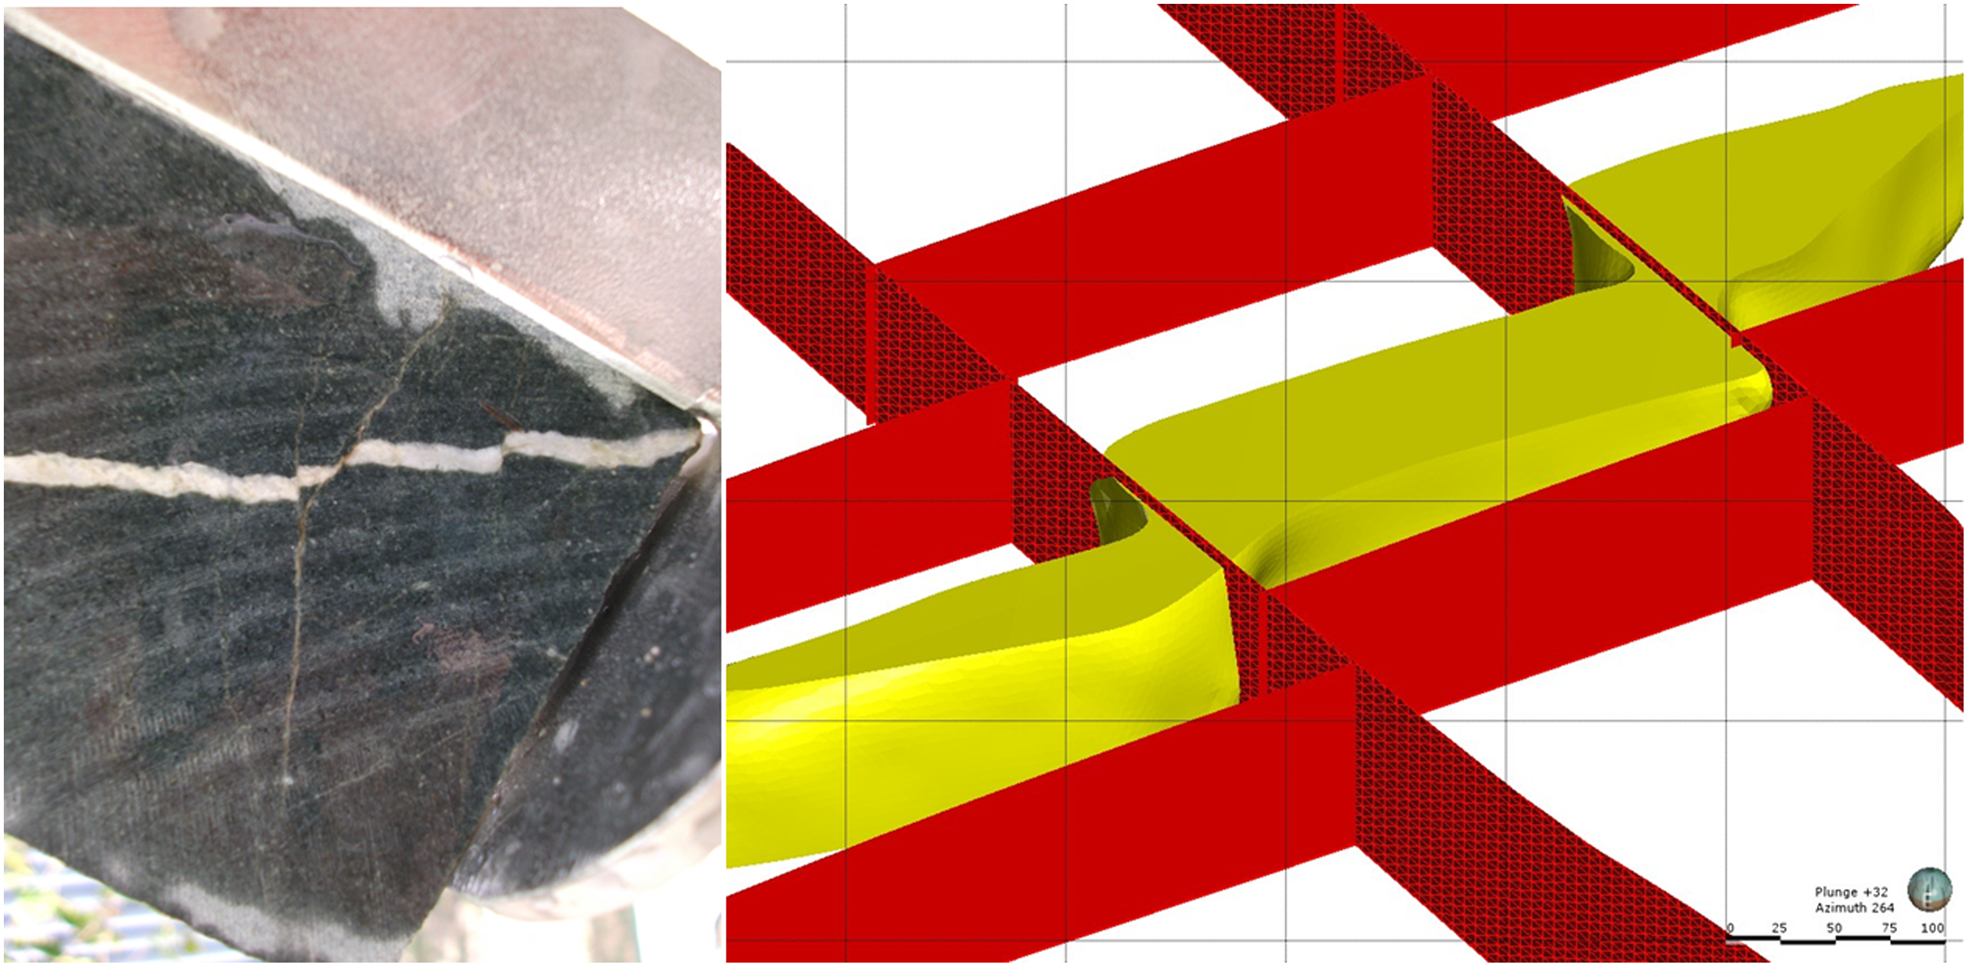
This figure highlights how qualitative observations in core can be used in the model building process. Here a cross-cutting relationship is observed between veins and faults. This relationship is used to define cross-cutting relationships between structures in the 3D model
Discussion
The primary aim of collecting structural data is to add value to a geological interpretation. In order to achieve this accurate and reliable collection and interpretation are required. This process starts at the drill rig where the most suitable downhole survey and orientation tools and procedures are used to produce accurately marked core and continues through to a conceptual 3D model(s) of a deposit.
The collection of structural data should be done intelligently, with thought as to how structural data will be collected, recorded and used to understand the geology and mineralisation.
Thought should also be given to the method of collection, i.e. devices that measure strike and dip vs devices that measure α and β, many of the devices available to industry are referred to in this paper. Although α–β measurements are a time efficient way to collect structural measurements, the relative ease and thought-detachment of collecting α–β readings means projects often accumulate vast databases of data irrelevant to the understanding of geology and mineralisation. With α–β data there is not an immediate understanding of orientations of geological features as they need to be converted to strike and dip convention in order to become functional. α–β methods also present problems when measuring linear features, i.e. there is limited software that will convert δ–γ readings to azimuth and plunge.
Lineations are often overlooked in logging of drill core even though they often have a relationship with the orientation of ore shoots. These authors recommend collecting linear data especially mineral lineation orientations as they frequently become useful in subsequent geological interpretation.
Transferring structural data from core to paper (or computer) should be intuitive, from deciding where in a drill hole structural data is most relevant and conveying this through number of readings, to creating a code sheet specific to a project. Structural data should be plotted as soon as possible after collection to identify any source of errors in the preparation and collection process, and plotted by the geologist who collected the data.
There are many ways to plot structural data and this paper has provided examples of displaying data as patterns in a dataset and in 2D and 3D space. Visualisation of datasets on stereonets provides a powerful means to interpret and present structural geology. Numerous structural features can be picked in stereonets that may not be obvious by just looking at the raw data, for example fold geometry and fold axis directions can be interpreted and then presented using a stereonet of bedding data. Visualisation of structural data in 2D and 3D is useful for both interpretation and presentation of data. As described in this paper plotting of data in a 3D environment can aid in the interpretation of geology and mineralisation to create geological models. Plotting data in 3D can also be used to visually represent the relationship between data interpretations from stereonets or surface mapping and downhole structural observations and geology.
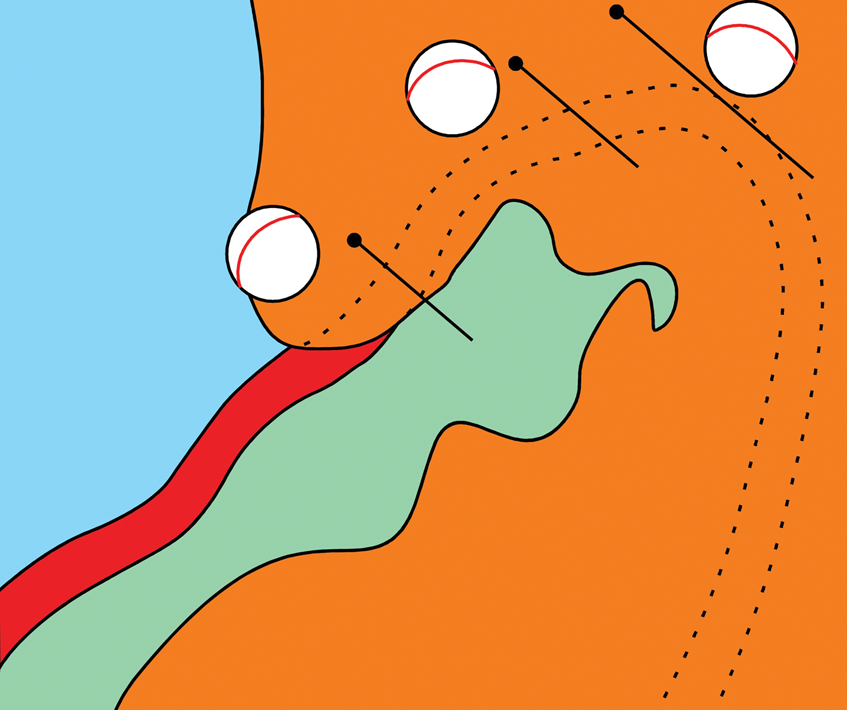
Once structural data have been collected and plotted, the right presentation style can produce a useful product applicable to a wide audience. Figure 16 shows how structural data can be presented to add value to a geological interpretation and produce materials to explain deposit geology to a wide audience.
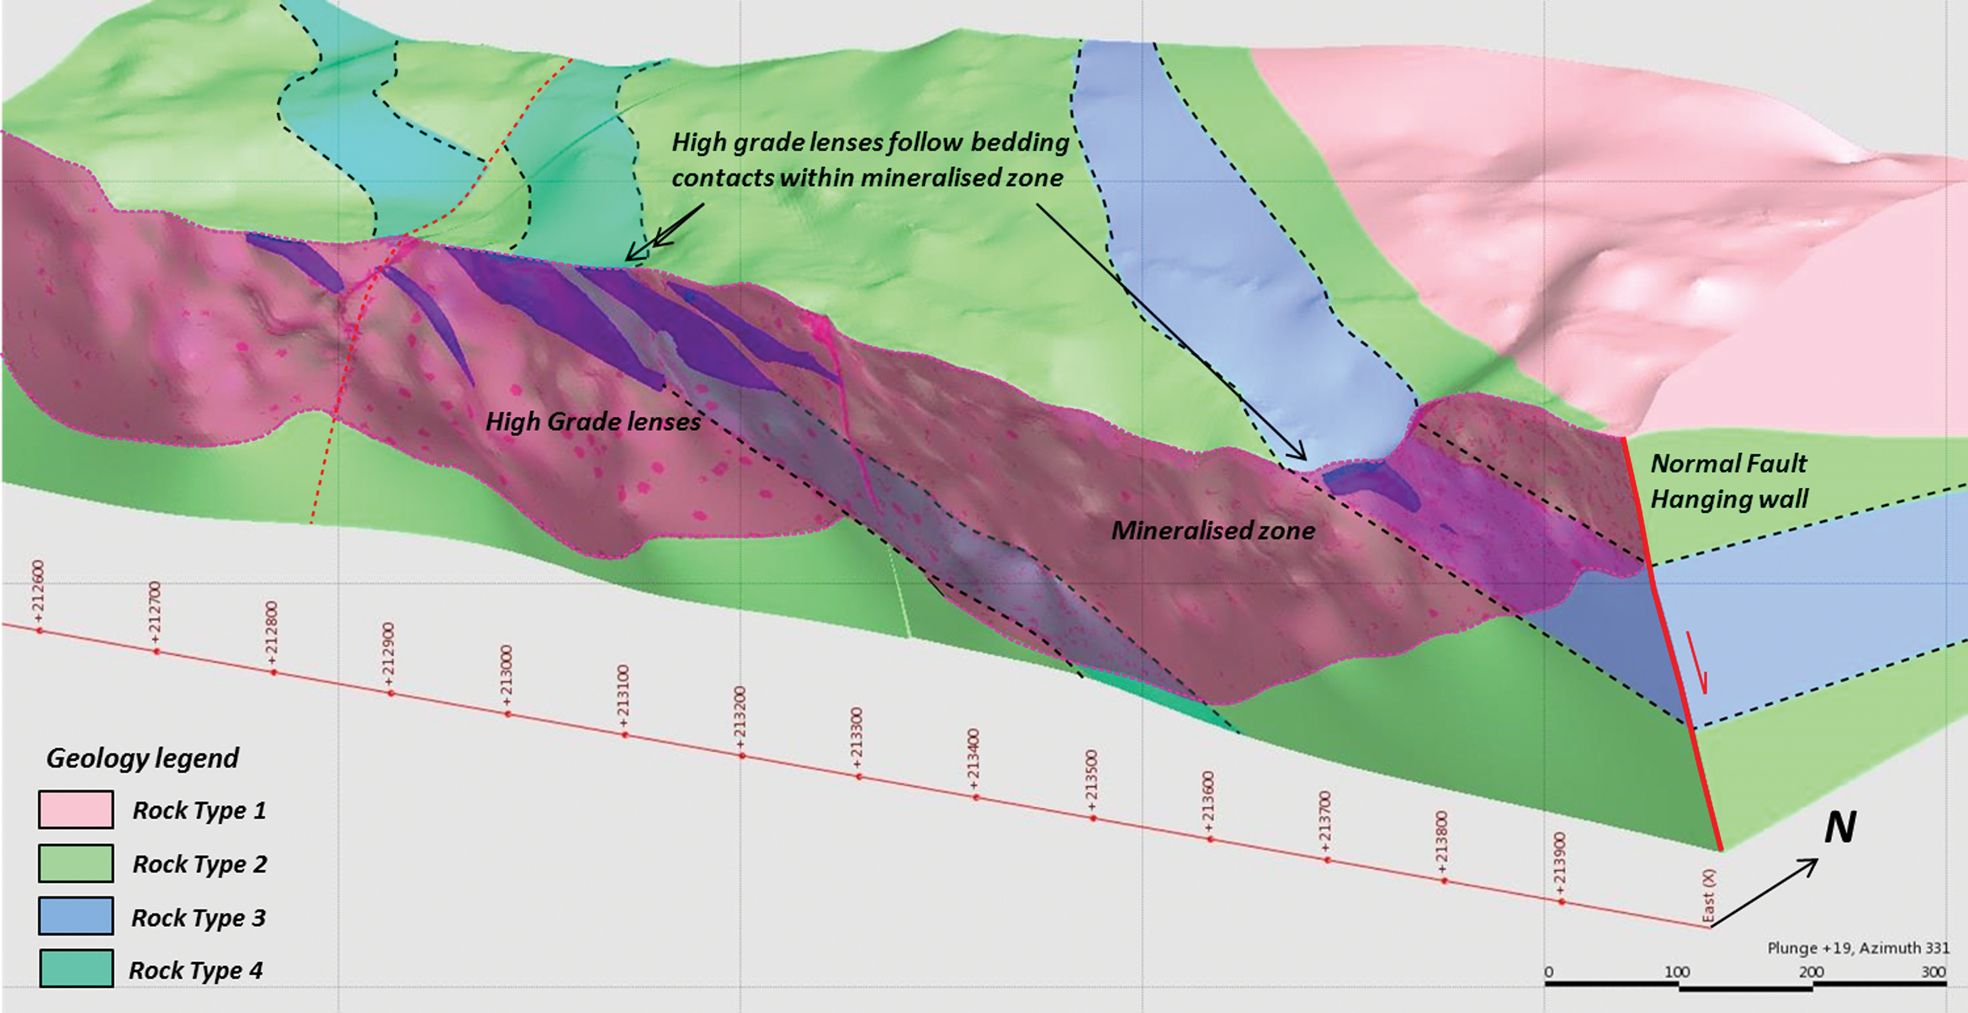
Example of how structural data can be combined with geology to produce a useful illustration. Here mineralisation is located in a normal fault dipping to the north with high grade lenses occurring where the fault zone intersects lithological boundaries
Footnotes
Acknowledgements
These authors would like to acknowledge two constructive anonymous reviewers for their comments and suggestions. MacPhersons Resources Limited is thanked for the use of structural data, photos and images from their Nimbus Project.