
Abstract
Portable X-ray fluorescence (pXRF) technology is fast becoming an important part of the geochemical toolkit for exploration geology. However, the relatively new development of this technology means that the awareness of the issues and pitfalls in pXRF use is lacking somewhat in both industry and academia. For some, pXRF analyses are becoming a panacea and involve an instrument that can be used with little consideration of the data quality and calibration issues that might be associated with the data. This study aims to highlight key considerations in using pXRF during the early phases of exploration within a geologically and geochemically poorly constrained gold deposit. In this scenario, pre-existing manufactured standards may not be adequate to ensure the accuracy of the pXRF analyses. Instead, the use of laboratory-based whole rock analyses of representative samples from the project area act as orientation samples designed to establish reference compositions and used to derive correction factors to apply to pXRF data. These data also highlight the issues in the common industry practice of taking pXRF measurements of pulverised samples through paper packets, an approach that introduces bias towards underestimating the concentrations of many elements of interest and must be mitigated against in order to ensure pXRF data are both accurate and precise.
Keywords
Introduction
The use of field portable X-ray fluorescence (pXRF) analysis in mining and exploration has gained significant momentum over the past 5 to 10 years. This technology has enabled the rapid collection of precise multi-element geochemical datasets and selected indicator elements to guide exploration targeting and to better understand mineralised systems, both of which previously relied on routine, laboratory-based, bulk assaying for Au or other metals. The growing importance of pXRF in geochemistry is illustrated by a survey of the SCOPUS search engine database. Between 1969 and 2014 there have been 440 documents published that contain in their title, abstract, or keywords one of the following phrases: portable X-ray fluorescence, pXRF, portable XRF, field portable X-ray fluorescence, FPXRF or field pXRF. Seventy-seven per cent of these have been published since 2005. The documents range from articles (299), conference papers (75), reviews (25), conference reviews (8), articles in press (11) book chapters (3) and other miscellaneous documentation types (19; Scopus surveyed at 04/06/2014). The subject areas vary widely but in terms of studies that involve geological sample types the literature is dominated by environmental, archaeological and Earth and planetary science studies. However, of the 60 Earth and planetary science studies only 22 are from sources that focus on the mining and exploration of ore deposits, with seven of these 22 falling into the non-peer reviewed literature category. Notably, this tally does not capture the recently published and in press two-volume, thematic issue of Geochemistry: Exploration, Environment, Analysis that contains 13 articles dedicated to the use of field and bench-top pXRF technology (Brand and Brand, 2014; Hall et al., 2014; Piercey and Devine, 2014) and methodology (Fisher et al., 2014; Ross et al., 2014a) in mining (Arne et al., 2014; Quiniou and Laperche, 2014; Ross et al., 2014b; Simandl et al., 2014) and environmental studies (Conrey et al., 2014; Lemiere et al., 2014). For a concise summary of contributors to pXRF work in geology and environmental science the reader is referred to Hall et al. (2014).
We agree with the sentiments of Hall et al. (2014) when they state that the ‘small number of publications on the use of pXRF in exploration and mining belies its current level and depth of application by industry’. Our experience and discussions with both industry and academic colleagues suggests that the majority of pXRF studies are conducted by private industry and are regarded as proprietary. The bulk of pXRF technology, methodology and case studies related to exploration and mining have been increasingly appearing at industry focused conferences and workshops, particularly if the work was tied to academic research. Furthermore, there is a tendency for the emerging ore deposit-related pXRF studies to be focussed on long established mine sites (Gazley et al., 2011, 2014a, 2014b) or gold producing camps (Barnes et al., 2014; Ross et al., 2014b) that are accompanied by extensive, pre-existing databases, fully characterised and well tested standards and a thorough understanding of mineralisation borne out by decades of production (Gazley et al., 2011). Although this research is necessary and informs on many aspects of the application of pXRF technology in mining operations, our search revealed a complete absence of similar studies that use pXRF technology in the early phases of exploration to examine and define deposits where no mine exists, outcrop is poor, the geology is not well understood, and legacy data are of poor or uncertain quality.
These early-stage exploration conditions make it difficult to conduct a pXRF study using the same methodologies as at mine sites or at near-mine exploration targets to produce high-quality data (Fisher et al., 2014). For instance, establishing matrix-specific matches for standards and calibrating the pXRF unit to in-house, site-specific or manufactured standards poses a particular challenge. The matrix of a sample refers to the physical and chemical components that make up that sample and affects the analysis of elements of interest by causing matrix effects such as absorption and enhancement or overlap in spectral peaks (US EPA, 2007; Hall et al., 2012, 2013). Physical matrix refers to variations in grain size, uniformity, heterogeneity, and surface conditions (EPA620). Chemical matrix refers to differences in element concentrations and in geological samples is governed by modal mineralogy, groundmass composition, hydrothermal and metamorphic alteration and veining. The matrix is often broadly inferred by the use of terms such as mafic or felsic; although within these categories large variations exist in major and trace element abundances. The ability to produce high quality data depends on and is safe-guarded by using standards or well characterised reference samples that closely approximate the matrix of the samples being studied. This is true even though the widely used phrase fit-for-purpose may (for some) create a wide berth for what can be considered good or even useable data. There may be a perception that during exploration it is appropriate to use pXRF technology to conduct a preliminary screening of the host rocks; a fit-for-purpose method which implies a high tolerance for low precision and accuracy and a lack or absence of quality assurance–quality control (QAQC) protocols such as standards, blanks, and duplicates. However, preliminary screening is best reserved for very specific investigations such as screening host rocks for elevated Zr in search of dateable zirconium minerals (Morris, 2009). We strongly suggest that the early stages of exploration have an urgent need for high-quality lithogeochemistry data to assist the geological understanding of the deposit, to help direct exploration targeting and provide a foundation for a more extensive and re-usable database as the project matures towards mining. Such databases would facilitate the rapid evaluation and turnover of exploration projects and targets whilst not rejecting promising areas too rapidly, all of which are key factors in mineral exploration. The data from early exploration could then also be used for comparative purposes for exploration in nearby areas.
The methodology of pXRF analysis involves sample collection, sample preparation, analysis, post-analysis data handling and QAQC protocols. Here, we provide a case study that outlines the key considerations and challenges involved in pXRF analysis that need to be incorporated into the design of any pXRF sampling campaign in an exploration setting. There are specific challenges in working with real sample materials where little is known in advance about lithology and matrix-specific characteristics. In this study, we focus on pulverised rock chips and core samples, and present an assessment of analysing samples and standards through paper packets, as a time-saving measure (as is frequently done on both exploration and mine sites, e.g. Gazley et al. (2011), versus through XRF-suitable film such as Mylar® or Prolene®, by examining the precision and accuracy of pXRF data obtained using these methods. These paper packets are routinely used by the commercial laboratories to store the remainder of the pulverised samples (i.e. pulps) sent in for assaying. Finally, we propose a best practise approach that corrects pXRF data using correction factors obtained from laboratory-based analysis of representative samples derived from the same project area so that they are matrix- and concentration-matched.
Past exploration and mining activities in the study area
The study focuses on the dolerite-hosted, orogenic gold Kalpini deposit that is located within the Kurnalpi Terrane, approximately 75 km northeast of Kalgoorlie, Cassidy et al., 2006) (Fig. 1). At Kalpini two areas were mined in the early 1900s: Atlas and Camelia (now referred to as Gambia). The area in and around Kalpini was relatively under-explored between the completion of historic mining and more recent (2011–2013) exploration, with only limited and poorly directed drill programs during the late twentieth century (1972 to the 1990s). The historic Atlas shaft produced 15 218 t of ore at an average grade of 16·5 g/t for 7806 oz Au. The Atlas and Gambia sections of the study area have a Joint Ore Reserves Committee (JORC)-compliant indicated and inferred resource of 4614 Mt of mineralisation at 1·7 g/t Au, equating to 255 600 oz of contained gold. This area is considered to be highly prospective for gold exploration as it is cut by major crustal scale structures, terrane boundaries (i.e. the Emu Fault), and second and third order faults and shear zones. The area is also adjacent to other historic and recent mining centres within the Kalgoorlie and Kurnalpi Terranes that have had significant Au production, including the May Day, Carosue Dam, Black Swan, and Kanowna Belle deposits. The rock types associated with mineralisation at Kalpini are predominantly dolerite and minor andesite. Visually logged core and petrographic samples confirm this classification of the Kalpini host rocks and will be discussed in more detail in a forthcoming study.
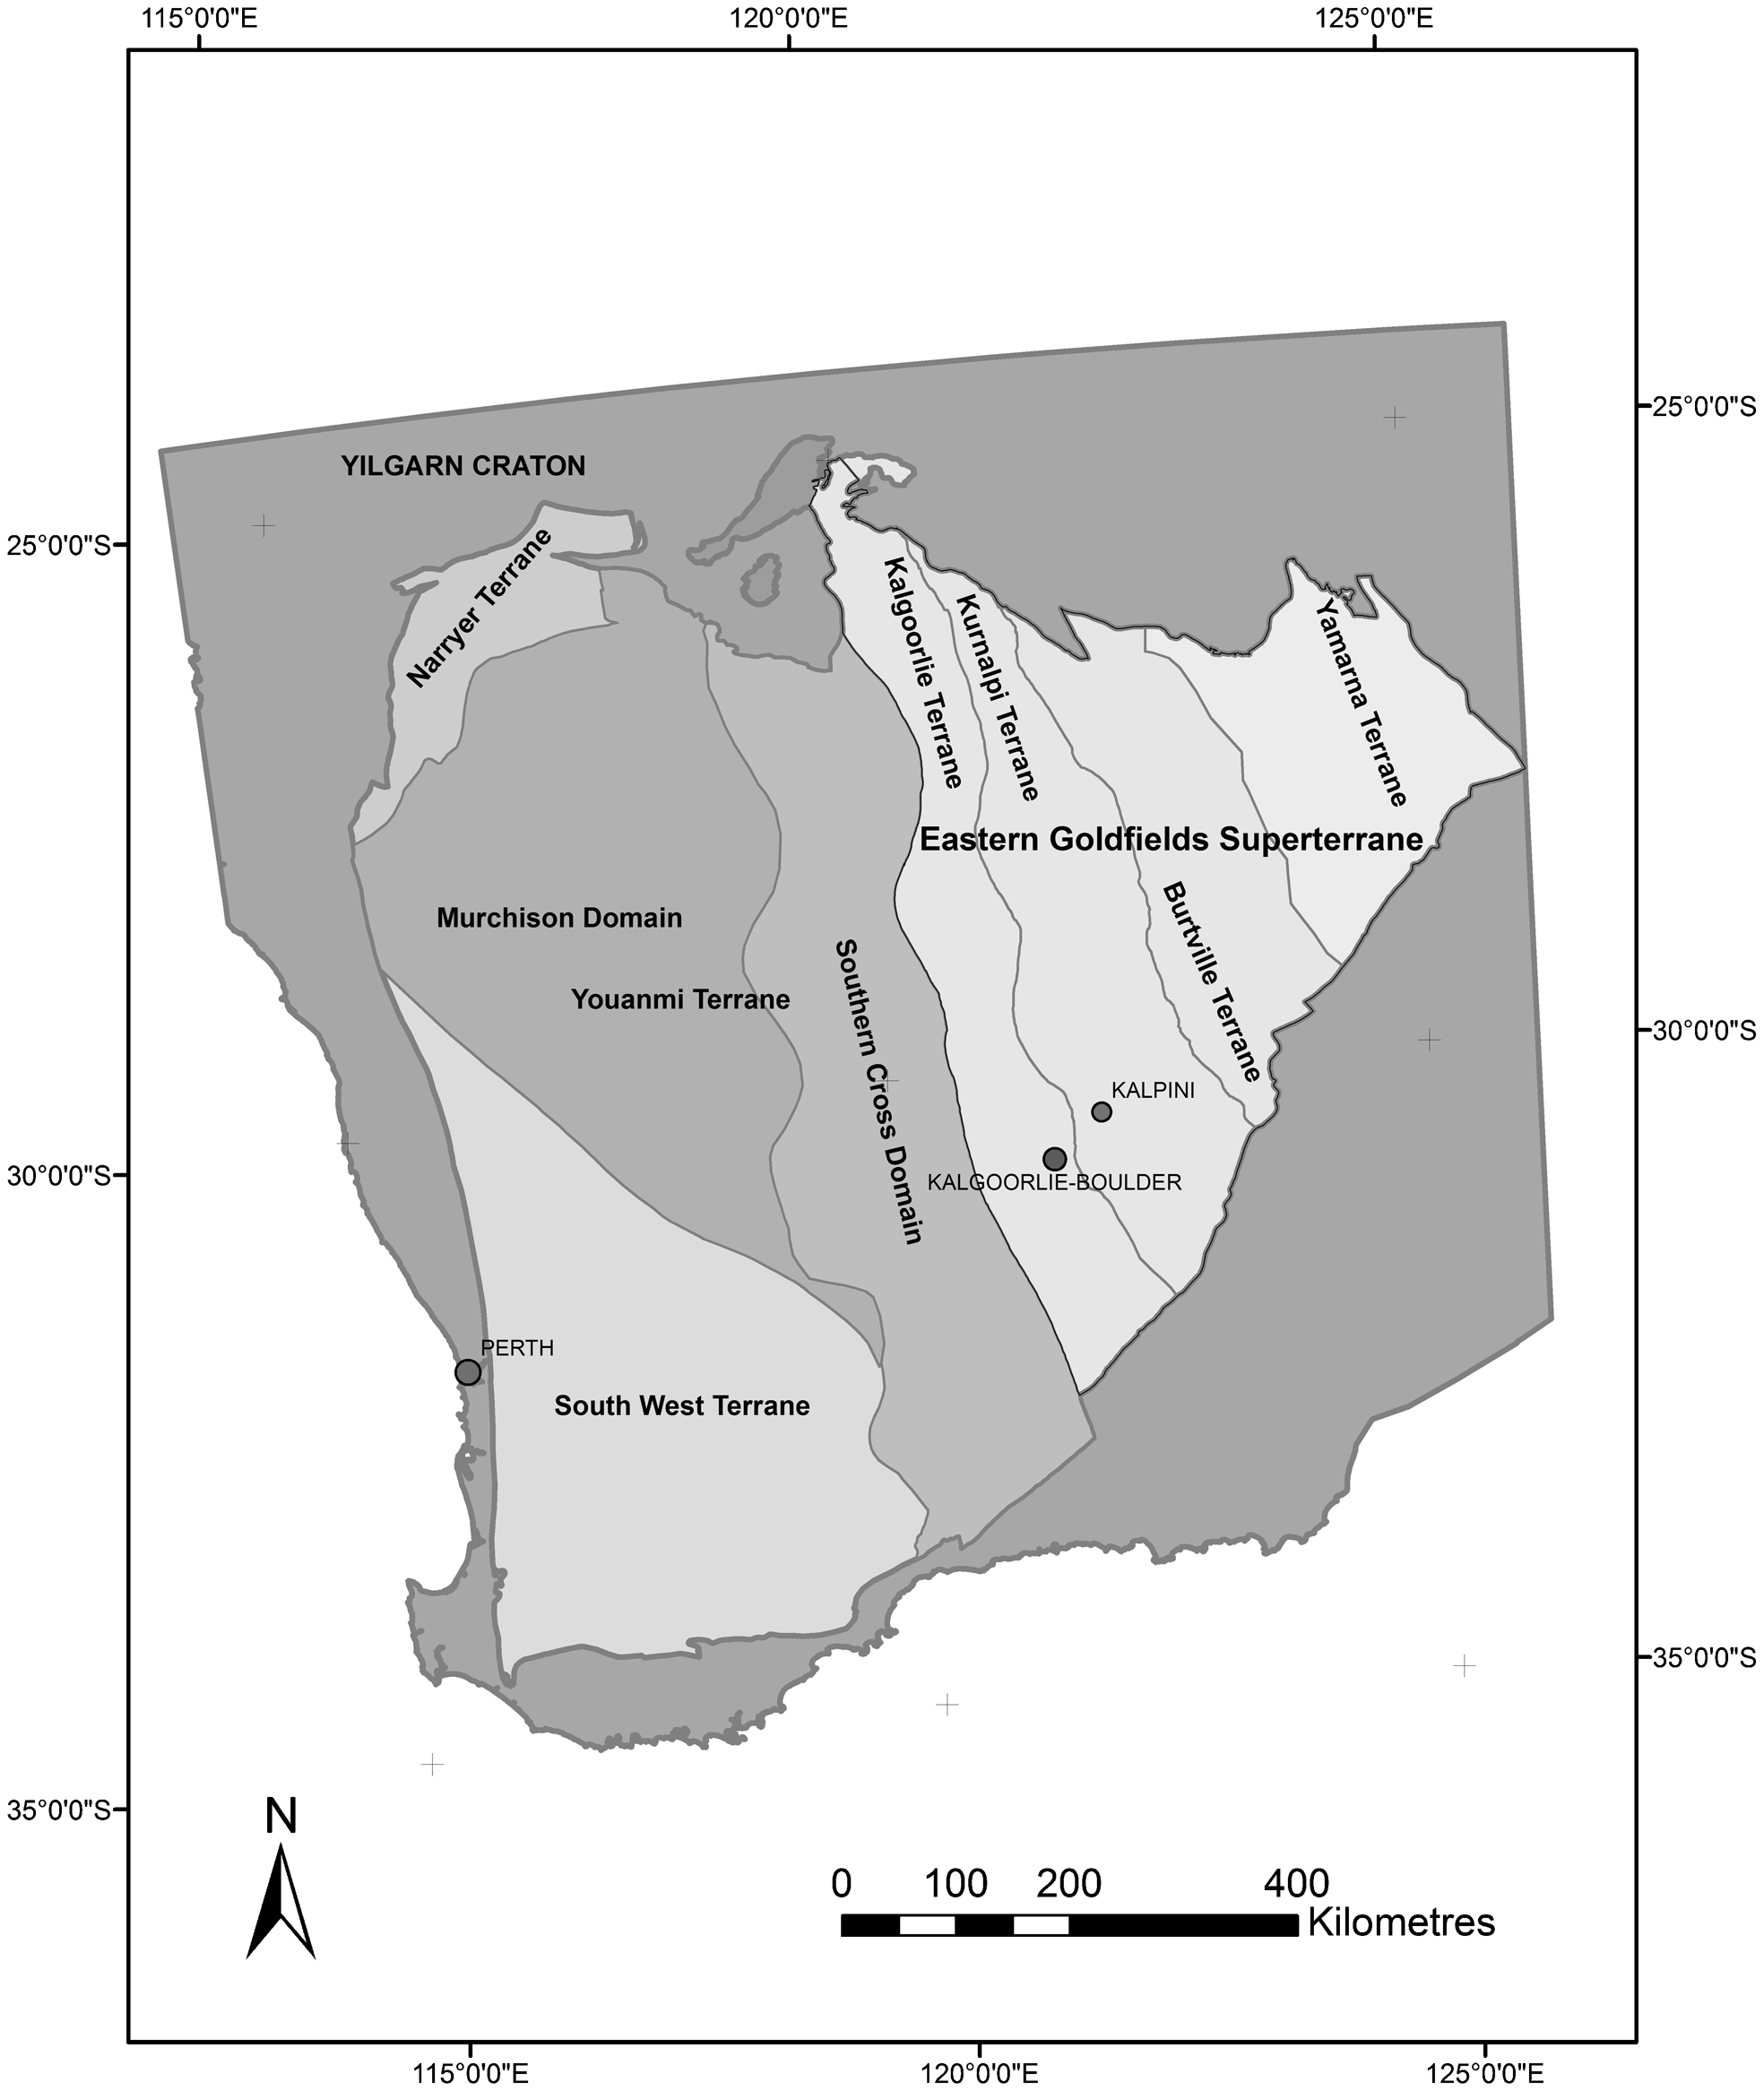
Map of the southern part of Western Australia showing the Yilgarn Craton and its subdivisions into terranes and domains. The location of the Kalpini deposit is shown with the location of Kalgoorlie as a reference (adapted from Cassidy et al., 2006)
Analytical methods
Laboratory-based whole rock geochemistry
The whole-rock geochemical compositions of 50 pulp samples were determined by SGS Pty Ltd. Perth, Western Australia. These samples were analysed to establish the geochemical compositions of the rock types at Atlas and Gambia and to assist with the interpretation and correction of the pXRF data. The sampling approach focused on key drill core from the Atlas and Gambia deposits that hosted the largest variations in lithology, alteration, veining and mineralisation and contained the highest Au grade intercepts. Two drill cores were selected for this purpose, namely KPDD004 from Atlas and KPDD008 from Gambia South, with samples analysed by XRF using a whole rock fusion (22 elements) and a combination of inductively coupled plasma-atomic emission spectroscopy and ICP-mass spectrometry (ICP-MS) after a four acid digest, giving a combined total of 26 elements.
Portable XRF analysis
Portable X-ray fluorescence analysis of 558 pulverised (to 90% passing 75 μm) of 0·3 to 1 m composite core sections from eight diamond drill cores, one reverse circulation drill hole, and 19 surface samples was undertaken during this study. An Olympus Innov-X Delta series pXRF unit equipped with a 4 W 40 kV X-ray tube and a Ta/Au excitation source (anode tube) allowed the detection of a suite of elements heavier than Si in Soils Mode (Table 1). All measurements were carried out in Soils Mode utilising three beams with each beam set for a run time of 60 s in real time. The Soils-Mode analysis used a factory-set calibration that is based on the Compton normalisation method and is designed to achieve the lowest detection limits possible for exploration samples. All of the samples, including standards and the coarse and fine blanks, were measured directly through paper packets with the exception of the two National Institute of Standards & Technology (NIST) soil standards and the SiO2 blank provided by Olympus, which were mounted in pXRF-specific cup holders and were analysed through a thin (4 μm) XRF-suitable film composed of polypropylene®.
Olympus Innov-x Delta series pXRF beam specifications and elements measured on each beam
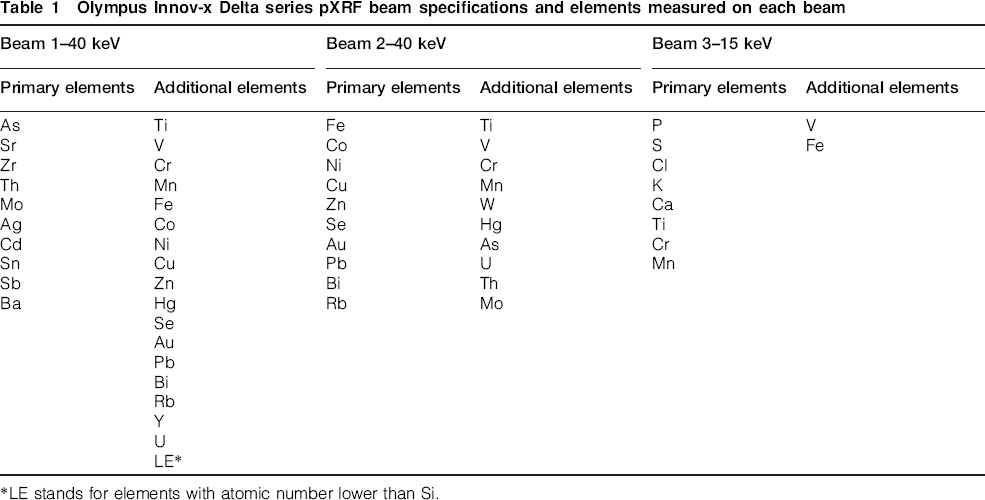
LE stands for elements with atomic number lower than Si.
Precision and accuracy for each analytical session were determined using a set QAQC procedure outlined as follows. At the start of each session the pXRF unit was checked with the calibration disk to ensure the unit passed calibration specifications after which two repeat measurements were obtained for the two NIST soil standards and the SiO2 blank. Following this, a stack of 20 empty paper packets identical to those used to store core pulp samples were also analysed. A duplicate analysis of every twenty-fifth drill core pulp sample was taken. The duplicate analyses were immediately followed by two repeat analyses of one of the Geostats standards and then two repeat analyses of the coarse or fine blank. Each session ended with two repeat analyses of the NIST standards and the SiO2 blank. Another QAQC measure that needs to be considered during the use of this technique in mineral exploration is the moisture content of the samples. Moisture absorbed by the samples can cause attenuation of the X-rays thus affecting the accuracy of pXRF analyses (US EPA, 2007) if the moisture content of the sample exceeds 20%. The samples used in this study were stored undercover, in a dry location in cardboard boxes that were either on shelving or were stacked on wooden crates and wrapped in plastic in order to ensure the samples remained dry, thus preventing any moisture-related attenuation.
Certified reference material and site-specific standards
A pre-existing suite of manufactured standards from GeoStats Pty Ltd (http://www.geostats.com.au/) and coarse and fine blanks were routinely used in all of the exploration drill programs conducted by KalNorth Gold Mines. These standards have a range of Au grades similar to those expected within the Kalpini deposits and were chosen as matches to the rock-types in the Kalpini area according to the broad and general matrix classification typically applied to different types of ore commonly encountered in the Eastern Goldfields Superterrane, namely, fresh, oxidised, mafic and felsic lithologies (Table 2). The original purpose for these standards was for JORC-compliant QAQC reporting for high-and low-grade gold detection from bulk fire assay and ICP-MS analytical methods, respectively. Two NIST standards (2710A and 2711A) and a silica blank were also supplied with the pXRF unit and were used in this study.
Standard reference materials used in this study
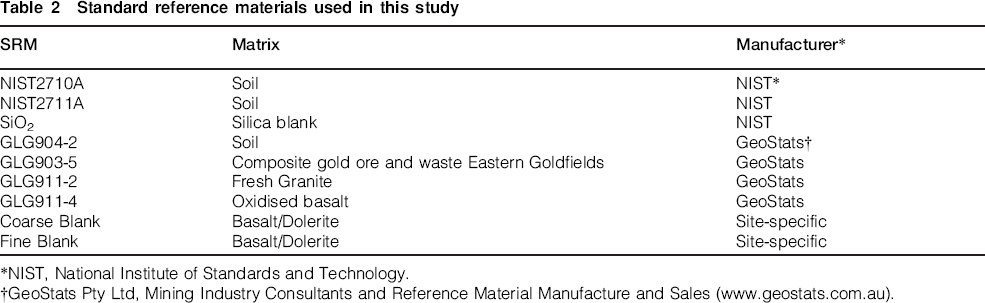
NIST, National Institute of Standards and Technology.
GeoStats Pty Ltd, Mining Industry Consultants and Reference Material Manufacture and Sales (www.geostats.com.au).
The Geostats standards used in this study do not have certified values for a number of elements that were part of the suite of elements analysed by the pXRF unit, namely Bi, Cl, Cu, Pb, and V in all of the Geostats standards, and Ca, Cd, Hg, Mn, Ni, P, Rb, S, Sn, Sr, Ti, and Y in two of the standards (Tables 3 and 4). Furthermore, Zr in all the Geostats standards is below the detection limit for the method used (Neutron Activation Analysis (NAA), <500 ppm) for certification (Tables 3 and 4). Similarly, it should be noted that the factory-provided NIST standards also do not have certified or reference values for a number of these same elements including Bi and Cl and also Mo and S. This assessment of just a small subset of manufactured standards currently in circulation in exploration and mining reveals that many standards are not certified for the full suite of elements measured by pXRF technology. This is a current methodological impediment for companies seeking to use pXRF technology to stretch the return for their exploration and mining budget. Ideally, standards used in routine mineral assaying and whole rock geochemistry measurements must also be suited to the use of pXRF technology. That is, they must closely match the nature and composition of the samples being analysed as well as be able to serve as reliable measures of the performance by having a range of concentrations of all elements analysed within the limits of detection of the pXRF. Historically the emphasis of standard selection has been matching the commodity (Au, Ni or Cu) grade for bulk assay analyses whilst only loosely matching the matrix of the samples (i.e. fresh or oxidised, mafic or felsic).
Certified and reference values for Geostats standards used in this study
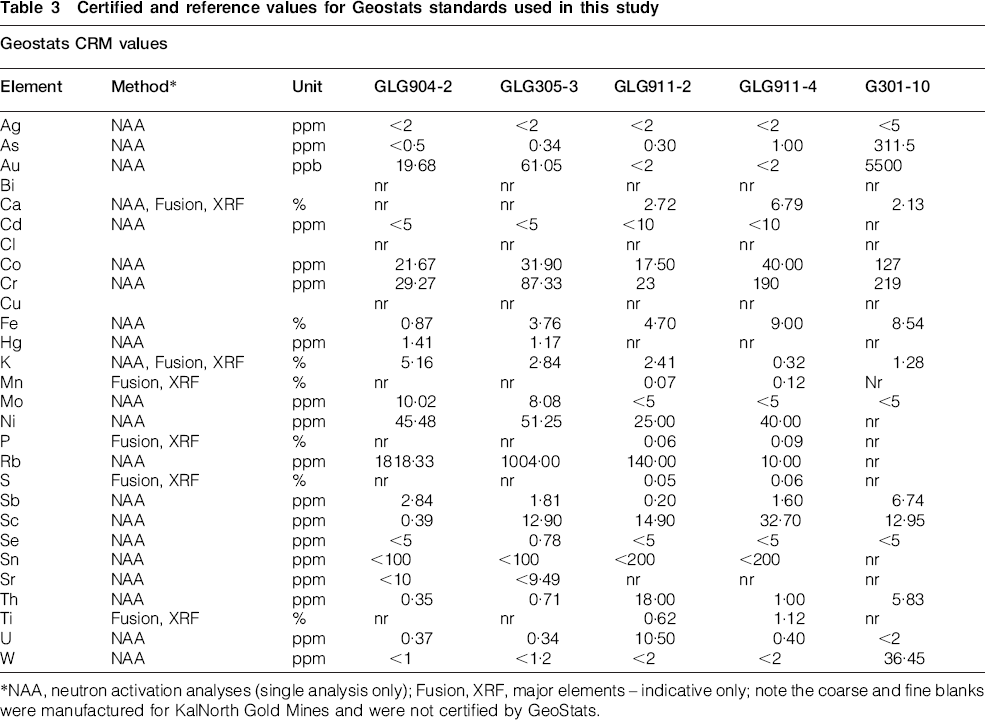
NAA, neutron activation analyses (single analysis only); Fusion, XRF, major elements – indicative only; note the coarse and fine blanks were manufactured for KalNorth Gold Mines and were not certified by GeoStats.
Certified and reference values for the NIST standards used in this study
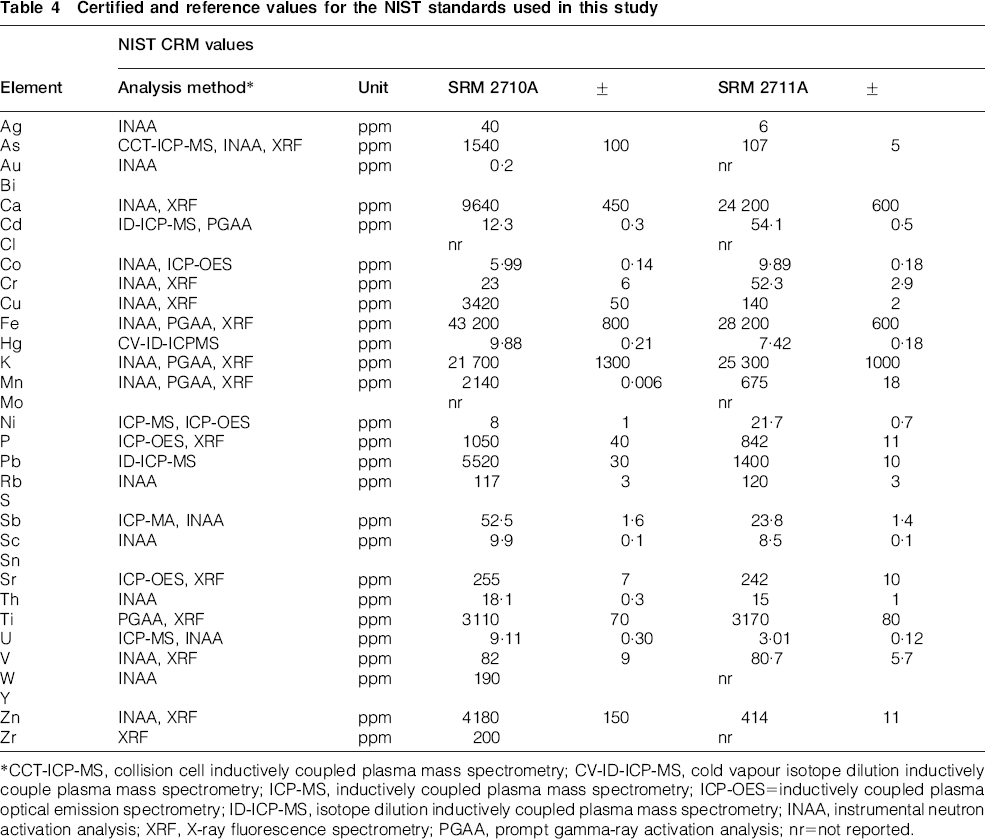
CCT-ICP-MS, collision cell inductively coupled plasma mass spectrometry; CV-ID-ICP-MS, cold vapour isotope dilution inductively couple plasma mass spectrometry; ICP-MS, inductively coupled plasma mass spectrometry; ICP-OES = inductively coupled plasma optical emission spectrometry; ID-ICP-MS, isotope dilution inductively coupled plasma mass spectrometry; INAA, instrumental neutron activation analysis; XRF, X-ray fluorescence spectrometry; PGAA, prompt gamma-ray activation analysis; nr = not reported.
The implications of this are:
these manufactured standards cannot be used to determine accuracy of the concentrations of these elements determined by pXRF without further quantification of the compositions
that without certification for certain elements it may not be possible to use promising pXRF data for JORC-compliant reporting to the Australian Stock Exchange.
This represents a missed opportunity to capitalise on pXRF results, particularly if these non-certified elements are of interest from an exploration, mining or geological perspective, as might be the case for pathfinder elements such as Bi.
The use of (certified) site-specific standards would be one solution to this problem. In this study we used the coarse and fine blanks (with respect to Au) as site-specific standards. These were prepared by crushing and pulverising reverse circulation drill chips of dolerite from a nearby KalNorth Gold Mines site that was known to have Au concentrations below the detection limit of the fire assay method. The site-specific coarse and fine blanks are not certified but were considered to be more representative of the matrix of the dolerite encountered within the KalNorth Goldfields than the Geostats standards. As such, these site-specific standards were adopted for use in this pXRF study in addition to the Geostats standards.
Another solution would be to better characterise the standards and blanks by submitting them to a professional laboratory for analysis to fill in the gaps for some of these elements. This was undertaken by submitting both the Geostats standards and the coarse and fine blanks for analysis at SGS Perth, Western Australia. Major and minor elements were determined by XRF analysis of fusion disks obtained from whole rock samples and trace elements were measured by ICP-MS after an aqua regia (ARM155) digest. This characterises more fully the compositions of these standards, enables the generation of reference values for a suite of elements suited to pXRF analysis and allows the determination of accuracy of the pXRF analyses undertaken during this study (Table 5).
Analytical results from SGS, Perth laboratory (http://www.sgs.com.au/) for the Geostats standard reference material (values derived from a single analysis of each reference material)
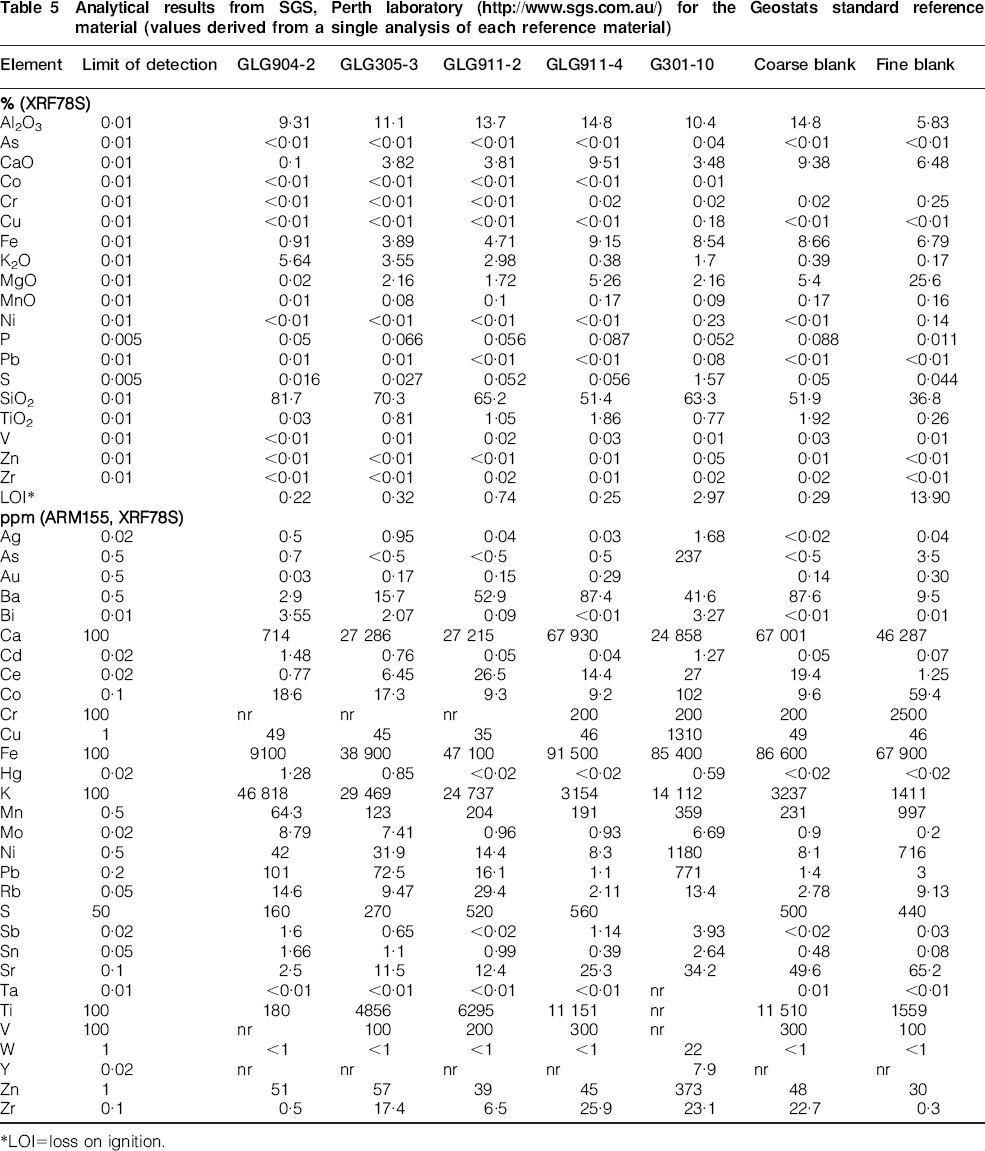
LOI = loss on ignition.
Data quality
Whole-rock and pXRF data
Precision
For each analysis the pXRF unit calculates and records precision as the margin of error (also known as; uncertainty) or the standard deviation (σ) based on X-ray counting statistics. The analyst can choose to have this standard deviation reported as a 1, 2 or 3 σ value for each analysis, corresponding to confidence intervals of 68, 95 and 99·73%, respectively. In this study the margin of error was recorded as 3σ, meaning 99·73% of all measurements are between the obtained value±the 3σ value. Plots of concentrations versus 3σ/concentration provide evidence of the expected relationship between precision and concentration of the sample where increasing concentration is accompanied by increasing precision (Fig. 2).
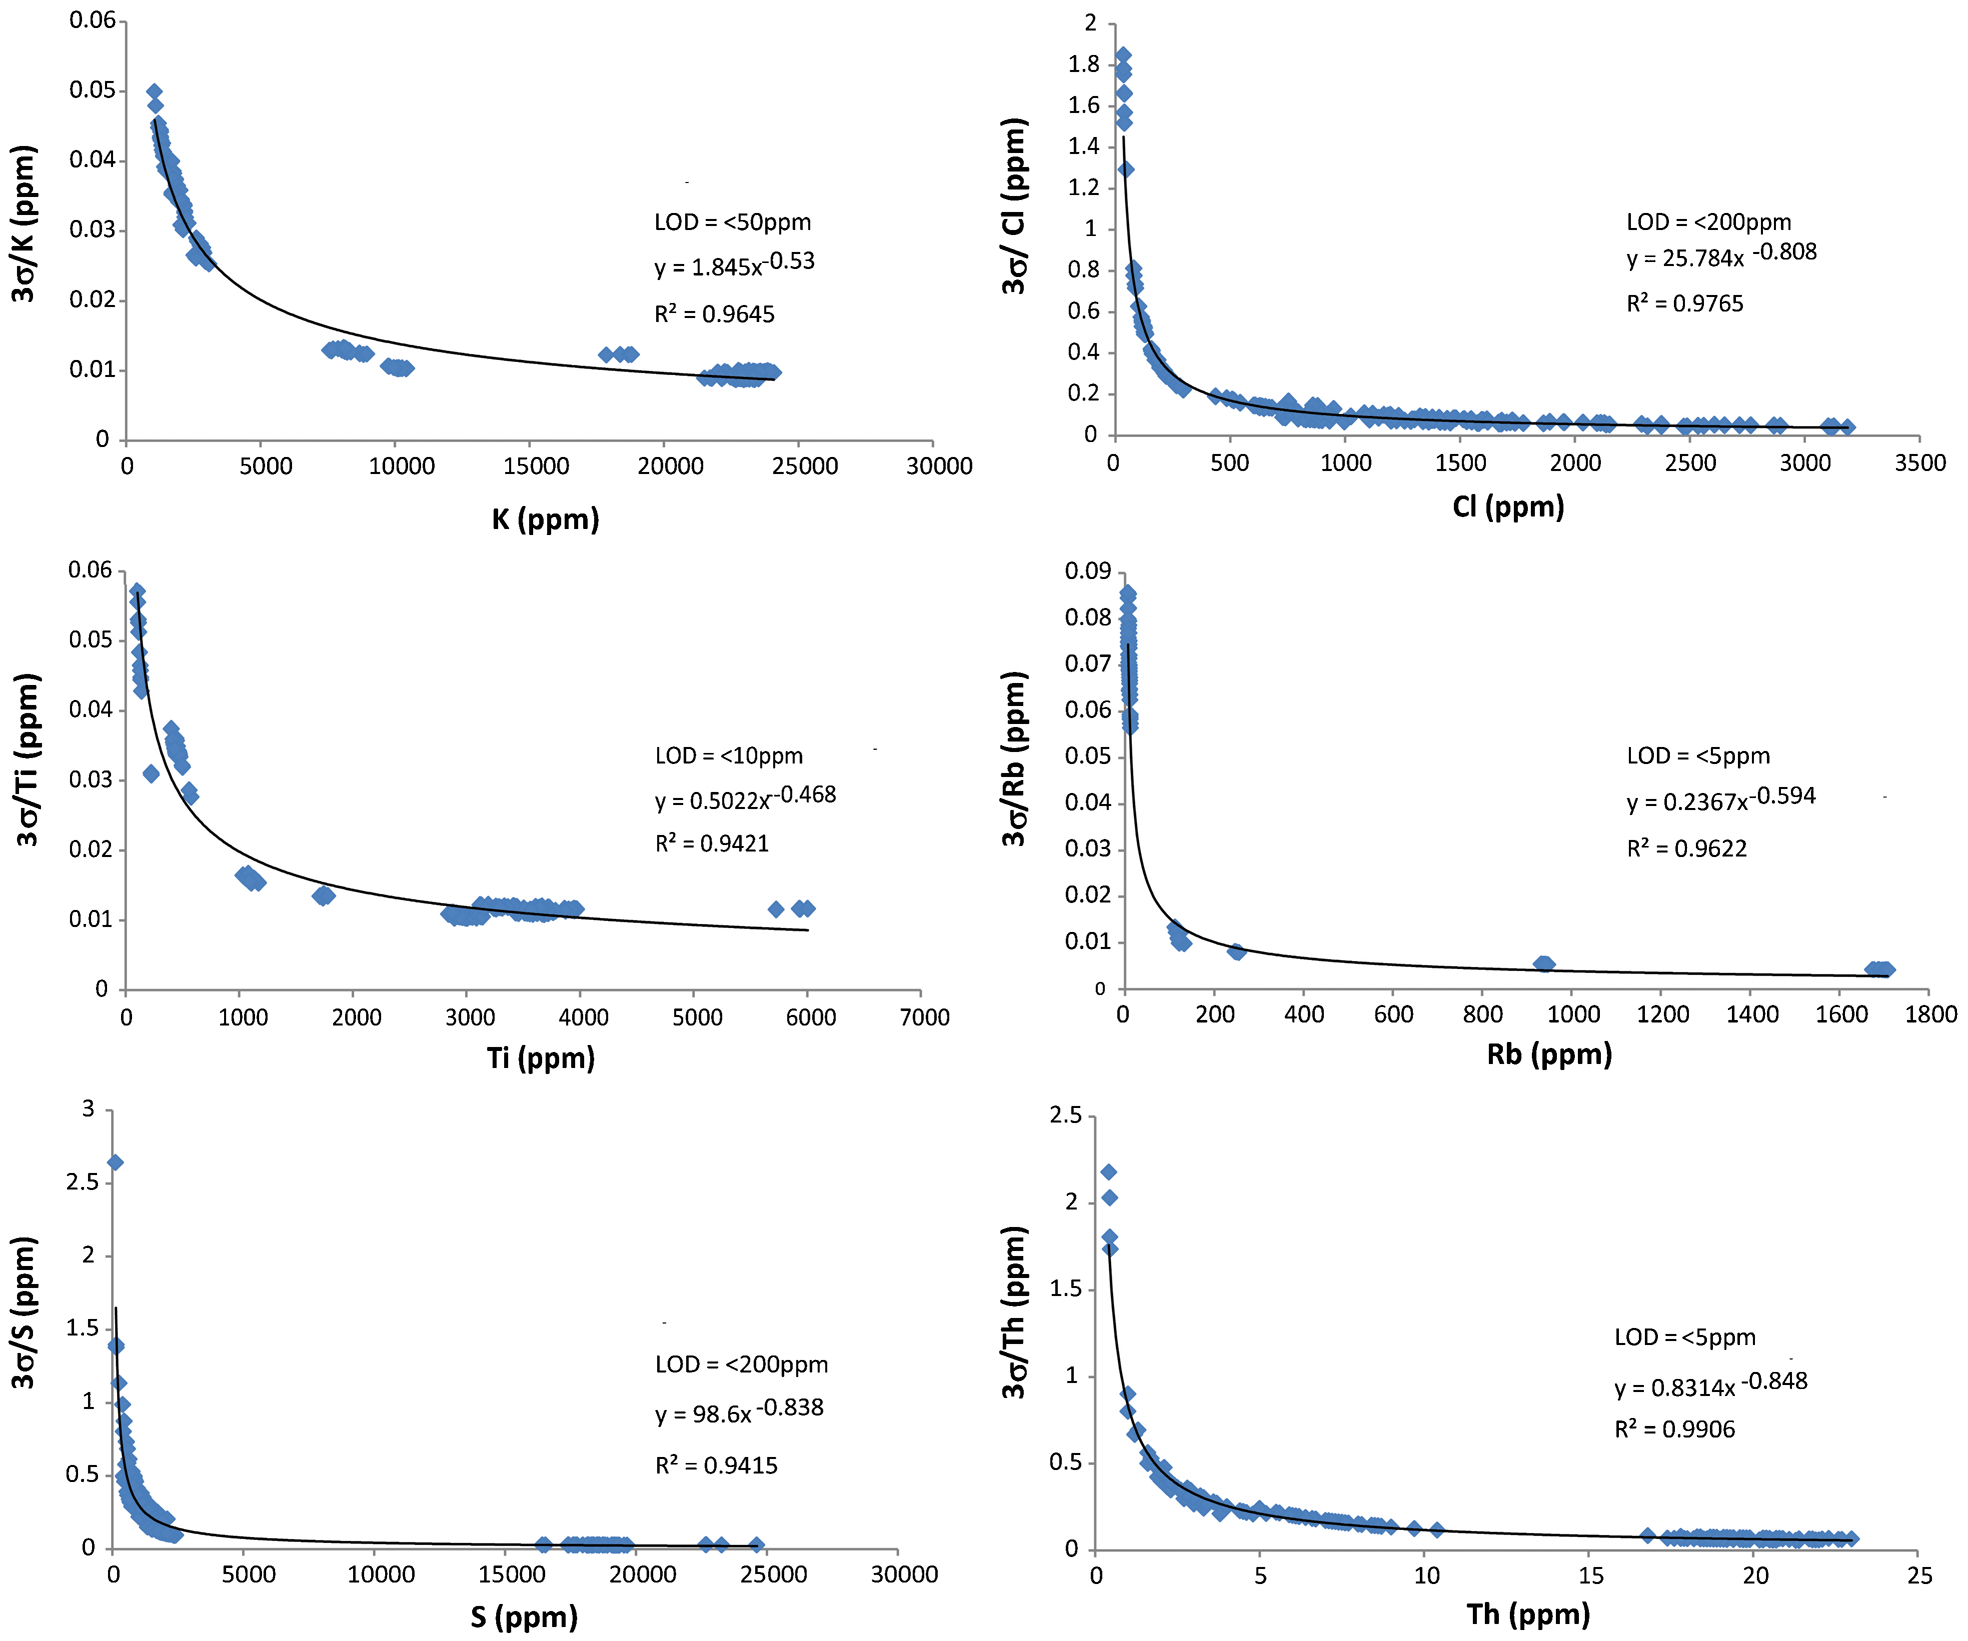
Plots of concentration versus 3σ/concentration for major and minor elements (K and Ti), anions Cl and S and trace elements (Rb and Th)
Precision or reproducibility is also commonly reported as the relative standard deviation (RSD%) which is the standard deviation divided by the mean for each element (i) (equation (1)). In this study, instrumental precision was determined from the concentration data of multiple analyses on the same sample point for standards and blanks

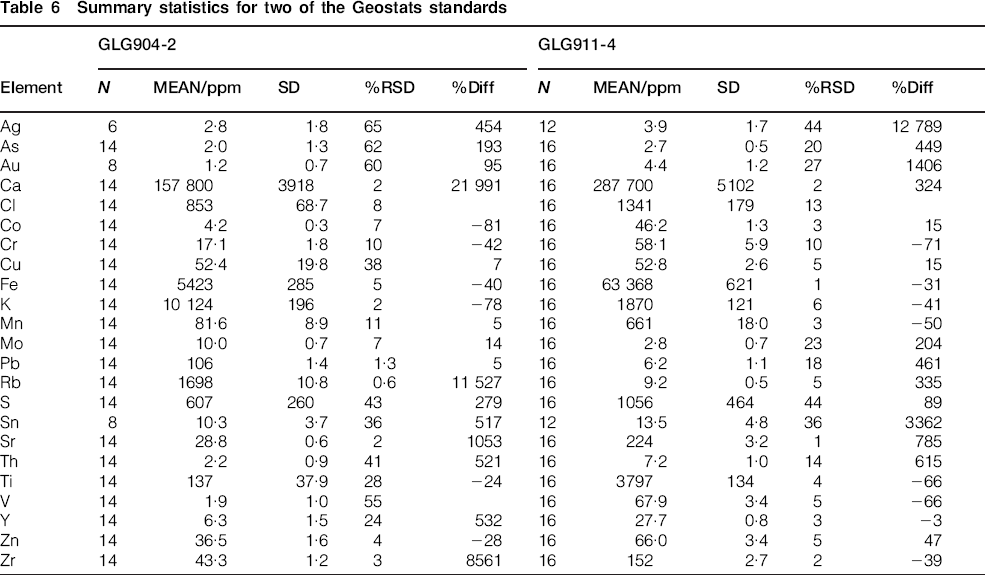
The precision for most elements is less than 10%, which is better than the accepted level for field-portable XRF of 20% RSD for all elements except Cr, which has an accepted value of 30% as reported in EPA Method 6200** (Tables 6–8). A few elements have precision values between 11 and 20% including Ag, As, Cl, Mo, Pb, Sb, Sn, Th and W. The NIST standard 2711A, a number of the Geostats standards and the coarse and fine blanks have consistently poor (>20%) precision for Ag, As, Cl, Mo, S, Sn, Th and W. The poorer results in precision are related to the fact that the concentrations of these elements are close to the limits of detection of the pXRF and is consistent with the errors recorded by the pXRF instrument (i.e. the 3σ values, determined by counting statistics) during analysis and shown in Fig. 2.
Summary statistics for two of the Geostats standards
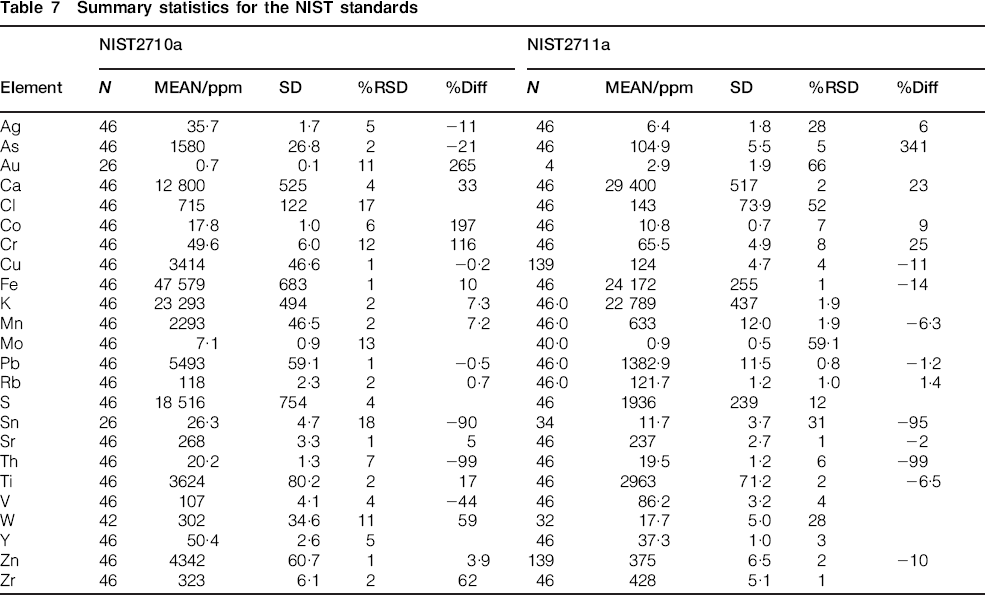
Summary statistics for the NIST standards
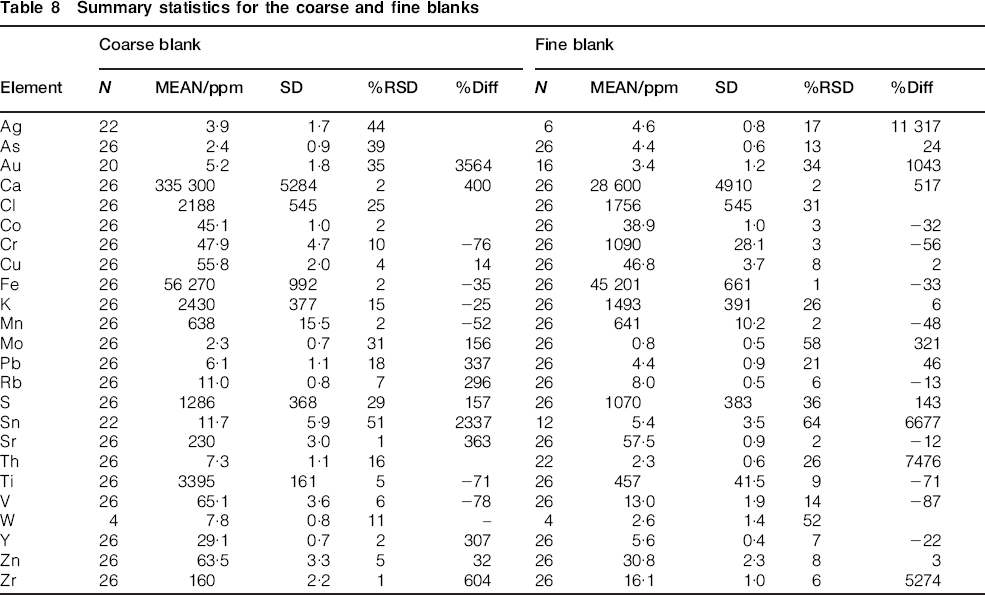
Summary statistics for the coarse and fine blanks
Accuracy
Accuracy is determined by the degree to which the pXRF measurement of an element in a sample matches the certified (or reference) value for that element in the same sample. This was assessed using relative per cent difference or bias values (equation (2)). These values are the percentage form of the difference between the average value for an element in a sample measured using the pXRF and the accepted certified (or reference) values. The bias describes the degree to which the average pXRF value varies from the accepted value and whether the average pXRF value is less than or greater than the accepted value, as these bias values can be either positive or negative.
If a certified concentration was not available for a particular element the SGS laboratory-based concentration was used. The standards and blanks have a very wide range in the degree of accuracy with a significant proportion of elements having poor accuracy (>±20%) (Tables 6–8). This is consistent with a number of other pXRF-based studies that report significant variations in accuracies depending on the suite of elements being measured (Hall et al., 2012, 2014; Ross et al., 2014a). The consistent nature of the poor and variable accuracies is likely to indicate the presence of systematic errors within pXRF data acquired using factory calibration settings, e.g. Ross et al. (2014a).
A common pXRF technique is to measure pulped samples stored in containers, for example, the paper packets that the pulps are stored in after bulk assaying at the laboratory. The systematic errors mentioned above are compounded by taking measurements through the paper packets. Furthermore, some elements are disproportionately affected over others and can be identified by comparing the results of the analyses of NIST standards with those of Geostats standards and the empty paper packets. It is important to remember that the NIST standards were measured through an XRF film whereas the Geostats standards, the coarse and fine blanks and the samples analysed during this study were measured through paper packets. Indeed, paper packets are used industry wide to store pulp samples and are reportedly being used in pXRF work at mine sites (Gazley et al., 2011). The decision to measure through the paper packets in this study was guided by time and human resource constraints.
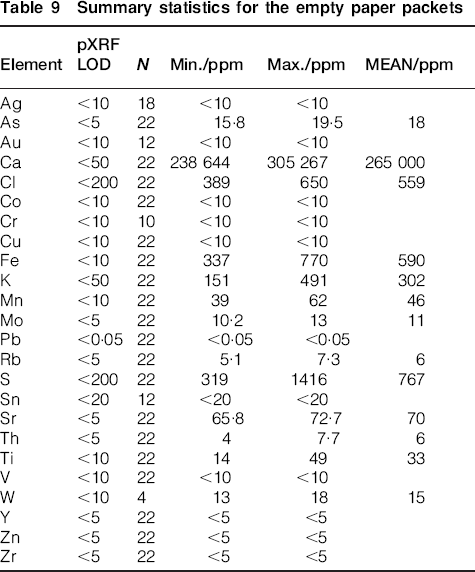
Some elements are present within the empty paper packets at concentrations much higher than background and up to several times higher than the reported limit of detection for pXRF; these include Ca, Cl, Fe, K, Mn, S, Sr and Ti (Table 9). Of these, Ca is present in the highest concentrations (average of 265 000 ppm) and provides the best example of how an additive interference from the paper packets affects the values of the Geostats standards (Fig. 3). The pXRF Ca values for the Geostats standards are significantly elevated compared to the certified Ca values for these standards and these elevated Ca values are strongly related to the presence (or at least detection) of Ca within the empty paper packets (Fig. 3; see purple line). This leads to a significant overestimation of the Ca contents of the Geostats standards analysed by pXRF. This is clearly demonstrated in Fig. 3 where pXRF measurements plot well above the 1∶1 reference line that represents perfectly accurate data, although the clustering of individual data points suggests that the pXRF analysis is precise (<5% RSD). In comparison, the Ca concentrations for the NIST standards determined by pXRF plot very close to the 1∶1 reference line although they still have fairly poor accuracy (>20%). These data indicate that the NIST samples are affected by a systematic error imposed by the pXRF, leading to an overestimation of Ca concentrations, whereas the additive interference caused by the paper packet, evident in the Geostats standards and the coarse and fine blanks, certainly overwhelms any systematic errors.
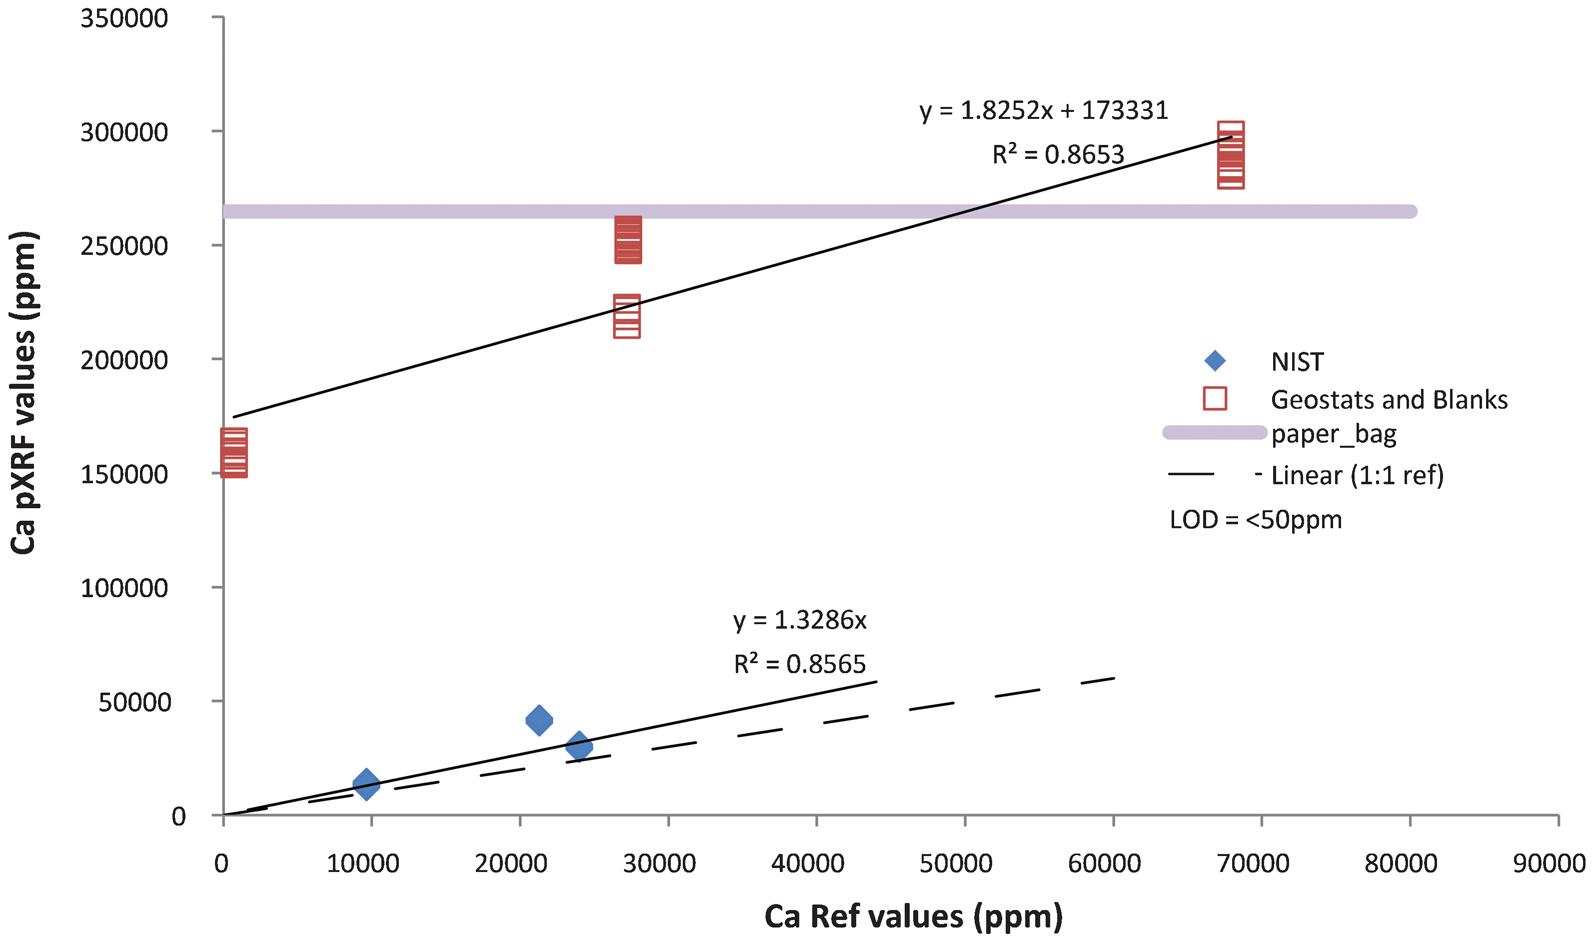
Plot for Ca of the certified and reference values versus the pXRF values for the Geostats standards and the coarse and fine blanks (red squares) measured through paper packets and the NIST standards (blue diamonds) measured through polypropylene® film. The horizontal, purple line is the average Ca composition of the paper packets
Summary statistics for the empty paper packets
Other elements are present in high concentrations within the paper packets but it is not always possible to separate the effects of these interferences from the systematic error imposed by the factory calibrations of the pXRF. This is clearly shown by Fe, where the Geostats standards deviate from the 1∶1 reference line but the NIST standards plot close to the 1∶1 reference line and in this instance are reasonably accurate (10 to 14%; Fig. 4). The paper packets contain significant concentrations of Fe (average of 590 ppm), suggesting that pXRF analysis will overestimate the amount of Fe present in the samples and produce results that plot above the 1∶1 reference line, as in the case for Ca. However, this is not the case, as the Fe concentrations of all of the Geostats standards are underestimated by the pXRF and plot below the 1∶1 reference line. This same effect is observed in the majority of the analyses of other elements within the Geostats standards and the coarse and fine blanks (Fig. 4).
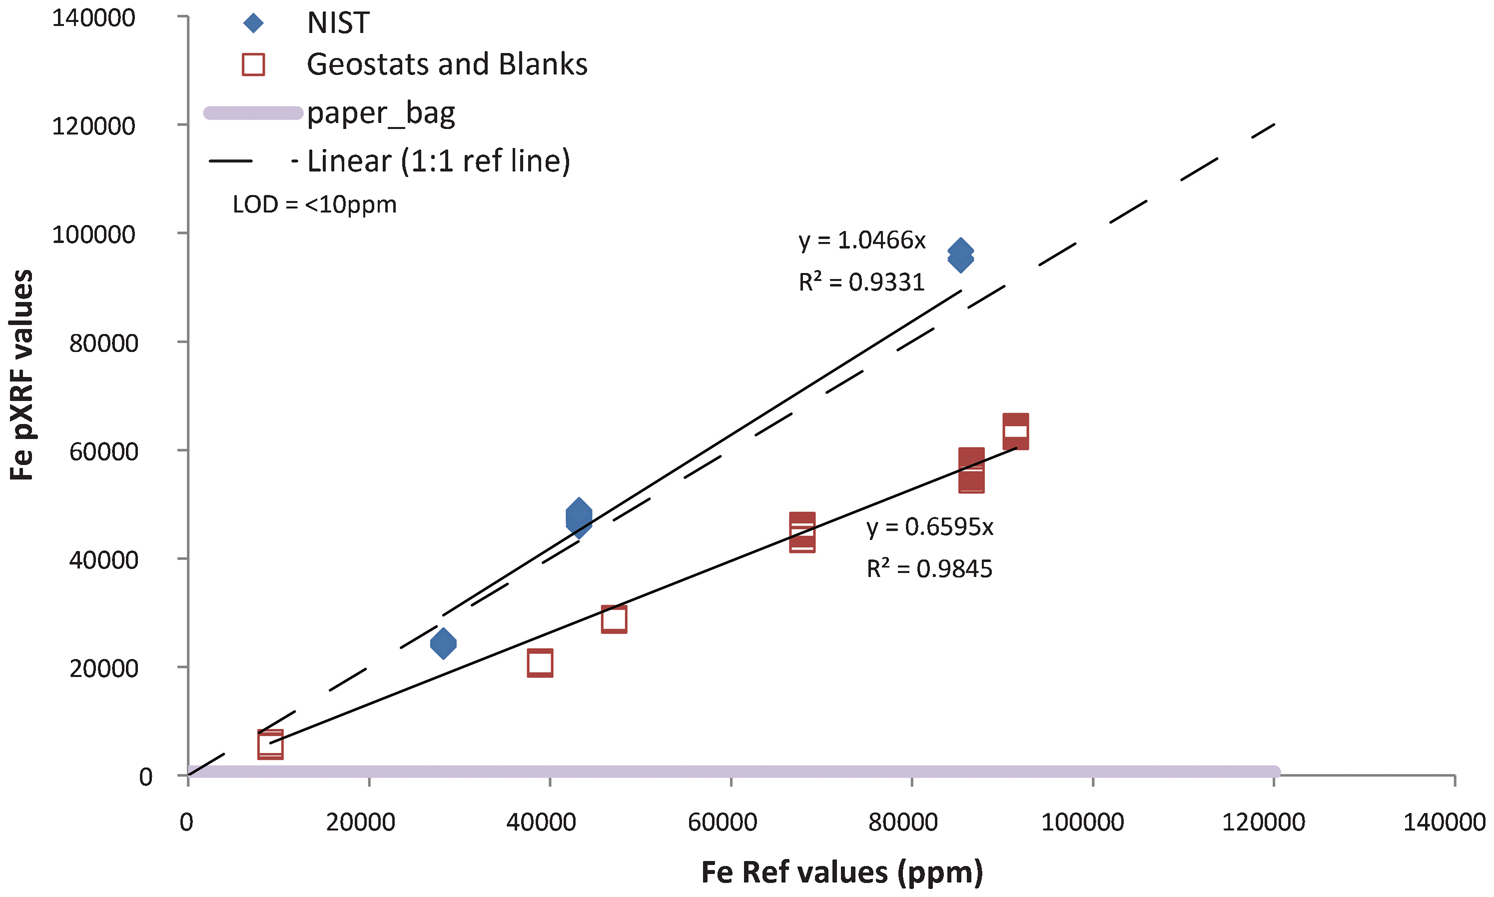
Plot for Fe of the certified and reference values versus the pXRF values for the Geostats standards and coarse and fine blanks (red squares) measured through paper packets and the NIST standards (blue diamonds) measured through polypropylene film. The horizontal purple line is the average Ca composition of the paper packets
These results indicate that obtaining accurate pXRF data requires the data to be thoroughly corrected, taking into account sample packaging, in order to assess the nature of the geochemical variations within the drill core samples. The majority of the elements have good precision, indicating that although the results may not be accurate they are certainly reproducible. This is an important point that needs to be considered during pXRF analysis. Sample storage in paper packets and potentially, other storage media, requires analysis techniques to be carefully considered and incorporated into any QAQC measures applied to pXRF data and should certainly be discussed in both company reports and scientific papers that deal with this type of data.
Data handling – correction factors
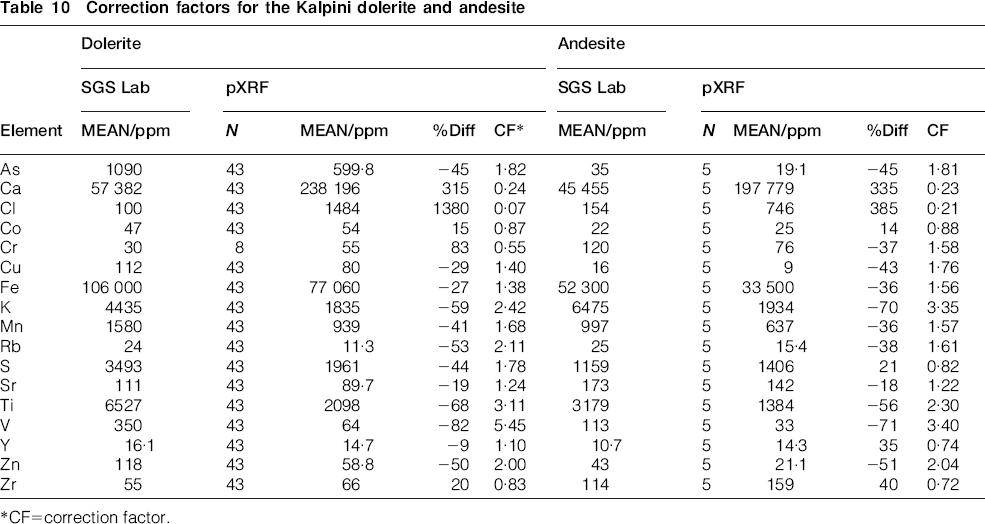
The systematic errors introduced by the pXRF factory calibration and the procedure of taking measurements through paper packets were adjusted using correction factors derived from laboratory-based whole rock analyses of the same pulp samples that were analysed using the pXRF. These correction factors were determined by dividing the average of the laboratory-based values by the average pXRF values for each element for the two main rock types present at Kalpini: dolerite and andesite (Table 10). This approach using laboratory-based whole rock analyses was applied in preference to correction using the Geostats standards for a number of reasons. As mentioned earlier, the Geostats standards do not have certified values for all of the elements analysed by the pXRF (e.g. Zr, Y, Ti and Bi). In addition, the Geostats standards do not cover the concentration ranges for many elements present in the samples being analysed; a factor that cannot easily be anticipated at the outset of a study in an area with previously poor geochemical characterisation. To reiterate, the main purpose of these standards in the exploration drill programs was to provide a QAQC match for the expected gold grade of the drill core. The rock types (i.e. matrix) of manufactured standards can generally only be loosely constrained by very basic lithological descriptions that enable matching to the visual appearance of drill core samples. This means that there is a high probability that many manufactured standards will not be ideal matrix-matched samples that can be used to correct pXRF data.
Correction factors for the Kalpini dolerite and andesite
CF = correction factor.
The laboratory-based whole rock analyses are not certified; however, they are representative and provide exact matrix matches to the lithologies of the samples analysed by pXRF. This method of correction is similar to that used by Ross et al. (2014a, 2014b) to account for small, scale heterogeneities in drill core. Note the large percentage difference between the laboratory-based analyses and the pXRF analyses; these values provide further evidence of the systematic errors introduced by the pXRF measurements (Table 10). The correction factors are overwhelmingly >1, indicating that pXRF analyses through paper packets commonly underestimate the concentration of the element in a sample as a result of attenuation of the pXRF signal by the paper packets. The storage medium is a key consideration that needs to be incorporated into the design of pXRF analysis and data handling.
The differences in the corrections factors for the dolerite and andesite vary from −53 to 205% with the average difference of 16%. To illustrate the consequences of accepting the original pXRF results we present the whole rock and pXRF data for Ti and Zr for the samples. The immobility of Ti and Zr makes them ideal elements to use for lithological classification in instances where primary mineral textures have been obliterated by alteration and metamorphism (Hallberg, 1984). The whole rock geochemistry allows us to equivocally define the dominant lithologies at Kalpini as dolerite and andesite (Fig. 5a). However, the original pXRF data for the same samples incorrectly identify these samples as andesites and dacites, conflicting sharply with both the whole rock data and the petrographic analysis of these samples (Fig. 5a). The corrected pXRF data shown in Fig. 5b is consistent with the laboratory-based whole rock data and shows the samples to be correctly classified. In this approach, laboratory-based whole rock analyses act as orientation samples designed to establish reference compositions and thin-section analysis provides petrographic control and ensures the accuracy of the pXRF analyses used during this study.
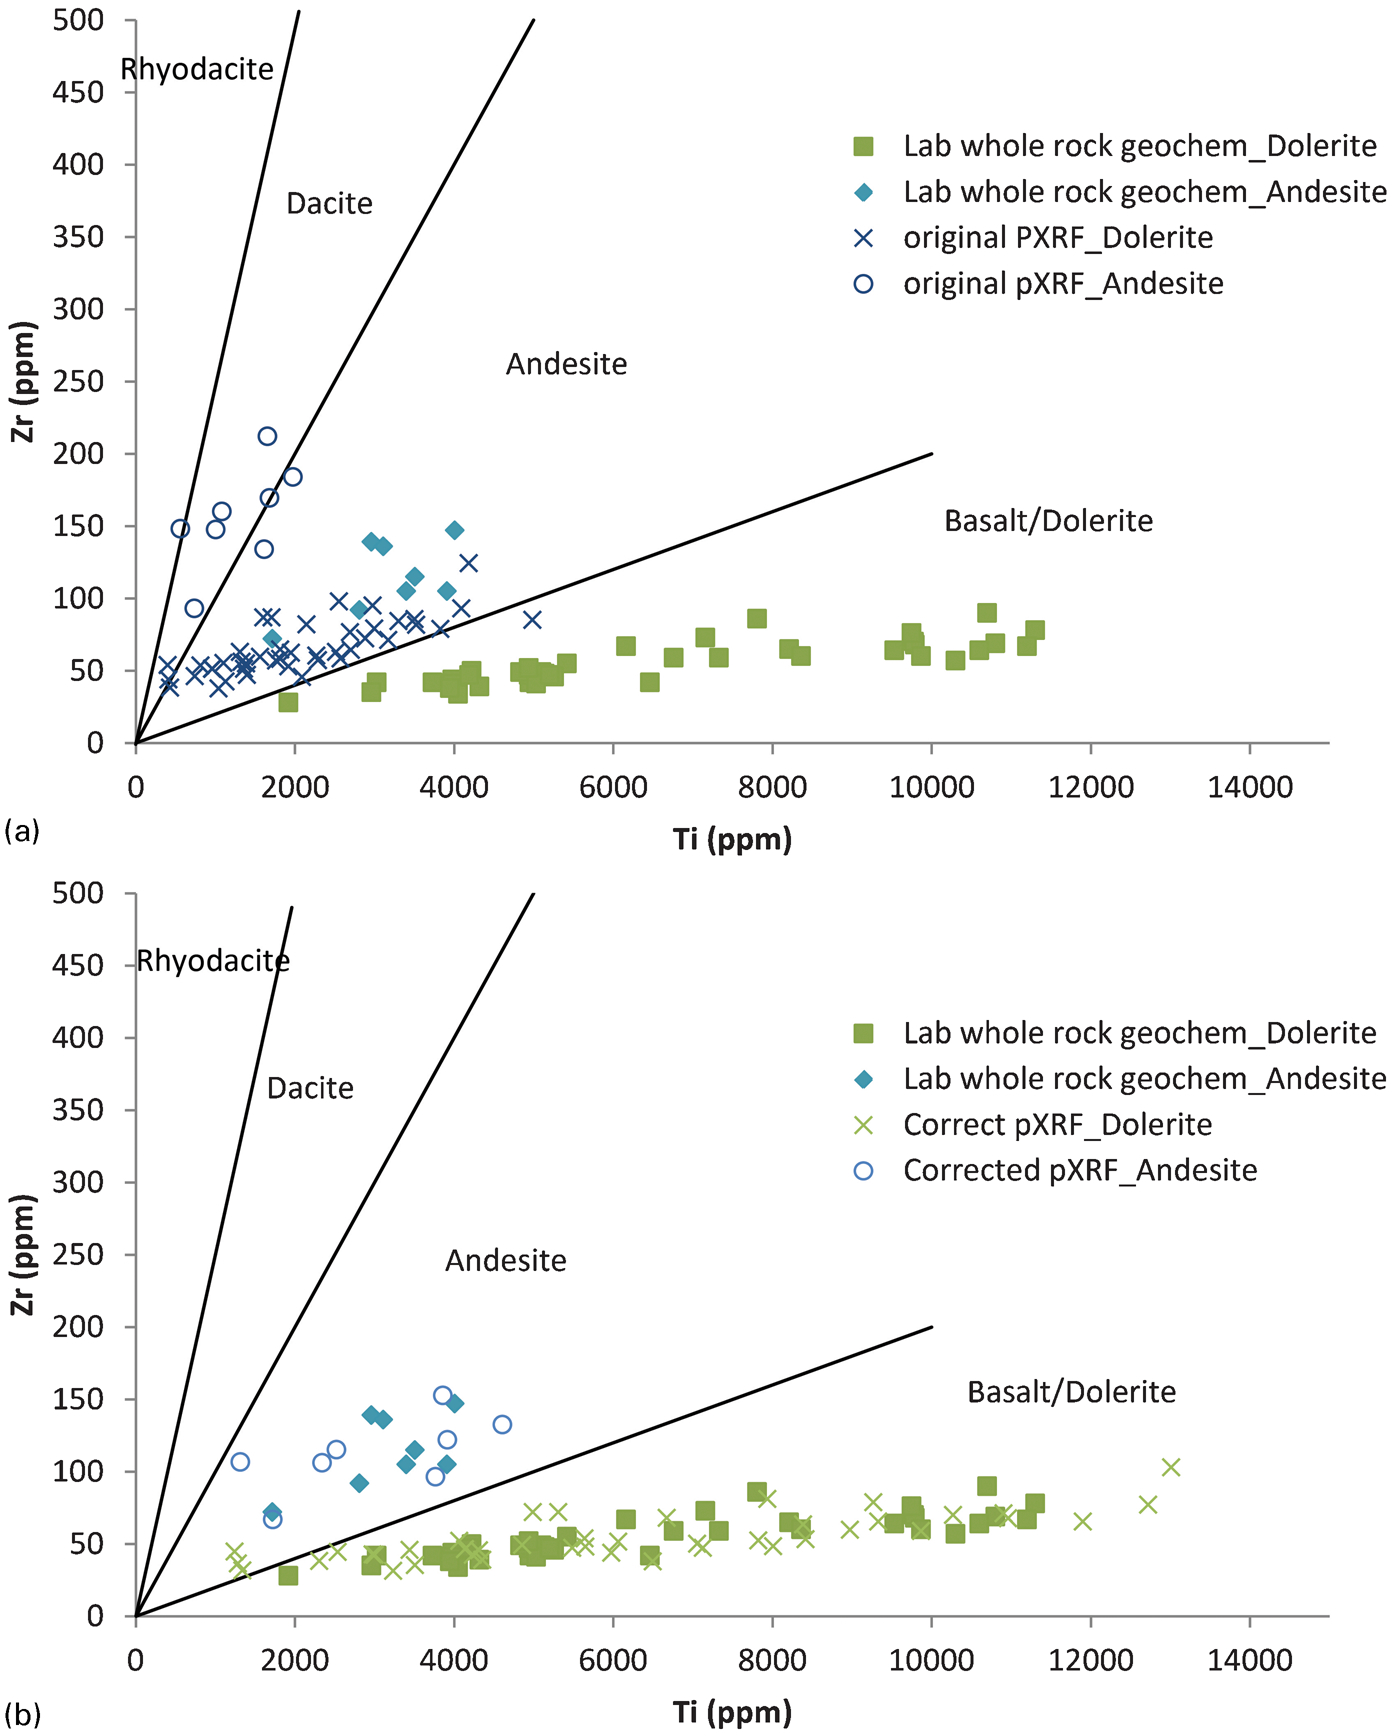
Plots of Ti versus Zr illustrating the distribution of lab based whole rock geochemistry in comparison with a uncorrected and b corrected pXRF data. Note how the uncorrected Atlas and Gambia samples plot within the andesite and dacite fields, whereas the data, after correction factors are applied, plot more accurately within the andesite and dolerite fields
Conclusions
The issues related to both the accuracy and precision of the pXRF data presented here indicate that indiscriminate use of these instruments should be strongly discouraged. Consideration of sampling media, storage media and data quality are critical, even though pXRF is capable of rapidly generating significant amounts of data for an exploration project that may be under pressure to prioritise targets. The presence of systematic errors associated with instrument calibration as well as uncertainties related to sample storage containers and other media need to be considered, identified and, if possible, mitigated or removed prior to any large-scale acquisition of data. The elements most strongly affected by these systematic errors are used as important indicators for a range of geological associations and processes. These include volcanic classification, parent lithologies, geochemical changes during metamorphism and hydrothermal alteration and, importantly, geochemical associations with gold mineralisation. Reduction of these uncertainties requires well-planned, detailed analysis, using both pXRF and traditional laboratory analysis such as XRF or ICP-MS. Calibration of sampling media, matrix- and concentration-matched samples and duplicates and, ideally, acquisition of a project-specific set of well-characterised, in-house standards is also essential. Only after all these factors have been accounted for should pXRF data be used with confidence in an exploration setting. Portable XRF undoubtedly provides a rapid and cost-effective means of assessing geochemical changes down-hole and in the field, but the technique generates data containing uncertainties that need to be identified and removed prior to any detailed field or analytical campaign.
Footnotes
Acknowledgements
P. Durance, S. M. Jowitt and K. Bush acknowledge the support and assistance of KalNorth Gold Mines in carrying out all of the work associated with this study. The authors specifically thank Wade Johnson and Alan Coventry for their time, work and helpful discussions regarding the Kalpini gold deposit. David Sie and Camila Golding are thanked for the hours of pXRF analyses undertaken during this study. P. Durance would also like to acknowledge the support of GNS Science while writing up the results of this work. Mark Lawrence and Mark Rattenbury are thanked for their reviews of an earlier draft that improved the quality of the manuscript. The original manuscript was greatly improved as a result of thorough and thoughtful reviews by Malcolm Roberts, Pat Hayman and an anonymous reviewer, and editorial handling by Neil Phillips.