
Abstract
Gravity recoverable gold characterisation methodologies are the single- or three-stage tests, which generally use a standard feed sample mass. A case study of low-grade coarse gold-dominated mineralisation is presented that demonstrates the high variability of test results using different sample masses. Samples were processed using the single-stage test and subsequently entire development rounds were batched through a plant for comparison. Unsurprisingly the results indicate that the small (≤50 kg) test samples grossly understate plant gravity recoverable gold and display poor precision. Larger samples display improved precision, but still understate plant gravity recoverable gold. The small mass samples are unrepresentative as they do not contain the full gold particle size distribution. Poor representivity is enhanced by gold particle clustering. Small samples generally capture finer more abundant and disseminated gold particles, but rarely contain clustered gold. The use of standard GRG test sample masses is challenged. Test work should be based on spatially distributed representative field samples, that if required are split to representative sub-samples for testing. An early stage gold particle size characterisation programme is required to optimise sample mass and improve representivity.
Keywords
Introduction
Sampling of in-situ and broken ore material is a critical step in the design of mineral processing plants. The process of collecting and testing samples must be undertaken carefully to ensure representivity and to maximise the quality of the results obtained. For a sample to be representative, it must be both precise and unbiased. If a field sample or sub-sample mass are too small, then precision will be poor. Precision (Precision is used as an indicator of representivity. Precision is quoted as the percentage coefficient of variation [COV = (standard deviation/mean×100)], where a value above ±20% signifies poor precision and indicates that the sample mass and/or procedure requires improvement) relates to the in-situ geological nugget effect in the mineralisation (Dominy 2014). In broken rock, it principally relates to the fundamental sampling error (Pitard 1993). Bias generation results from poor practice during sampling and laboratory treatment, and the proliferation of the sampling errors (Pitard 1993). These errors can be controlled through rigorous test and quality assurance/quality control procedures.
Gravity recoverable gold (GRG) is a gold recovery parameter based on liberated gold or high-grade composite gold particles that can be recovered by physical separation methods (e.g. batch centrifugal concentrator). The benefits of recovery by gravity separation are well-defined and relate to increased gold recovery and operating cost reduction (Laplante and Gray 2005).
Despite the obvious importance of GRG determination, associated sampling and test programmes frequently receive less attention than other metallurgical parameters (Dominy et al. 2011). Studies are often of limited scope and/or over-focus on high-grade zones. There is a trend to use a standard test sample mass without consideration of the nature of the mineralisation, which leads to unrepresentative samples and inaccurate GRG evaluation.
Mineralisation containing substantive quantities of coarse gold (>25% above 100 μm), generally yield high GRG values. Deposits are often typified by a high-nugget effect which represents variations in: (i) the in-situ size distribution of gold particles (including effects of gold particle clustering), and (ii) gold particle abundance (e.g. grade). Grade is generally correlated to gold particle size, although the relationships are complex (Dominy et al. 2008). Higher relative grades often relate to abundant coarse gold and/or clustered gold particles and hence, greater GRG potential. Many deposits yield mineable grades of ≤4 g t−1 Au and contain high levels of coarse gold, sampling such mineralisation is always challenging (Dominy 2014). Optimising gold recovery in these deposits is critical to achieve economic viability, and requires effective metallurgical sampling and testing.
This paper reports on a unique investigation of GRG variability in low-grade coarse gold-dominated mineralisation. A comparison is made between single stage GRG tests of different sample mass, pilot and development bulk samples, and stope ore batches. It links sample representivity to gold particle distribution, and in particular the critical effect of gold particle clustering. The study demonstrates that the use of standard GRG test masses is potentially inappropriate in low-grade coarse gold-dominated mineralisation.
GRG test methodology
Two methods based on batch centrifugal concentrators are used to determine GRG (Fig. 1): the single- (SGRG) and three-stage tests. The two approaches generally use feed sample masses of 20–40 kg and 40–60 kg respectively (Mass ranges based on the review of 50 GRG test reports). Details of both tests are given in Laplante et al. (2000), Laplante and Spiller (2002) and Huang and Koppalkar (2010). The three-stage test is more commonly applied, though the simpler single-stage test has gained acceptance for scoping studies.
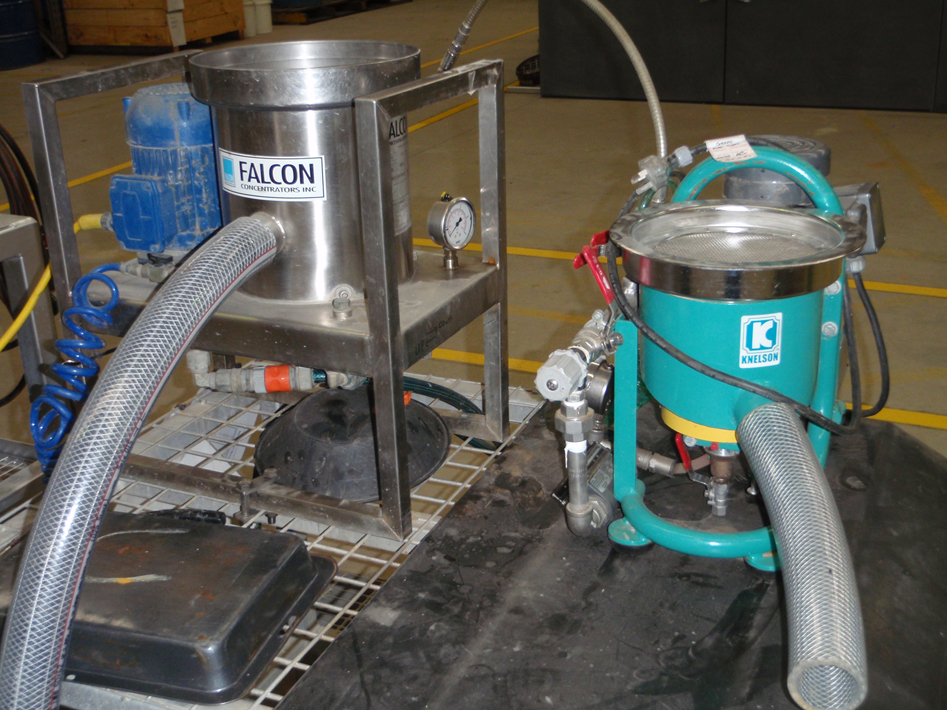
Laboratory-scale Falcon concentrator (left) and Knelson concentrator (right) used for GRG testing
A field sample may be tested in its entirety or sub-sampled to a standard mass prior to testing (Fig. 2). The latter approach potentially yields unrepresentative sub-samples even if the field sample is representative.
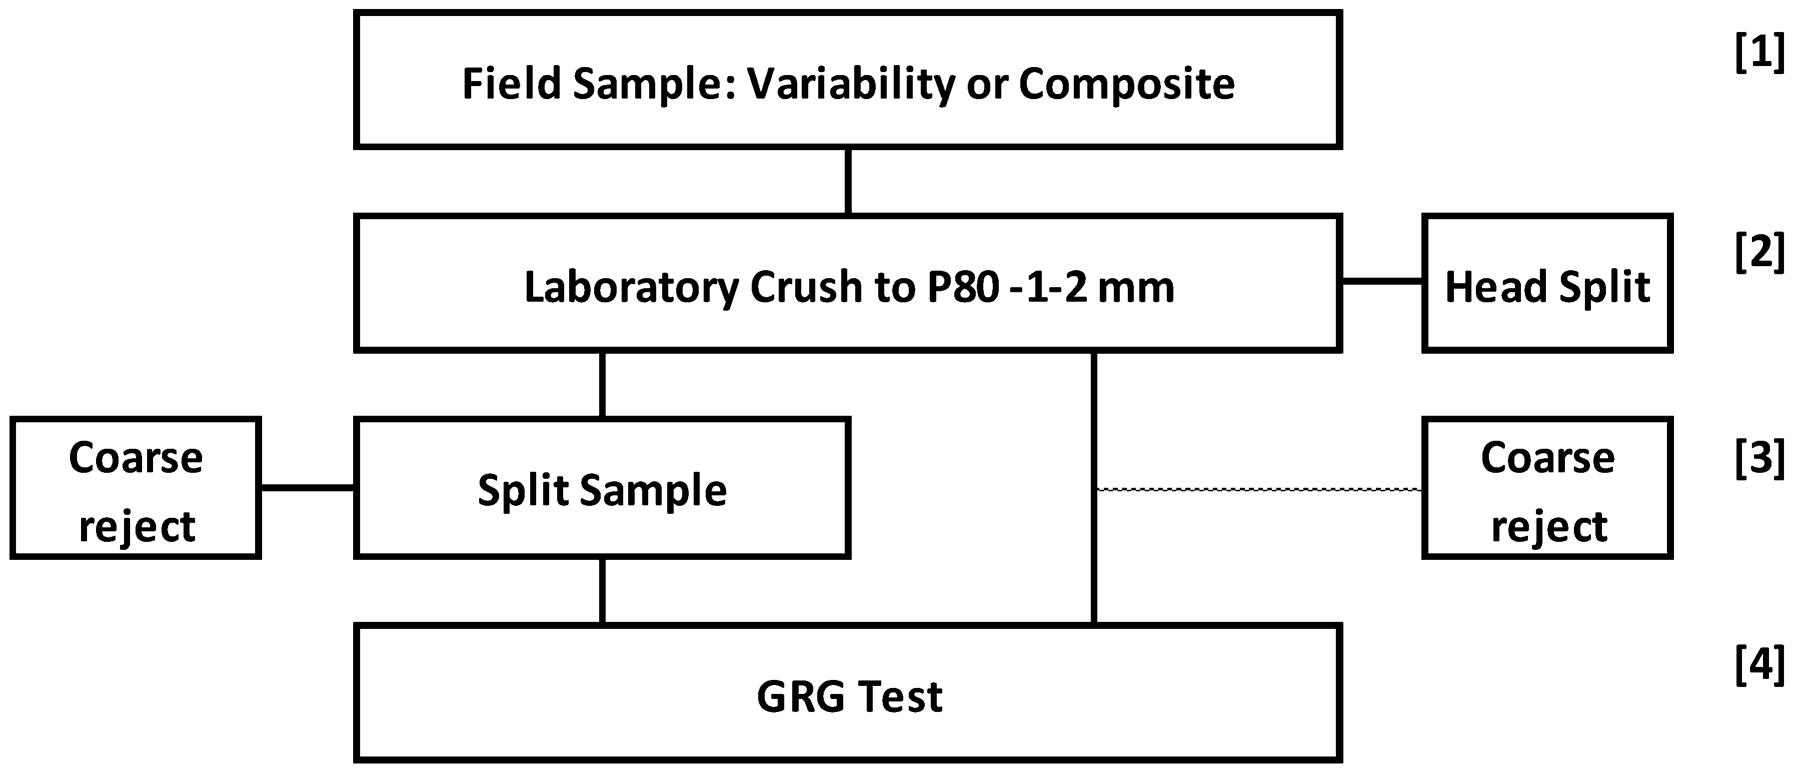
Sample flow from field to GRG test. [1] field sample composited from multiple samples or single variability sample; [2] laboratory crush followed by 2–4 kg split for head grade assay; [3] where primary sample reduced, sub-sample for testing taken or no split. Where no sample split for GRG, a reference split of up to 4 kg may be taken; [4] GRG test
Maintaining sample representivity
Sampling and project stage
Sampling programmes are an iterative process. Initial expectations of sample mass and density will often be based on experience. A primary programme should be considered ‘sampling for sampling’, where samples are collected for a range of metallurgical and mineralogical tests to characterise the ore type (Dominy et al. 2010). The focus of characterisation is the determination of gold particle size range and distribution. A critical output of this stage is the liberation diameter (In context of the Theory of Sampling, the liberation diameter is the screen size that retains 5% of gold given a theoretical lot of liberated gold) and its variation with grade (Pitard 1993, Dominy et al. 2008) and degree of clustering (Dominy and Platten 2007). Samples should be collected from different geometallurgical domains and across a range of grades. Focusing solely on run of mine and/or high-grade ores should be avoided.
Metallurgical sampling and testing must commence early in the mine value chain and certainly during advanced exploration. Initial testing will be bench-scale tests (e.g. single- or 3-stage GRG methods; <150 kg), progressively moving to pilot (>150 kg) and trial (>1 t) programmes at the pre-feasibility or feasibility study stages. In low-grade coarse gold-dominated mineralisation, trial processing is a best practice risk reduction step.
Sample types
Samples best suited to GRG testing are either large diameter diamond drill core (e.g. HQ or PQ) or chip-panel samples from underground or surface exposure.
During drilling it is possible for gold and/or gold-sulphide particles to be lost, thus providing a negative gold bias. The same effect can also occur when core is cut in half, where the cut section is effectively lost (up to 15% of the core) and gold particles may be plucked during cutting. The use of whole core samples is recommended where possible.
Composite and variability samples
Composite samples are often required to achieve the masses required for GRG testing. Composites should represent a given domain and comprise samples from intersections within that domain. By definition, composites smooth variability and may not show the true picture.
Variability samples are individual samples taken across a domain to investigate variability. Where possible, variability samples are preferable. For large samples (>100 kg), this can be difficult without compositing. High GRG deposits often comprise relatively narrow (<6 m) mineralised zones. Solutions to achieving larger sample masses are:
drilling a series of close-spaced (<5 m apart) large-scale diamond holes to allow the collection of a local variability ‘composite’
collection of samples from underground development and/or surface pits, trenches or shafts.
Composite or variability samples should aim to match the likely underground mining width or open pit bench height.
Maintaining sample representivity
Optimisation of sample mass depends upon project stage. At an early stage it is important to understand the field in-situ mass to achieve appropriate precision. Theoretical field sample mass can be estimated via the Poisson approach (Dominy et al. 2010).
Once broken or crushed rock (e.g. from a stockpile) requires sub-sampling, then the fundamental sampling error equation can be applied (Pitard 1993). Some GRG programmes collect field samples of an appropriate mass, but are sub-sampled after crushing to achieve a standard test sample mass (Fig. 2). In the style of gold mineralisation presented here, such splitting may require sub-samples that are above the field sample mass to achieve acceptable precision.
Bias is generated from poor practice during sample collection and laboratory treatment through the proliferation of the sampling errors. These errors can be controlled by rigorous quality assurance/quality control procedures.
Case study
Introduction
A study was undertaken at the Gwynfynydd (Wales, UK) underground mine. The operation extracted 15 000 t of ore per annum at a head grade of 15 g t−1 Au. Mineralisation is characterised by a number of quartz veins, where most of the gold occurs in very high-grade pockets locally up to 300 g t−1 Au. They are located within an oreshoot showing a low-background halo grade of 2–4 g t−1 Au ranging up to 6 g t−1 Au. Approximately 85% of the ore was attributed to the background mineralisation. Both high- and low-grade ore types are dominated by coarse gold.
Methodology
Face sampling and testing
A 20 m section of development drive was sampled. Each of nine faces was consecutively chip-panel sampled five times to collect 10, 25, 50, 100 and 250 kg samples. The tenth face had only 25 and 100 kg samples collected.
All face samples were SGRG processed on-site. They were jaw-crushed to −6 mm; ball-milled to −250 μm; and a concentrate produced using a 7·5 cm Knelson concentrator. Concentrates were sent to a commercial laboratory where they were fire assayed to extinction. Tailings samples were assayed to provide a back-calculated head grade. Concentrator operating conditions and feed rates were kept constant across the different sample sets.
Bulk sampling processing
Each sampled face was blasted to yield between 15 and 17 t ore. Ore was trammed to the underground plant and fed into a jaw crusher. Output from the jaw crusher was fed to a cone crusher to yield a product of −8 mm. The cone crusher product fed a rod mill, which yielded a product of P80 −500 µm. This passed into a trap to recover very coarse (>1 mm) gold. The trap concentrate was composited over a shift and then cleaned on a Wilfley table. Overflow from the trap was then pumped to a 1 mm vibrating screen. The oversize was returned to the rod mill and the undersize fed to two in-series 30 cm Knelson concentrators. Concentrates were upgraded via Wilfley table, prior to acid cleaning and smelting. Tailings samples were collected to allow the calculation of a head grade. Concentrator operating conditions and feed rates were kept constant for all bulk samples.
Results
Data from all samples show the clear under-call and variability of SGRG results compared to the plant (Table 1 and Fig. 3). The reconciled bulk sample head grade, comprising recovered gold and tailings assays, is accepted as the true value of each development round (Table 1).
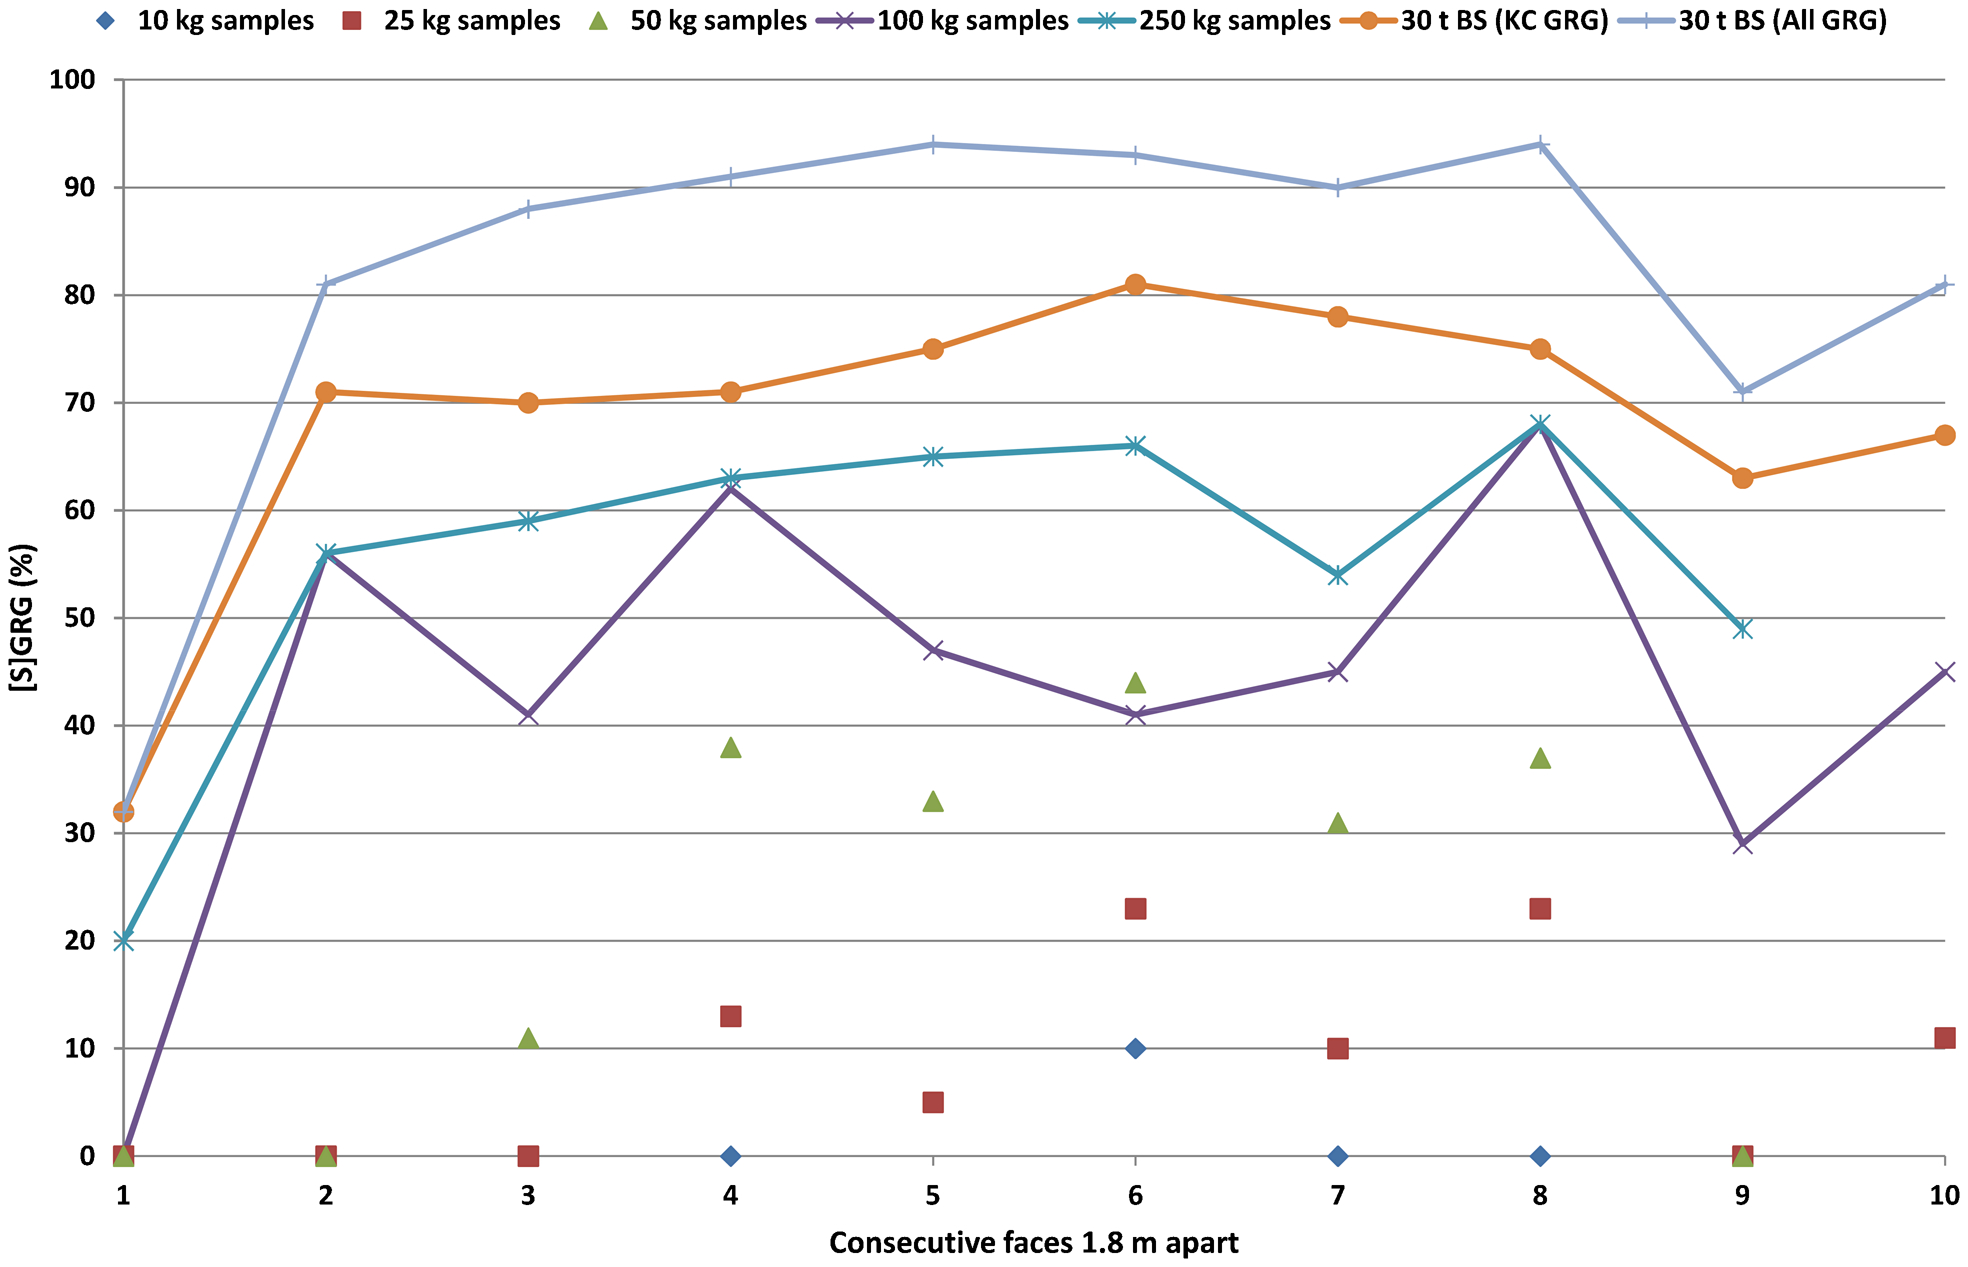
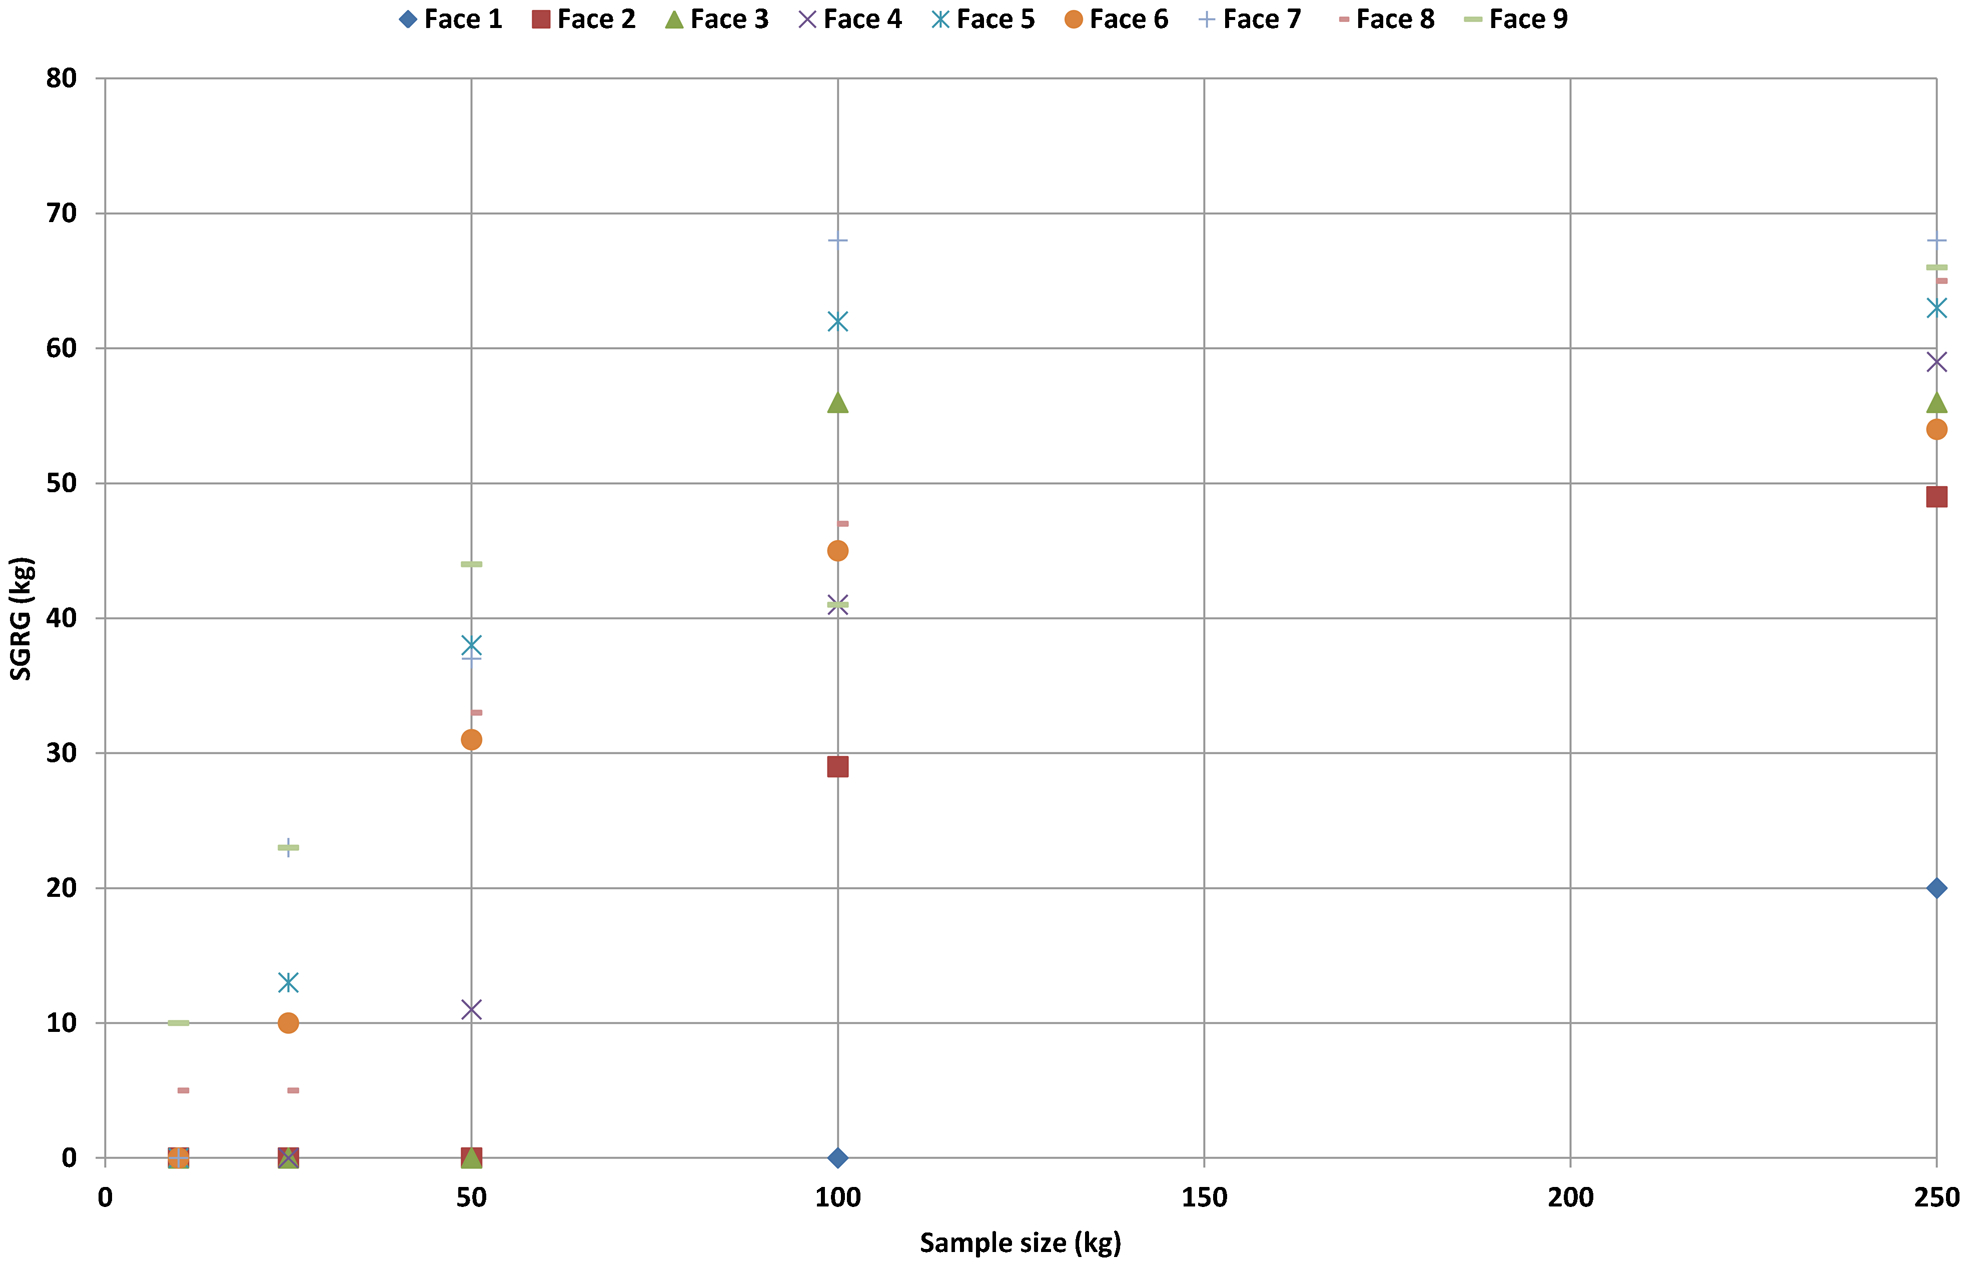
Plot showing variability of SGRG over 10 consecutive faces. Trace lines shown for 100 kg, 250 kg, BS (KC GRG) and BS (All GRG)
Summary of SGRG results
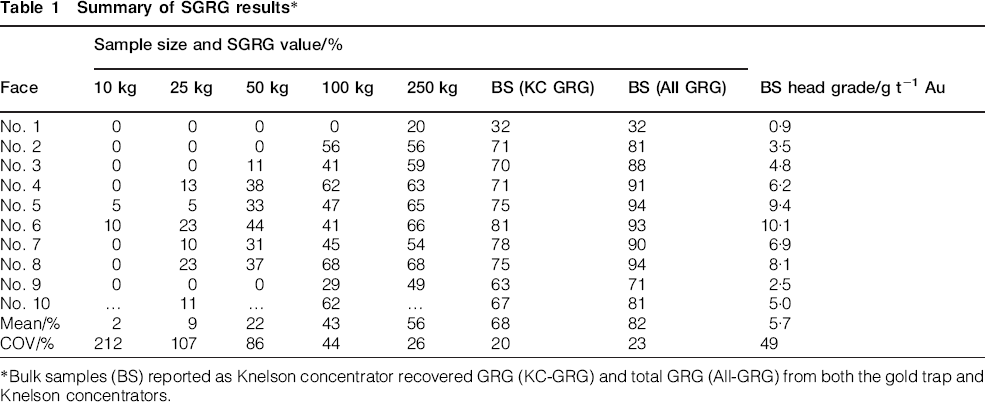
Bulk samples (BS) reported as Knelson concentrator recovered GRG (KC-GRG) and total GRG (All-GRG) from both the gold trap and Knelson concentrators.
The bulk sample Knelson GRG values range between 11 and 22% (mean 17%) below the full bulk sample GRG results (Fig. 3). The 250 kg samples broadly track the bulk sample Knelson GRG results, but are generally 9 to 38% below them. Samples below 250 kg in size show strong variability and under-call of bulk sample Knelson GRG. Bulk sample recoveries of >80% are observed at grades >4 g t−1 Au, which is consistent with routine processing (Fig. 4).
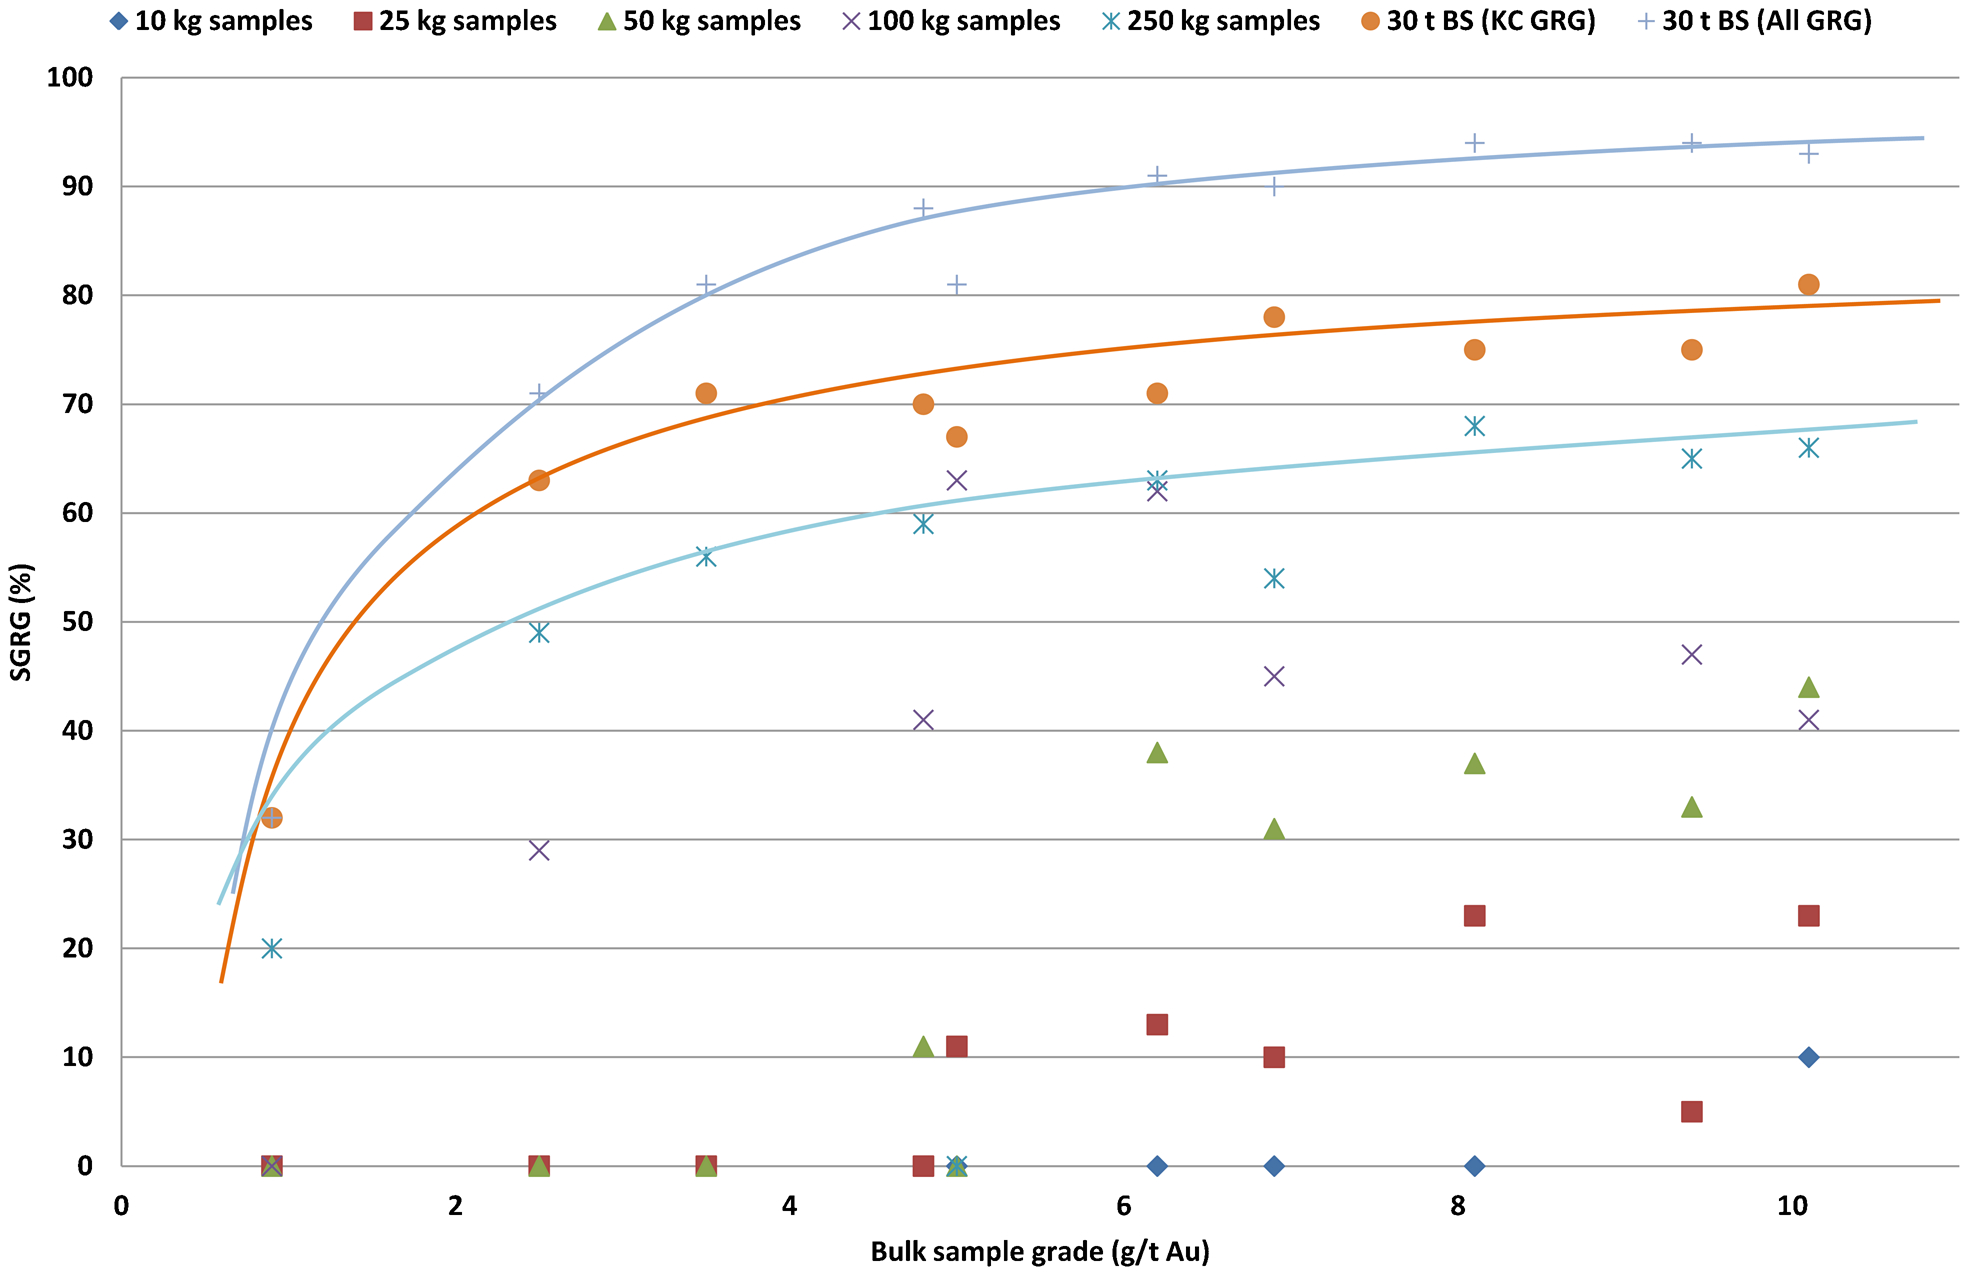
Plot showing variability of SGRG with bulk sample grade. Grade-SGRG trend curves for 250 kg (light blue), bulk sample Knelson GRG (orange) and all bulk sample GRG (grey–blue) data
Low grades (<2 g t−1 Au) resulted in a recovery of <65%, reducing to <50% for <1 g t−1 Au. Recoveries below 2 g t−1 Au are variable, with routine plant operation showing values of 50–70%. The bulk sample Knelson concentrator GRG tracks below the full bulk sample GRG, and relates to the removal of coarse gold into the gold trap prior to the Knelson circuit. This difference reduces below 4 g t−1 Au, where the quantity of very coarse gold reduces.
The smaller 10, 25 and 50 kg samples grossly understate bulk sample GRG (Fig. 5). The smallest 10 and 25 kg samples show the lowest GRG values, including a number of zeros. These small samples have a low probability of picking up gold particles.
Plot showing SGRG value variability and range with sample size
Gold particle sizing
Gold particle size distribution and degree of clustering was investigated through field observations, mineralogical studies and screening of SGRG and bulk sample concentrates (Figs. 6 and 7). X-ray computed tomography confirmed the presence of clustered gold particles in hand specimens. The key gold particle size metric from these studies is the liberation diameter and cluster diameter (Dominy et al. 2008, Dominy and Platten 2007), which are used in sample mass optimisation calculations.
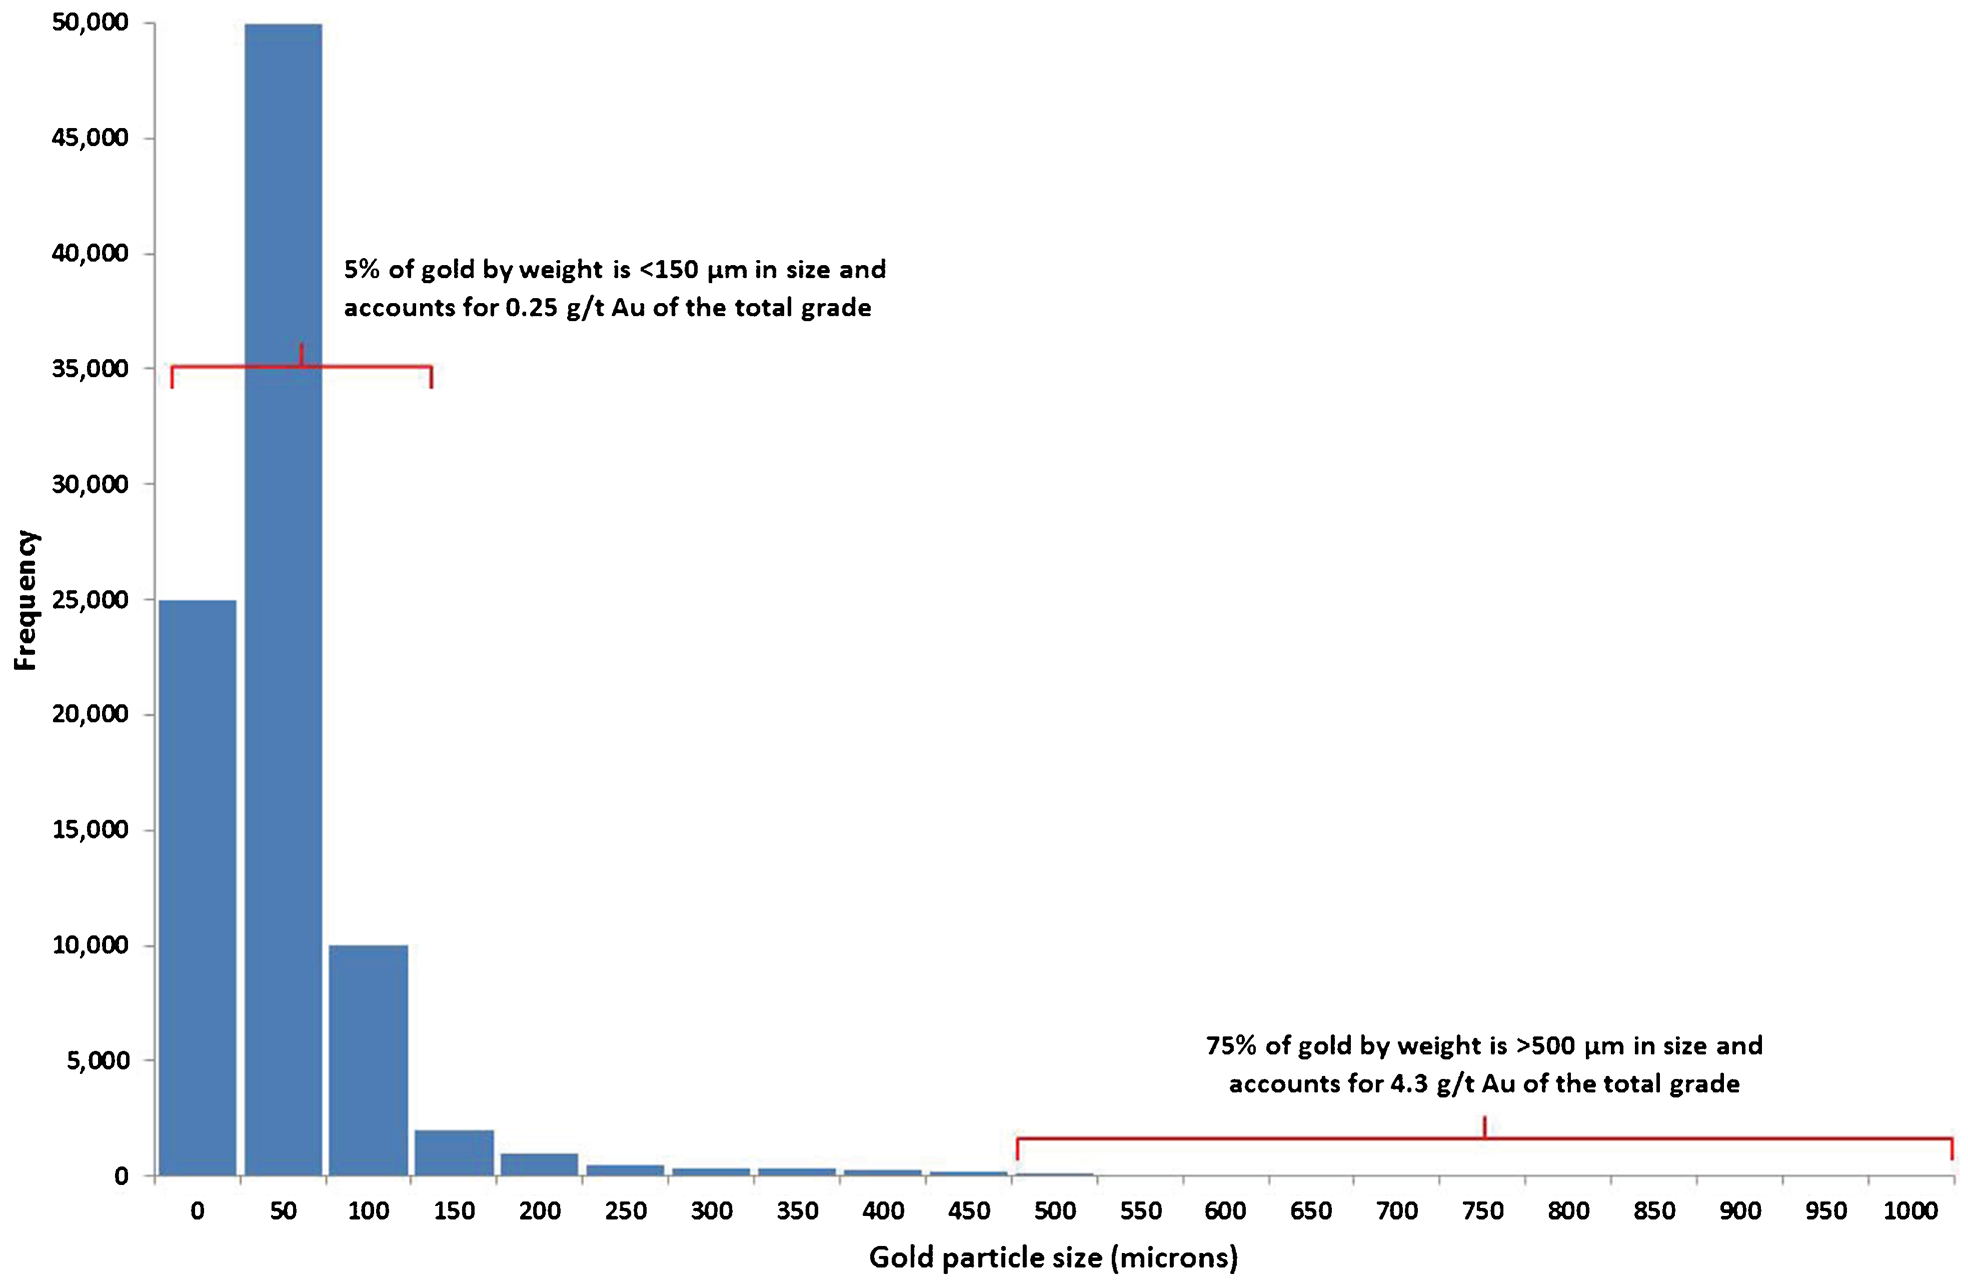
Histogram of theoretical gold particle size distribution for 6 g t−1 Au background ore. Assumes all particles as liberated
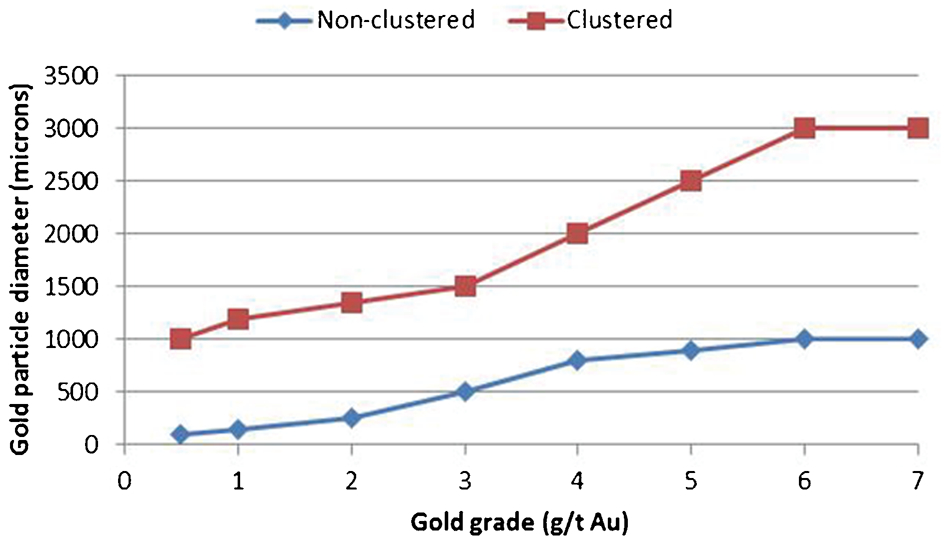
Relationship between gold grade and non-clustered vs clustered liberation diameters for low-grade mineralisation
The low grade background mineralisation is dominated by coarse gold (Fig. 6), which typically clusters (Fig. 7). Distribution of the <150 μm fine gold is relatively disseminated. There is a general relationship between gold particle size and grade, which is overprinted by the degree of clustering (Fig. 7). Clusters up to 3 mm equivalent spherical diameter comprising particles ranging from 100 to 1000 μm in size are common, particularly at grades above 4 g t−1 Au.
Determination of the liberation (or cluster) diameter allows the theoretical field sample mass to be estimated using a Poisson approach. For background ore, this provides variable sample masses depending upon grade and degree of clustering (Table 2). The equivalent cluster diameter is taken as the liberation diameter in mass optimisation calculations (Dominy and Platten 2007).
Theoretical maximum in-situ sample mass to yield precision of ±20% (90% confidence level) across range of grades and clustered/non-clustered liberation diameters. Refer to Fig. 7. Clustered data most appropriate for Gwynfynydd low-grade background mineralisation
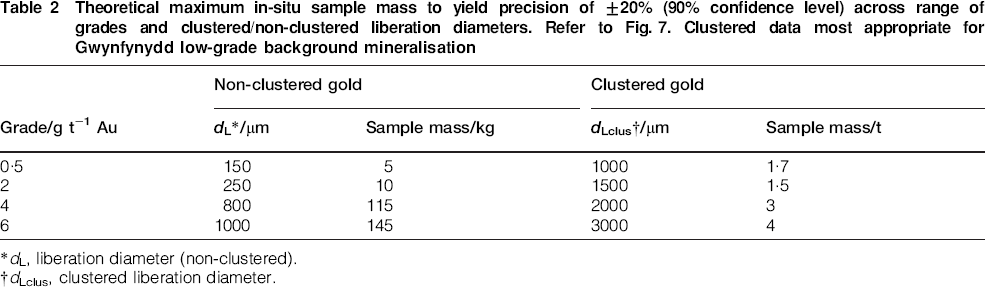
dL, liberation diameter (non-clustered).
dLclus, clustered liberation diameter.
Pilot sample and stope processing
Based on sample mass optimisation (Table 2), six 3 t pilot samples were collected from stopes immediately above and below the original test area. Samples were composited from surface stockpiles using a small loader. They were processed at an external laboratory as a series of 500 kg sub-samples via an SGRG test using a 17·5 cm Knelson concentrator. The samples were split by fractional shovelling after crushing to −1 cm, which imparts a degree of mixing. Samples were crushed in a rod mill to P80 −250 μm for the test. The results for the six 500 kg sub-samples were recombined to provide a SGRG value for each 3 t sample (Table 3).
Pilot plant test results
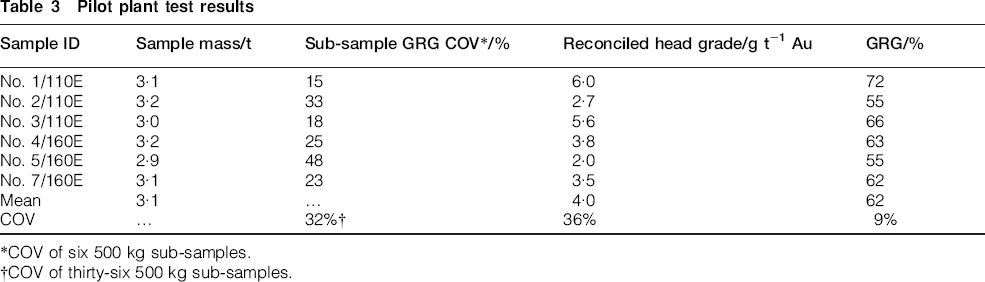
COV of six 500 kg sub-samples.
COV of thirty-six 500 kg sub-samples.
Whereas there is expected to be some scale-up issues between results from the different Knelson units, the 3 t results yield SGRG values closer to expectation (between 60 and 75%) compared to the original small mass SGRG results (Table 3).
Splitting of the 500 kg sub-samples after crushing from the 3 t field lots yields a fundamental sampling error of ±70% (at 90% confidence limit) per sample. This is high and reflected by the sub-sample grade COV of 88%. The grade COV for the six 3 t lots is lower at 36% (Table 3), indicating improved precision and thus a more representative sample. The GRG COV of the 3 t lots is 9%.
Following the test programme, stoping continued above and below the original development. Two stope batches of 200 t were reconciled to the previous samples (Tables 4 and 5).
Comparison of pilot sample test results with processed stope batches
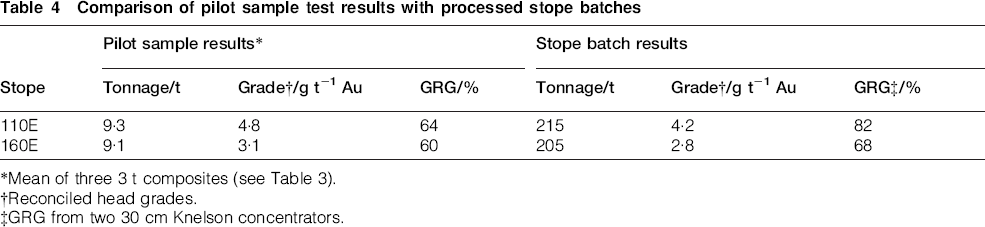
Mean of three 3 t composites (see Table 3).
Reconciled head grades.
GRG from two 30 cm Knelson concentrators.
Summary of mean and COV for GRG and grade results across face, pilot and bulk samples, compared to stope results*
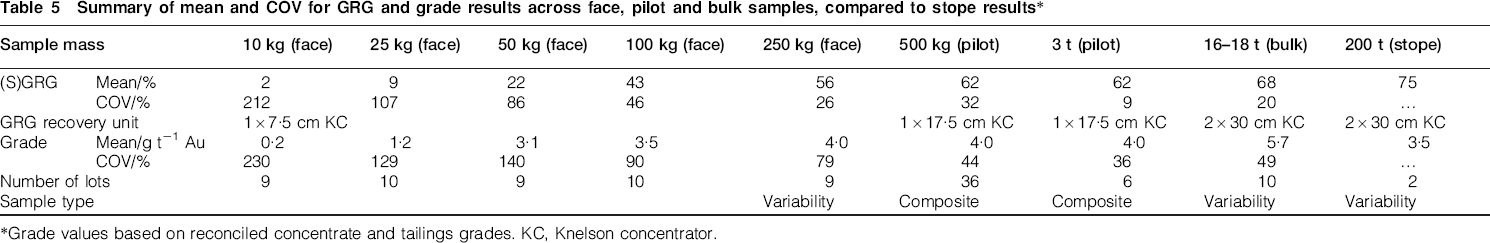
Grade values based on reconciled concentrate and tailings grades. KC, Knelson concentrator.
The pilot and bulk samples provide the closest prediction to production stope results (Table 5). They still understate plant GRG, though this can be explained via the recovery of very coarse gold in the plant gold trap and the inherent heterogeneity of the ore type. The 3 t pilot samples show a lower COV than the 16–18 t bulk samples, which is likely explained by the fact that the pilot samples are composites.
Discussion
In low-grade coarse gold-dominated mineralisation, small samples are unlikely to be representative. The 10 to 100 kg samples show poor precision for GRG and grade, indicating low representivity (Table 5). Only the 250 kg samples show a GRG COV close to the target 20% (Table 5). The 250 kg samples understate the bulk sample GRG by 18% and the 100 kg samples by 37%. The composite 500 kg pilot samples show the most improved performance, based on their greater mass and blended nature.
Analysis of grade is similar, where the COV is high (230%) for the 10 kg samples, dropping to 36 and 49% for the pilot and bulk samples (Table 5). Grade represents the actual gold content by weight and varies according to the spatial distribution and quantity of gold. By contrast, GRG is a measure of gold recovery by a Knelson unit after grinding. The GRG value is dependent upon gold grade, in-situ gold particle size, comminution method used and operation of the Knelson unit.
The results indicate that unsurprisingly gold grade is variable. Gravity recoverable gold is less variable since it is a physical methodology that recovers gold present in the sample. In this study, all Knelson operating conditions and feed rates were kept constant. Higher GRG is typical of higher grades (Fig. 4), given there is more coarse gold present. Gravity recoverable gold is also affected by sample mass, where the smaller samples do not contain a representative set of gold particles thus yielding a low GRG. The coarser more clustered gold particles are poorly represented in smaller samples.
Plant performance in relation to GRG test results relates to scale-up issues. Bench top equipment does not necessarily reflect production scale equipment. As a general rule, gravity recovery of 30–70% of the GRG is predicted (Koppalkar et al. 2011, Laplante et al. 2000). This difference relates to gold size distribution, recovery parameters, errors in estimating GRG (including sampling and test errors), and relating GRG to actual plant recovery (Laplante et al. 2000). Generally, the coarser the gold, the closer plant recovery will approach the test GRG content assuming representative sample masses (Laplante 2000).
Single-GRG tests using a range of different sample sizes were compared to the results of pilot plant and bulk samples. All samples were variability samples, with the exception of the pilot samples which were composites (Table 5). The differences in values reflect both sample support and scale-up issues. The SGRG results consistently understate the plant results. This is considered to reflect the issue of poor representivity in low mass samples and is supported by GRG grades, which understate the bulk sample grade (Table 5).
Grade and liberation diameter are used to optimise sample mass to achieve a nominal COV of ±20% or less. It has been demonstrated that grade, gold particle size and GRG are inextricably linked (Figs. 4 and 7). The lowest grade COV of 36% (GRG COV of 9%) was achieved with the 3 t pilot samples, and the 16 t bulk sample grade COV was 49% (GRG COV of 20%). The high grade-COV values exemplify the inherent heterogeneity of the mineralisation, but optimisation results in more representative samples that produce better quality GRG data.
Conclusion
The findings of this study are obviously predicated by the volume–variance relationship. However, the critical message is that the use of a standard GRG sample feed mass in low-grade coarse gold-dominated mineralisation is potentially flawed. Testing based on unrepresentative samples yields poor quality results that cannot be used to make sound economic and plant design decisions.
The case study demonstrates that:
If this test programme was undertaken as part of a new mine development study, sample masses of ≤50 kg would have negated the use of gravity recovery despite its applicability.
Consideration of gold particle clustering is important for sample protocol optimisation. It is demonstrated that clustering is as material for GRG as it is for grade sampling, requiring larger field and test sample masses. Gold particle size, degree of clustering and grade are correlated.
It is obvious that improved representivity is gained with larger samples. Those over 250 kg provided a strong indication for GRG potential, but still understated reality. The 3 t pilot and 16 t bulk samples provided the best GRG evaluation and verify the predicted theoretical sample mass.
Whatever sample mass used, the low-grade coarse-gold nature of the mineralisation always imparts variability due to its inherent heterogeneity. A pragmatic approach is required to achieve GRG test results that are reasonable and their limitations understood.
Sample mass optimisation requires an early characterisation step to determine the nature of gold particle sizing. A possible approach (Fig. 8) is an iterative process based on geological/mineralogical observation and physical testing (Dominy et al. 2010).
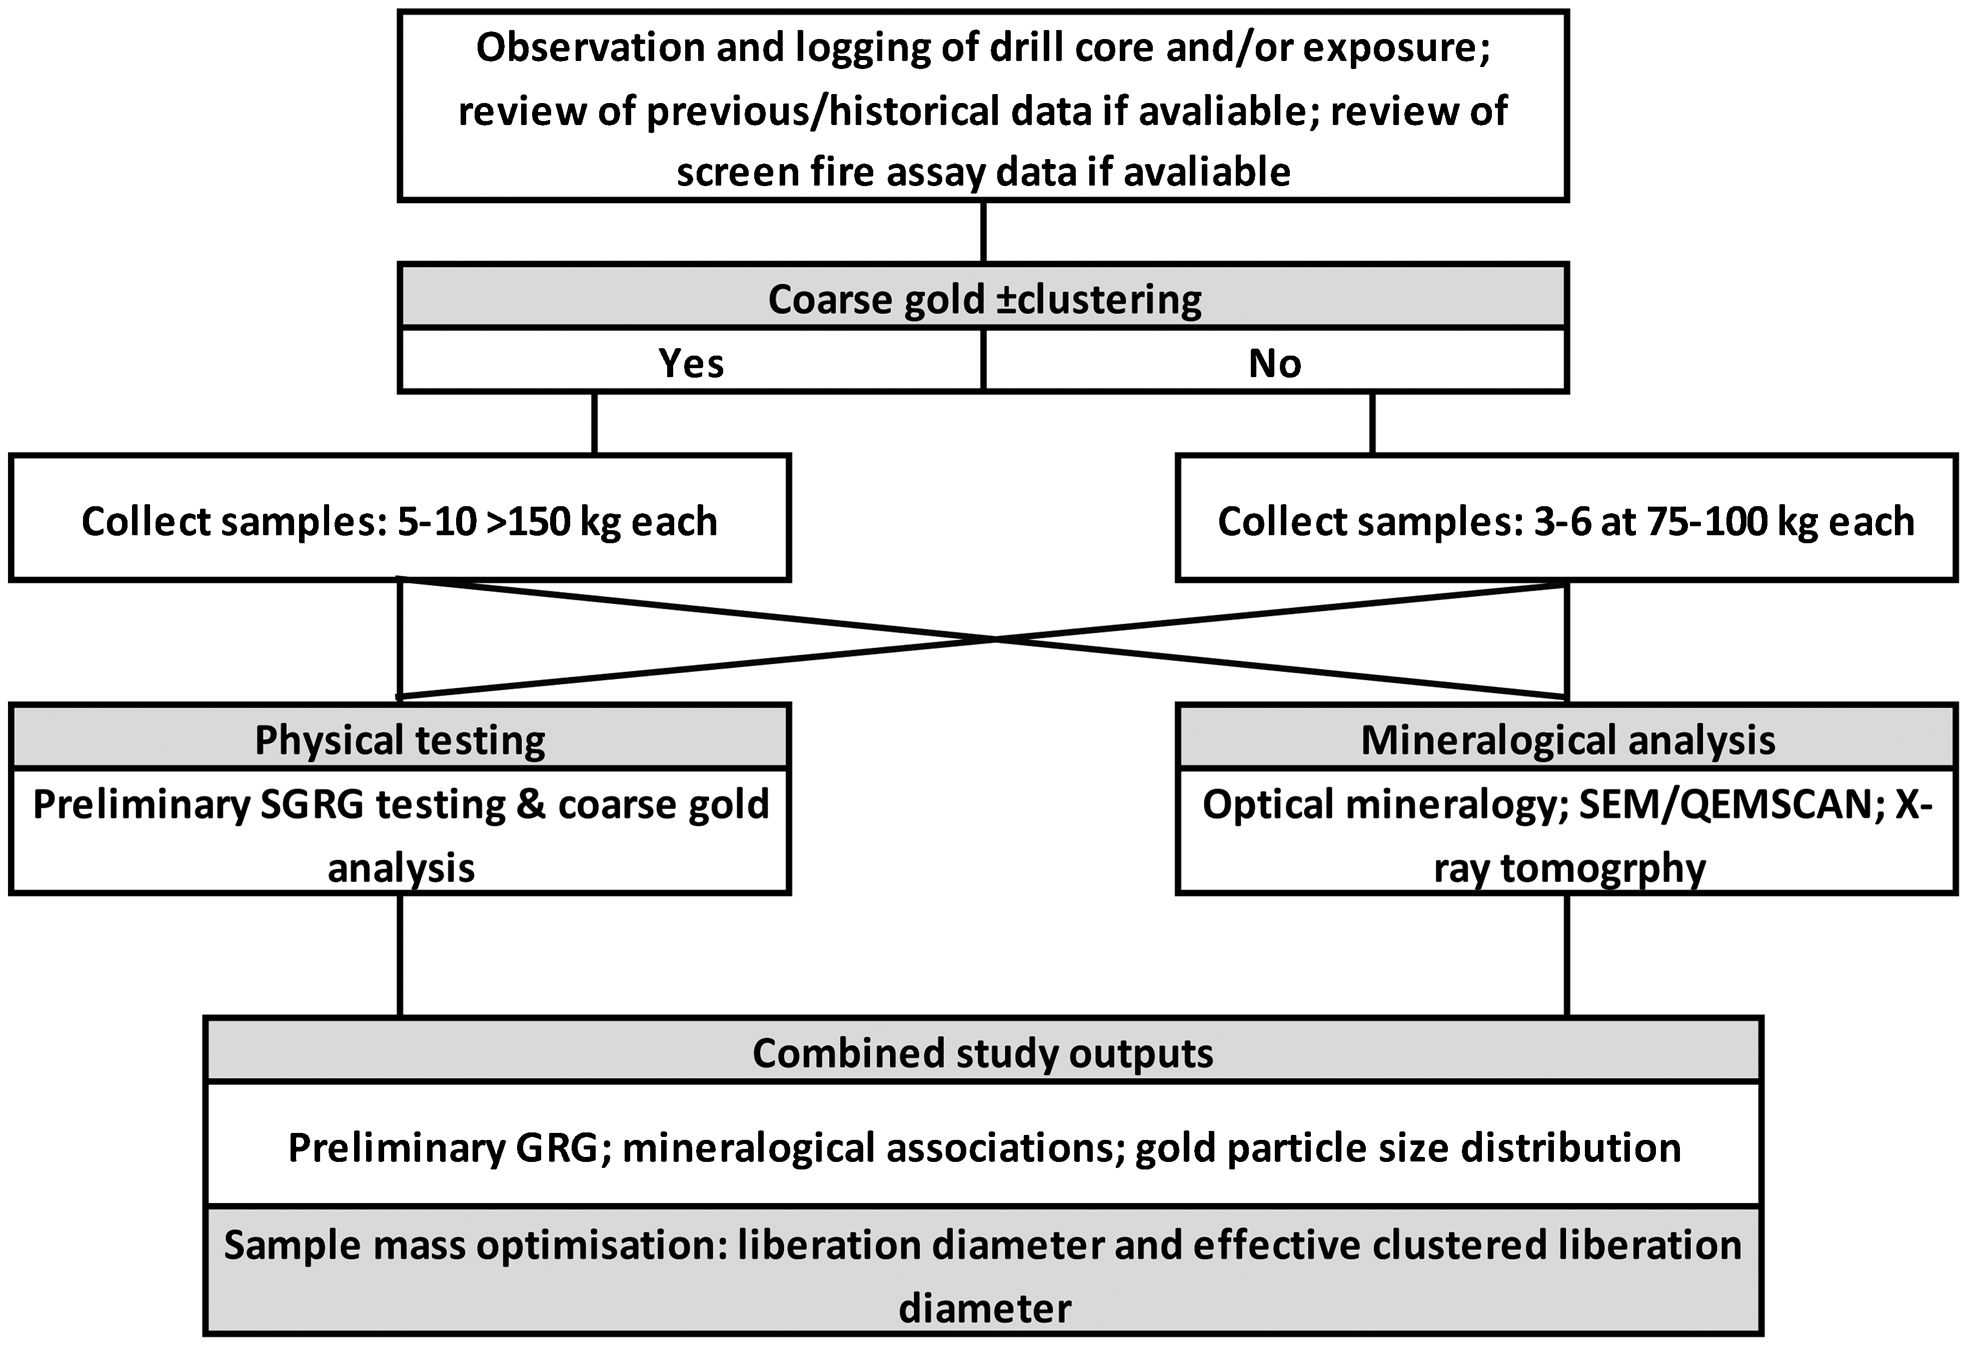
Flow sheet of early stage test programme to evaluate nature of gold particle sizing in new ore type
Samples must be collected and treated within the framework of the Theory of Sampling (Pitard 1993). Consideration of field versus test sample mass is critical. In many cases, a standard test sample mass is taken in the field and used in its entirety for the GRG test. In other cases, a field sample is collected, but sub-sampled to a standard test sample mass in the laboratory. This negates the potentially more representative field sample. The best option is to process the entire field sample to reduce sampling errors.
Trial mining to produce pilot test samples of >1 t will generally be required to verify GRG potential in low-grade coarse gold-dominated mineralisation (Dominy 2014).
Footnotes
Acknowledgements
This study was supported by Welsh Gold PLC and the University of Greenwich. AES reviewers are thanked for useful comments on the manuscript. This manuscript was originally presented at the AusIMM Geometallurgy Conference 2013.