
Abstract
Structure is the principal control on gold mineralisation, and the paradigms reflect the punctuated evolution of our understanding of that control. Since the 1950s, structure paradigms for gold control have been a mechanism for gaining research funding, building a public front, enabling publication, communication between government and academia, and building interaction between research groups and industry. Critically, the authors ask if the paradigms have helped us find and mine gold? The 10 paradigms discussed here are: (1) syngenetic (1950s–1980s), (2) late compression (1980s–1990s), (3) brittle strike-slip (1980s), (4) complexity (mid-1980s to present), (5) stress mapping (1990s), (6) earthquake paradigm (1990s–2000s), (7) detail and micro-detail in texturally chronological sequence (2000s), and (8) conglomerate-related (1990s–2000s). The most recent, innovative initiatives are more fluid- than structure-centric, such as the rapid energy transfer of the (9) lightning paradigm, and (10) the non-linear/disequilibrium paradigm. In this paper, the authors overview these paradigms, the critical geology that supports the paradigm and practical exploration implications. Authors confront each paradigm's premise and results with empirical facts in gold exploration. Our study indicates that the structural paradigms are more descriptive than predictive, and consequently few if any have genuinely found gold. However, many paradigms encourage structural geology and mostly produce quality science an essential component of all mineral exploration. Finally, the authors recommended a simple, critical, and knowledge-based modus operandi. In order to be successful in finding more gold, the authors emphasise the need for more, not less, structural geology and this should be early in the exploration program. An interpreted 3D image of the structural geology and mineralisation (not necessarily computer-generated, but based on high-quality information) is a critical tool from the earliest stages of exploration and mining for gold.
Introduction
In 1962, Thomas Kuhn in ‘The Structure of Scientific Revolution’ introduced the concept of paradigm shift. He explains that scientific progress is characterised by continually alternating phases of normal science and revolutionary science, with the latter known as ‘paradigm shift’. Normal science is about refining understanding and progressive development, whereas the major shifts and momentum of scientific progress are great conceptual breakthroughs (phases of revolution or shifts), which usually lead to a new paradigm. A paradigm places operating boundaries around a particular scientific discipline and provides the intellectual framework and language for its followers. A paradigm predicts phenomena of interest and adapts by applying necessary (minor) changes in order to answer questions. But, when a point is reached where it is not possible to provide an explanation of the differences between what is observed and what is predicted, a paradigm crisis occurs, which is usually resolved by replacing the old paradigm with a new one. This is paradigm shift.
Gold mineralisation is structurally controlled, with no other equal control (Conolly 1936; McKinstry 1948). Host rock chemistry, stratigraphy, and age are all considerably less efficient as a control of mineralised fluids transport and deposition of gold than structure (Conolly 1936; McKinstry 1948; Groves, Barley and Ho 1988; Colvine 1988; Kerrich and Feng 1992; Vearncombe 1998). Two contrasting summaries of this statement are given in the Figs. 1 and 2, showing multi-scale dynamics of the hydrothermal systems, and how at all scales, structure controls the processes and location of gold mineralisation (Hobbs and Ord 2012).
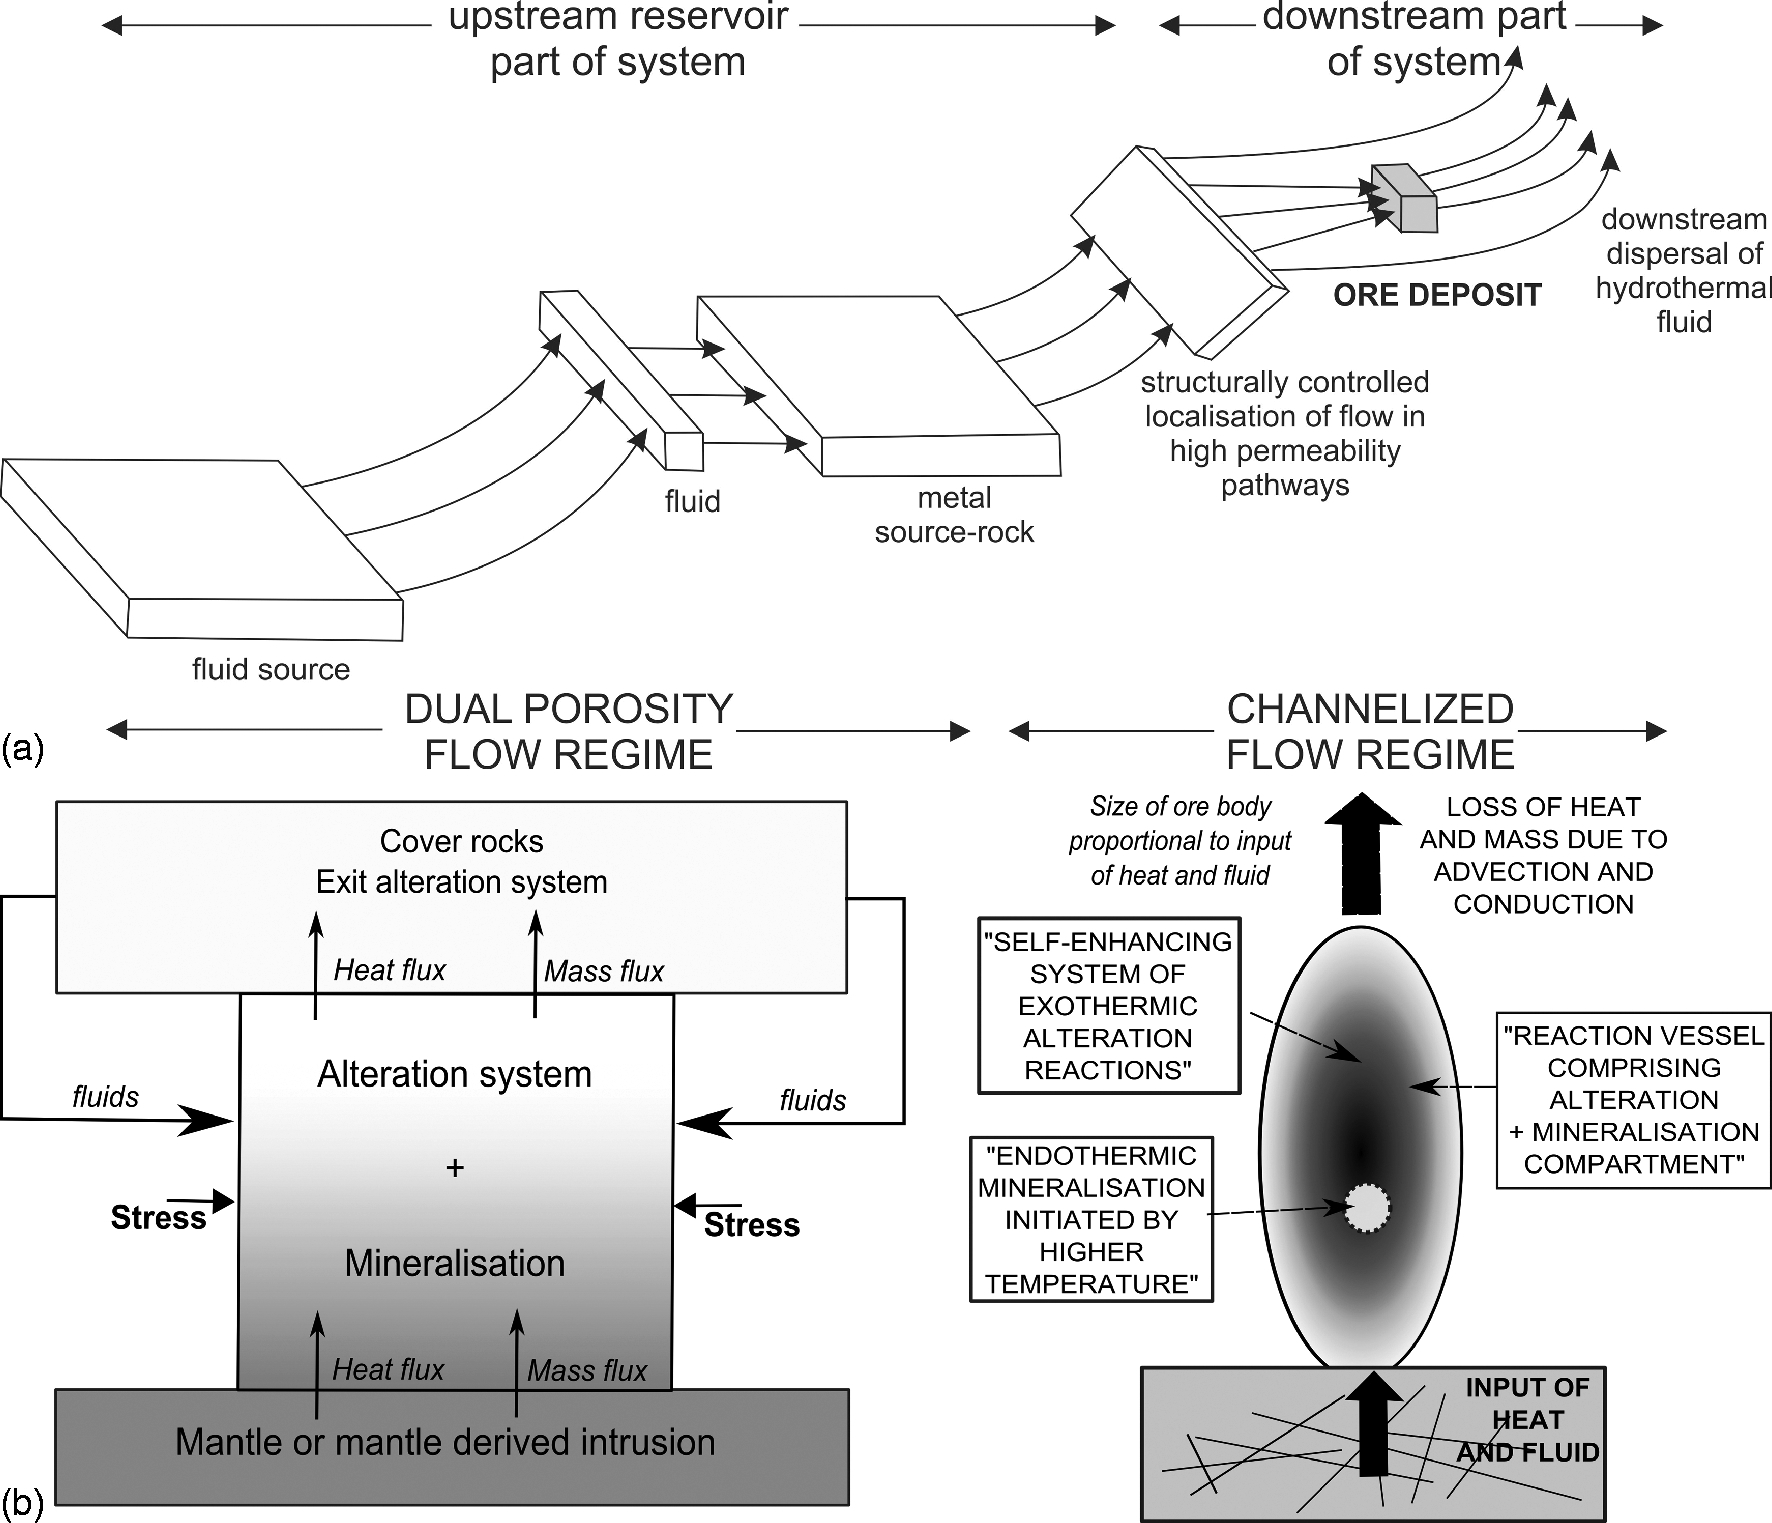
a Schematic flow-through model, illustrating principal components of the hydrothermal ore system. Modified after Cox (2005); b schematic models of hydrothermal systems as open flow chemical reactors, maintained in dis-equilibrium (i.e. long-living) by the influx of mass and heat energy (from Ord et al. 2012)
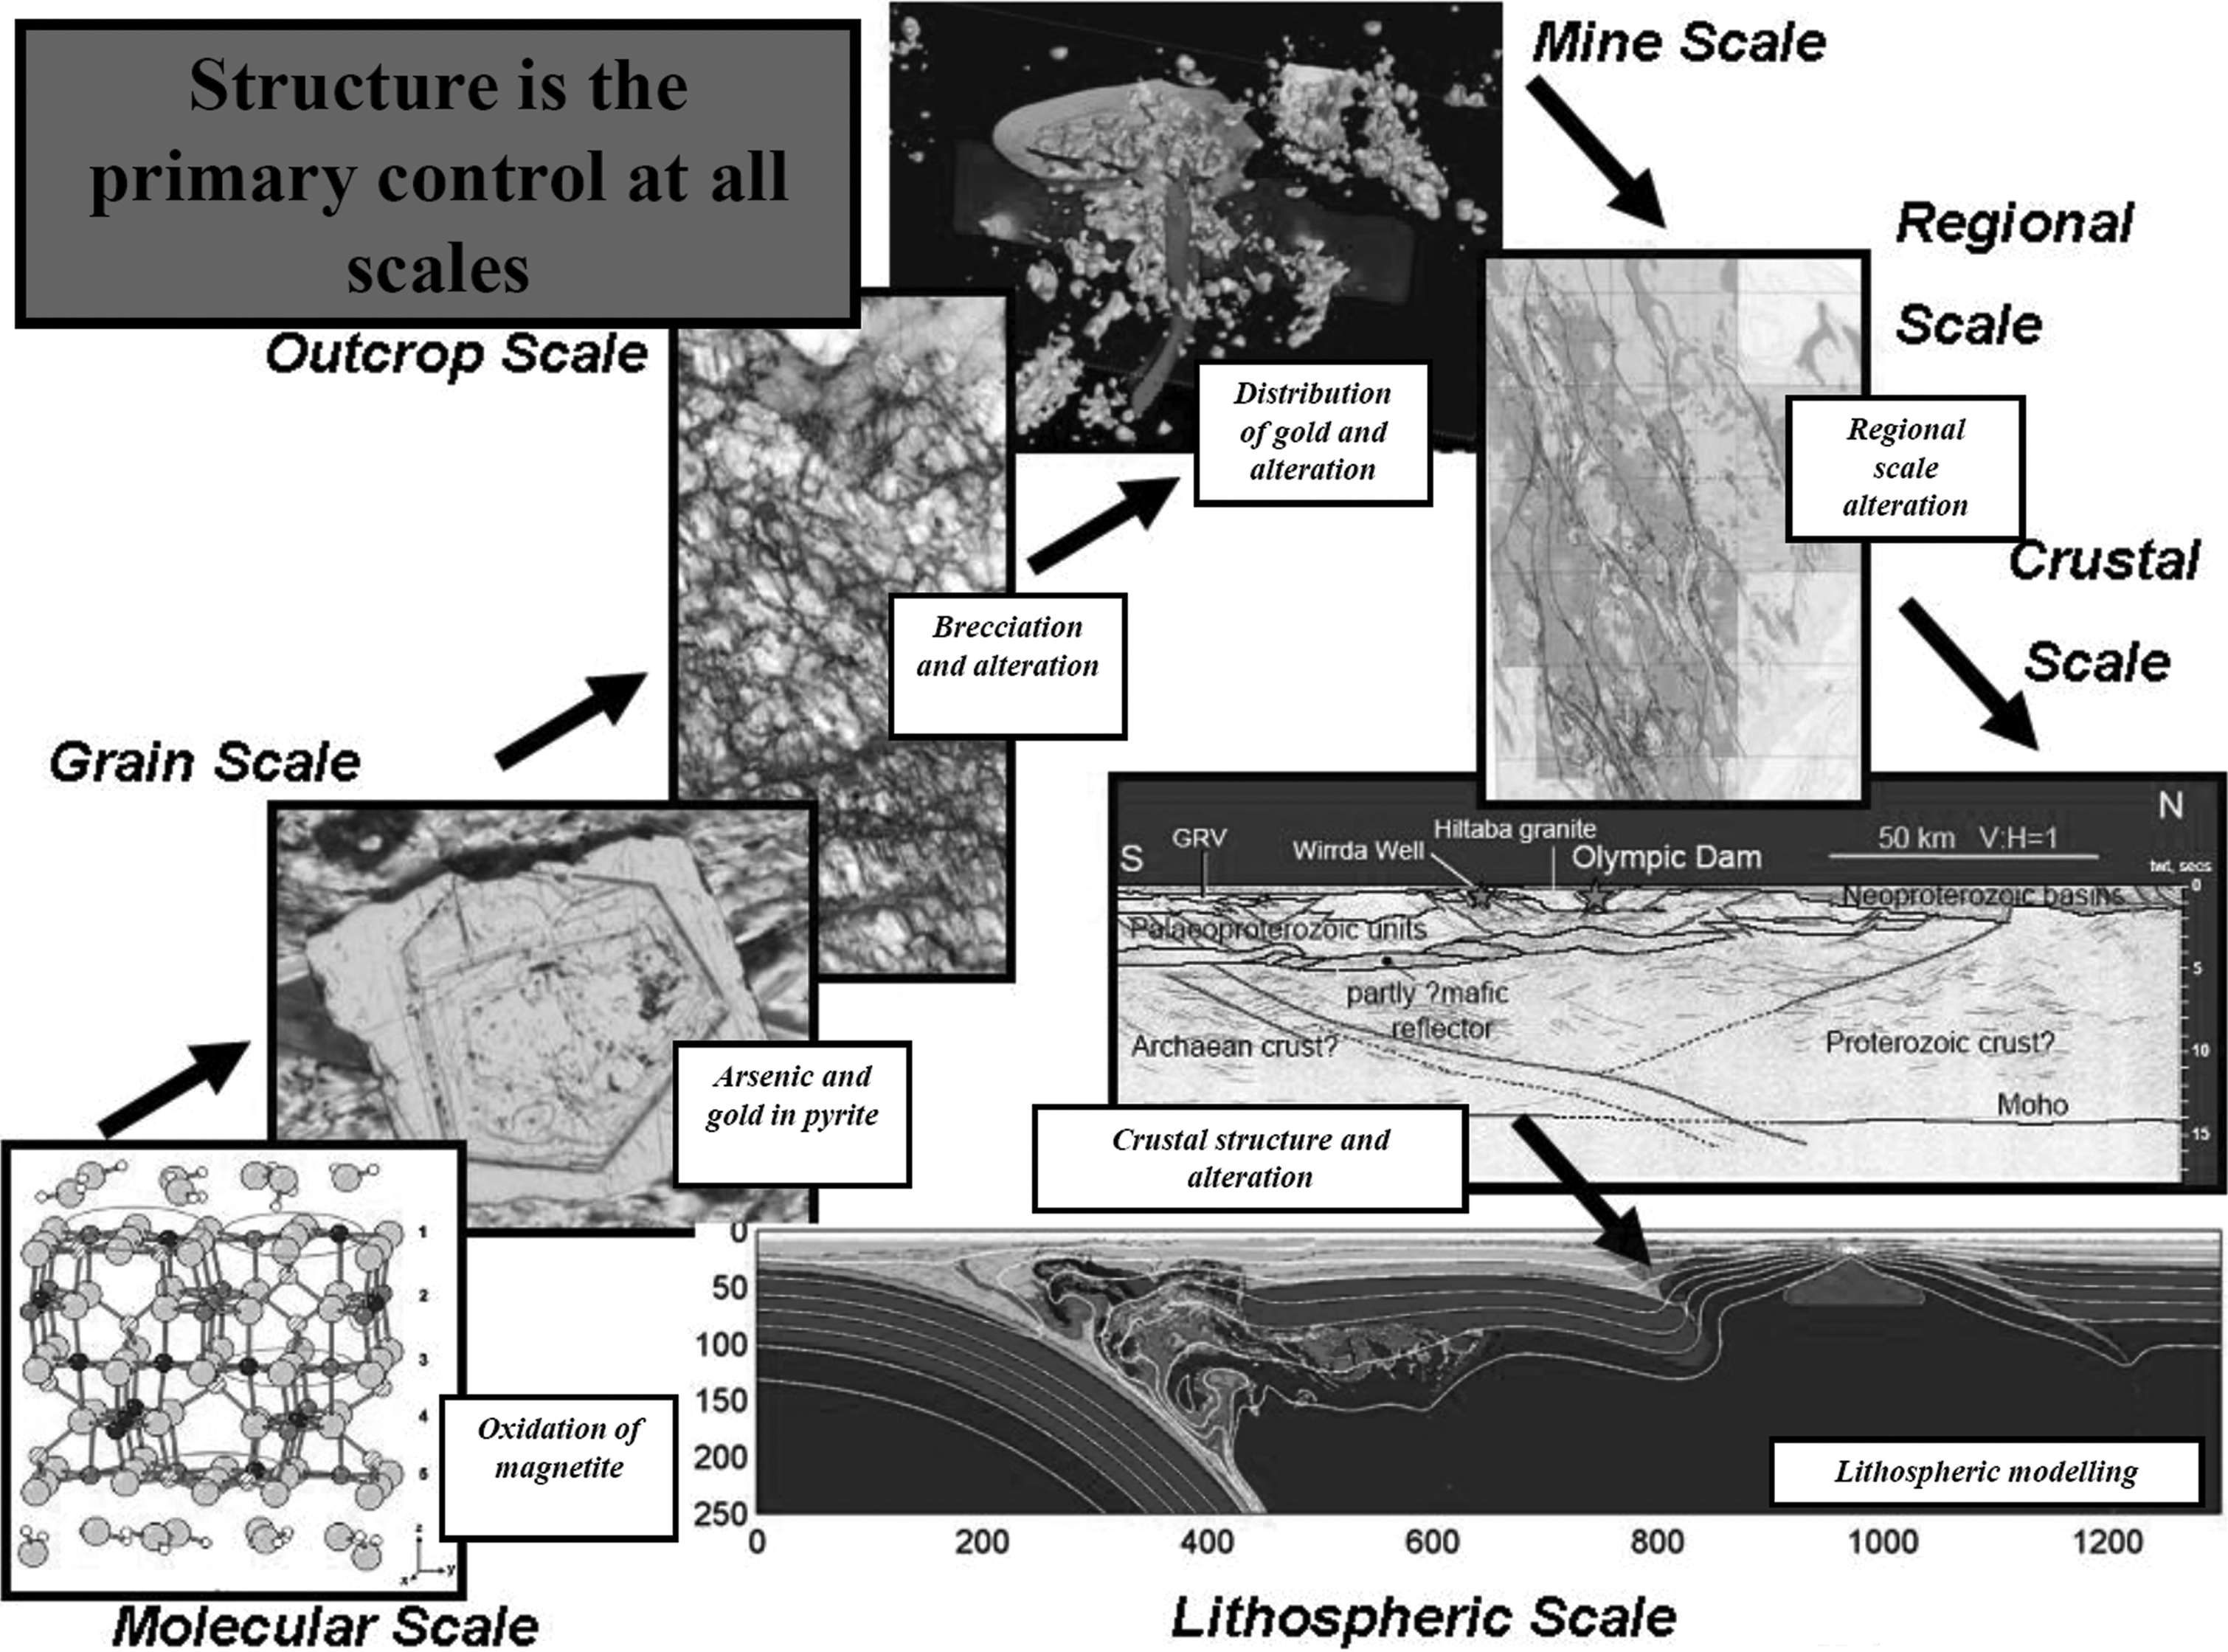
Schematic diagram of the hydrothermal systems multi-scale dynamics. At all scales, the dynamics of hydrothermal process is controlled and constrained by structures (from Hobbs and Ord 2012)
Since the 1950s, structural and mineral exploration paradigms have been a route for gaining research funding, building a public front, enabling publications, creating communication between government and academia, and interaction within and between research groups and industry. Each paradigm has a leading geological proxy or feature or set of features common to gold deposits. The paradigms discussed here are:
syngenetic (1950s–1980s) with fertile stratigraphic horizons as a critical proxy late compression (1980s–1990s) with gold in steep, late reverse faults brittle strike-slip (1980s) with gold in brittle fractures as predicted by the Riedel shear array complexity (mid-1980s to present) with gold preferentially found in the most complex structure and rheology positions stress mapping (1990s) with gold in low stress sites earthquake paradigm (1990s–2000s) with gold mineralisation processes equated to those during an earthquake detail and micro-detail in texturally chronological sequence (2000s). Strictly speaking, this is not a paradigm being more a philosophical approach to structural geology conglomerate-related (1990s–2000s), where the gold mineralisation event is related to unconformity surfaces, being either just below or above the unconformity lightning paradigm (recent), an extension of the earthquake paradigm recognising that the ore zones are long linear ruler shapes, and non-linear/disequilibrium paradigm (recent), mineralisation is a product of dis-equilibrium processes needing the constant supply of energy into the system evidenced by breccias and laminated veins.
The major conceptual difference between paradigms and models is that the paradigms can be defined as a framework containing the basic assumptions, ways of thinking, and methodology that are commonly accepted by members of a scientific community (Kuhn 1962). A model is an evolving representation, typically on a smaller scale than the original. Models may be a product of the paradigm. Models are representations of the reality, whereas the paradigms are the established reality by itself. Models are designed to be modified by innovation and improvement, whereas facts outside a paradigm are usually not visible, because they do not match the reality given by the paradigm. However, when the problems are visible and important, they usually cannot control the modification of the paradigm. A paradigm builds a specific language within its intellectual framework, which is not always understandable to the members of the scientific community outside the paradigm or the wider public. Thus, publication of scientific papers and interaction with the government and industry usually forces the followers of the paradigm-group to adapt the specific language and explain it to the wider audience. It must be noted that some of the structural paradigms presented in this paper may be better placed as models, but most of them are, or have been accepted and exploited as paradigms during a specific period in the (modern) history of exploration for mineral deposits.
This paper begins by outlining who benefits from structural paradigms for gold, why simplistic broad-scale models can often be disadvantageous, and the gold facts that credible paradigms must explain. Authors then overview 10 structural paradigms for gold mineralisation that have been used and developed from 1950s to the present. Finally, the authors recommend a stand back and think about its approach and methodology for the efficient exploration for gold.
The benefits of paradigms
Since the 1950s, structural geology and gold exploration paradigms have been marketed to discover new deposits or extend the existing ones. The final and common goals of all structural paradigms for gold should be to achieve one or more of (1) find new provinces, (2) find new large deposits and grow known deposits, (3) evaluate the shapes and distribution of grade within a Resource, or (4) mine at reduced costs. Given the scale variation of these demands, it is to be expected that some paradigms are better at one task relative to another. But are the paradigms successful and who benefits from them? In some cases, publications and communication within and between academic groups were the main achievement of paradigms. Many paradigms may not have discovered or extended gold deposits. In most cases, structural paradigms have been a route for gaining research funding, building a public front, enabling publications, training new geologists, creating communication between government and academia, and building interaction within and between research groups and our industry. Within the scientific community, clustered around certain paradigm and intellectual frameworks, members of the group think and communicate using a specific terminology, negotiate ideas (and they are doing that more or less diplomatically, and more or less successfully), and relate with other participants of the group. Original, out of the box thinking and original ideas are usually less common and come after political interests and power-relations.
First, new models and ideas provided by the paradigm should benefit the industry. The paradigms should provide a new framework of where to look next in the exploration of gold, and how to do it. However, their application and proposed set of techniques and methodology to discover new deposits or grow known ones are limited, being in most cases either too general or too specific. On the other hand, paradigm-constrained research helps geologists with a better understanding of the structures that they are working on. It is important to recognise that paradigms are both helpful and also a hindrance. For instance, they can help us understand aspects of complex geological detail, but they can also limit perception of a wider picture. They focus our attention to one specific set of controlling features, omitting others that may play an even more critical role in the formation of a mineral deposit.
Geological models developed during the exploration processes and/or research projects are almost always based on well-known facts, but often do not fit all observations in the field. Why? First, it is difficult to model earth and geological processes with their complexity given the language that the authors have available to represent and describe the reality (our mathematic apparatus remains primitive and is debated). Second, models are often built from and around a certain paradigm, which, as for all paradigms, describe, and consider an incomplete list of the aspects of geological reality.
Figure 1a illustrates a schematic and simplistic broad-scale model for a hydrothermal ore system, involving one fluid reservoir, metal-source (rocks) and ore deposit (Cox 2005). On a large scale, hydrothermal systems comprise an upstream region, where metals and fluids are derived, and a downstream region where metals are deposited, i.e. fluid source+metal source+transport+localisation+reaction gives you an ore body (Fig. 1a). Therefore, each individual segment of Cox's model is correct and facts presented in the model are known to be accurate. However, overlapping processes make this model far too simplistic when compared to reality. This is illustrated with the more realistic model of Hobbs and Ord 2012 (Fig. 1b) showing overlapping processes that are self-promoting and others are system destructive.
Structural controls on gold mineralisation, some facts
Before the emphasis on the variation between different paradigms, the authors here recognise a modest list of empirical facts applicable to all deposits and that may not be ignored when critically evaluating a new model or paradigm, and when exploring for gold. These are:
Fluid penetration of solid rock is slow even by geological standards and the evidence is that it does not occur over distances of more than centimeters. The phenomenally wide variety of mineralisation sites have little in common except being sites of low mean stress, controlled by stress field variations, local structure and rheology. Hydraulic head (the potential for fluid flow) is the control on fluid focusing, with pressures commonly exceeding the lithostatic gradient, as evidenced by recumbent extension veins.
Structure is unambiguously the principal control on gold mineralisation at all scales, constraining both transport and deposition processes of mineralised fluids creating high permeability structural pathways and constraining the deposition to structural positions. Given that gold deposition is controlled by structures, and the recent focus on structurally related exploration technologies (pmd*CRC, 2007-08), it may be expected that structure would play a critical role in successful exploration. There are many examples from Australia that show that all gold and hydrothermal deposits in general, are located on fractures, faults, shear zones or folds. Moreover, deposits sit on the areas of the most complex geology. They are commonly in V-shaped structural architectures (Phillips 1972). Alteration assemblages are usually strictly controlled by fractures, faults, shear zones and inherited (sedimentary) structures. A recent re-iteration that structure is the principal control on gold at all scales is provided by Hobbs and Ord (2012) and Ord, Hobbs and Lester (2012) (Fig. 2).
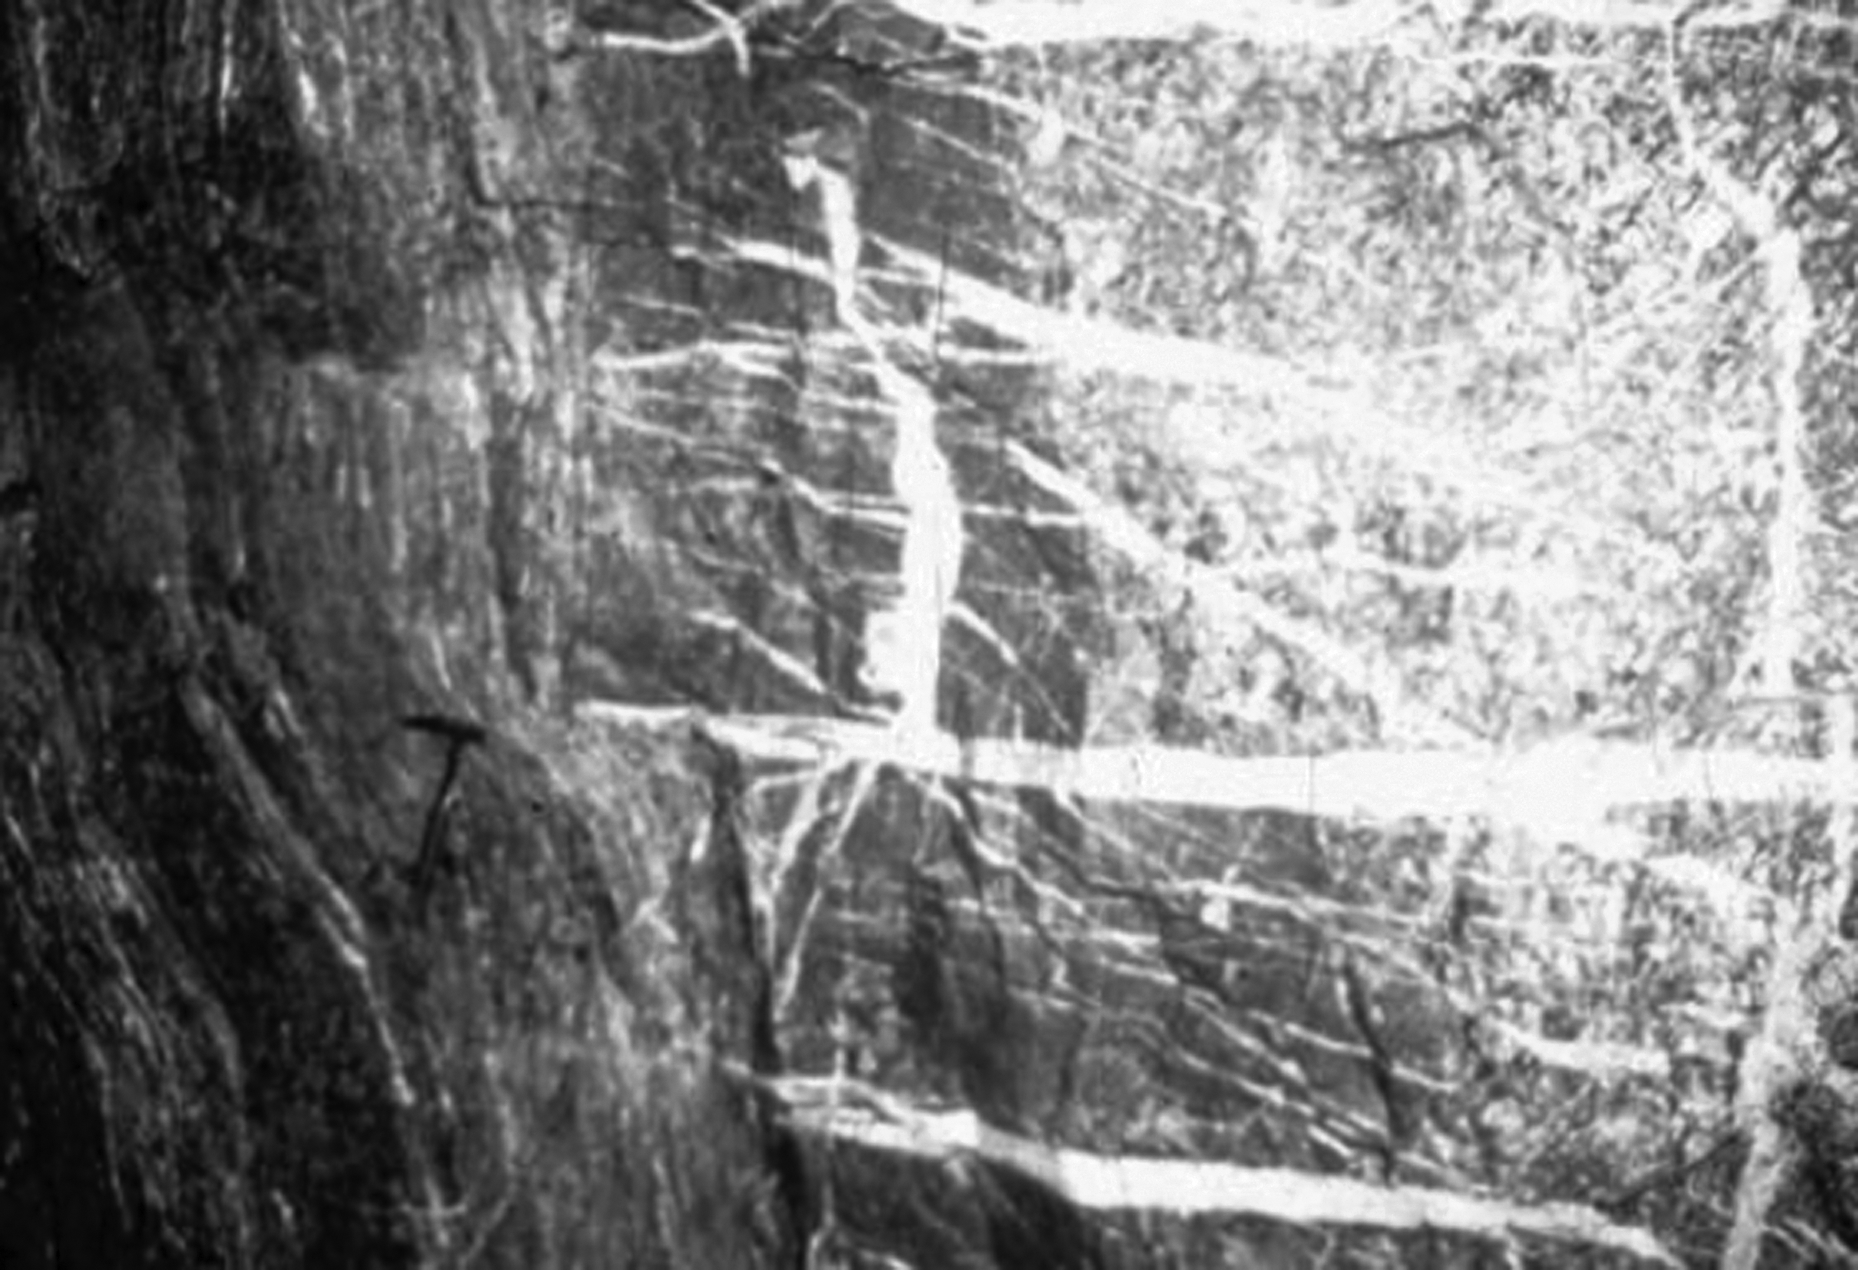
Empirical examples show that fluid flow and its alteration footprint penetrates into unfractured rock over centimetres only (Fig. 3). This observation is supported by the theoretic studies (Thomson 1987), showing that penetration of a fluid into solid rock requires timeframes that are unrealistic. The implication is that fluid does not flow through solid rock and for it to move through the crust and to access rocks to alter and mineralise requires faults and other fractures.
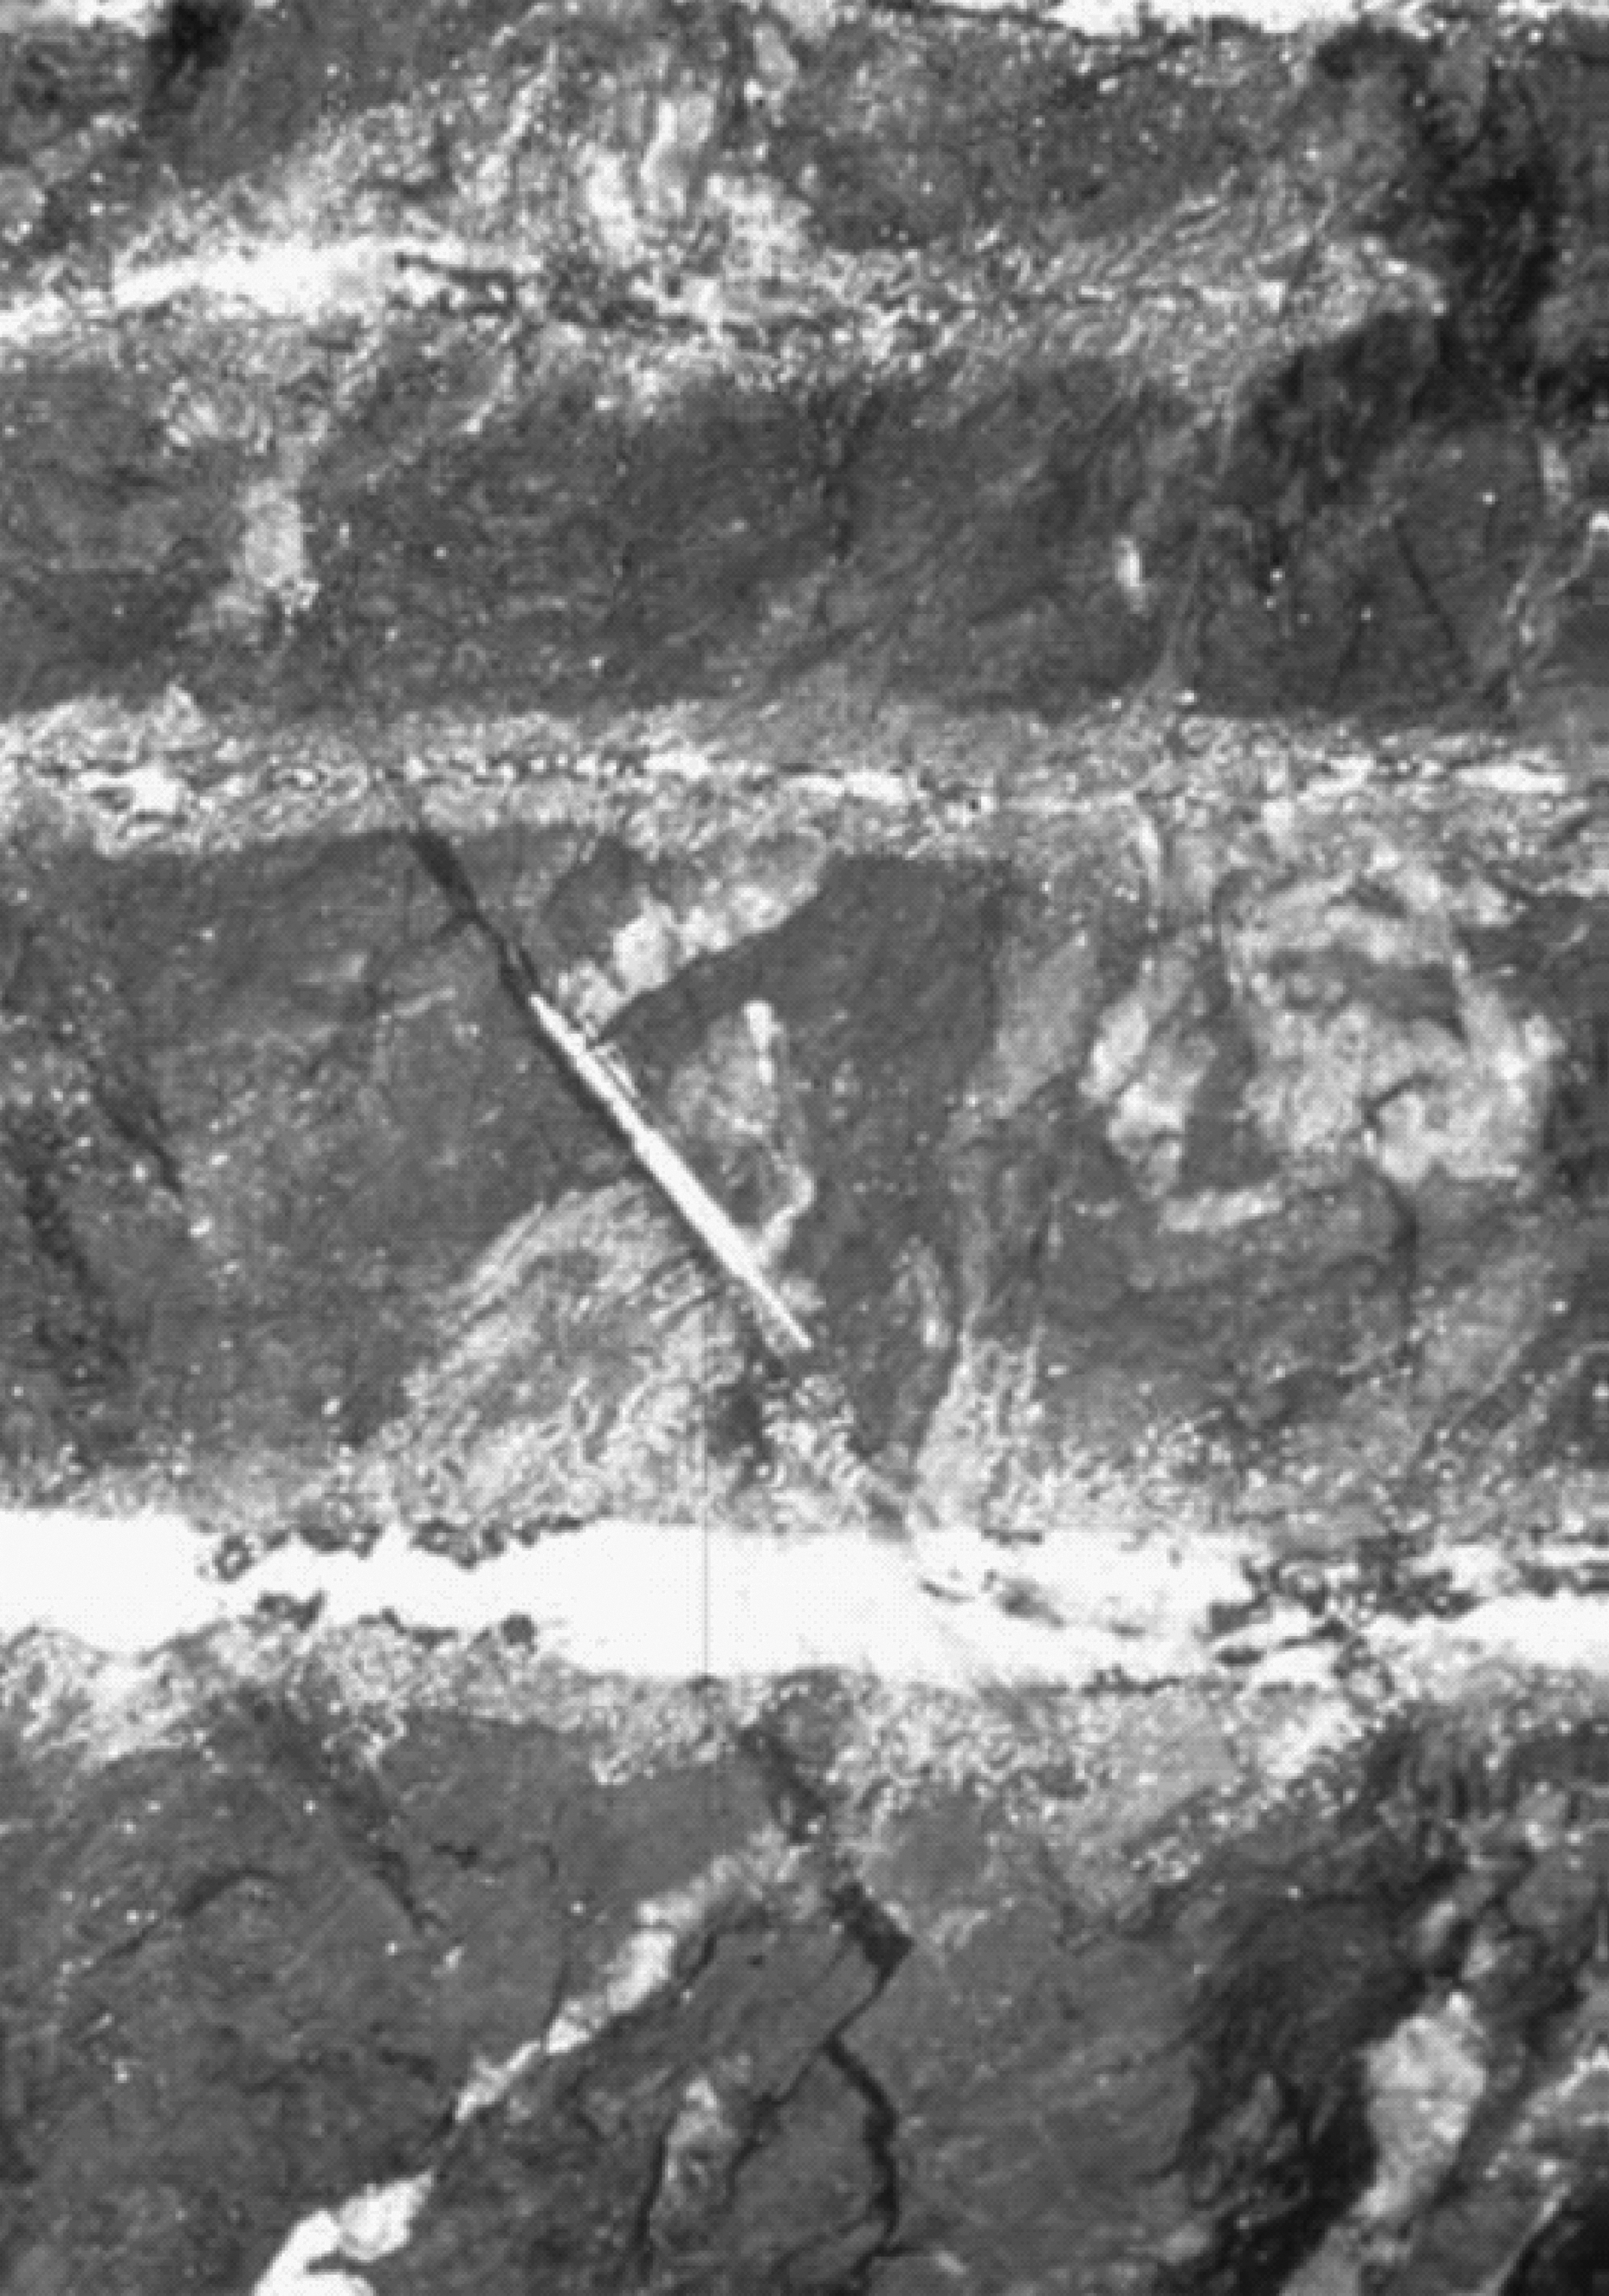
Alteration footprint within the host rock (silver colour pen for scale). The photograph from Victory Defiance gold mine Western Australia shows a narrow alteration halo measured in centimetres only around recumbent veins
A stunningly wide variety of mineralised positions and structures occur in nature. For instance, at Telfer Western Australia, the incompetent Middle Vale Reef (MVR) is mineralised in a strata-parallel shear zone, contrasting and surrounding it the competent sandstones are mineralised in a conjugate vein stockwork (Goellnicht, Groves, McNaughton and Dimo 1989; Vearncombe and Hill 1993). It is not possible to produce a complete list of mineralised positions or structures but some of them are: (1) steep reverse faults, (2) jogs, (3) around rigid bodies or pressure shadows, and (4) in boudinage structures (Fig. 4). The one and only factor they all have in common is a control by the stress field orientation and rheology, and that they are low mean stress positions (Fig. 4). The authors are aware of no mineralised positions that can be interpreted as high mean stress sites at mineralisation. Empirical examples of structures hosting gold are variable, but they all represent sites of the low stress within the regional stress field.
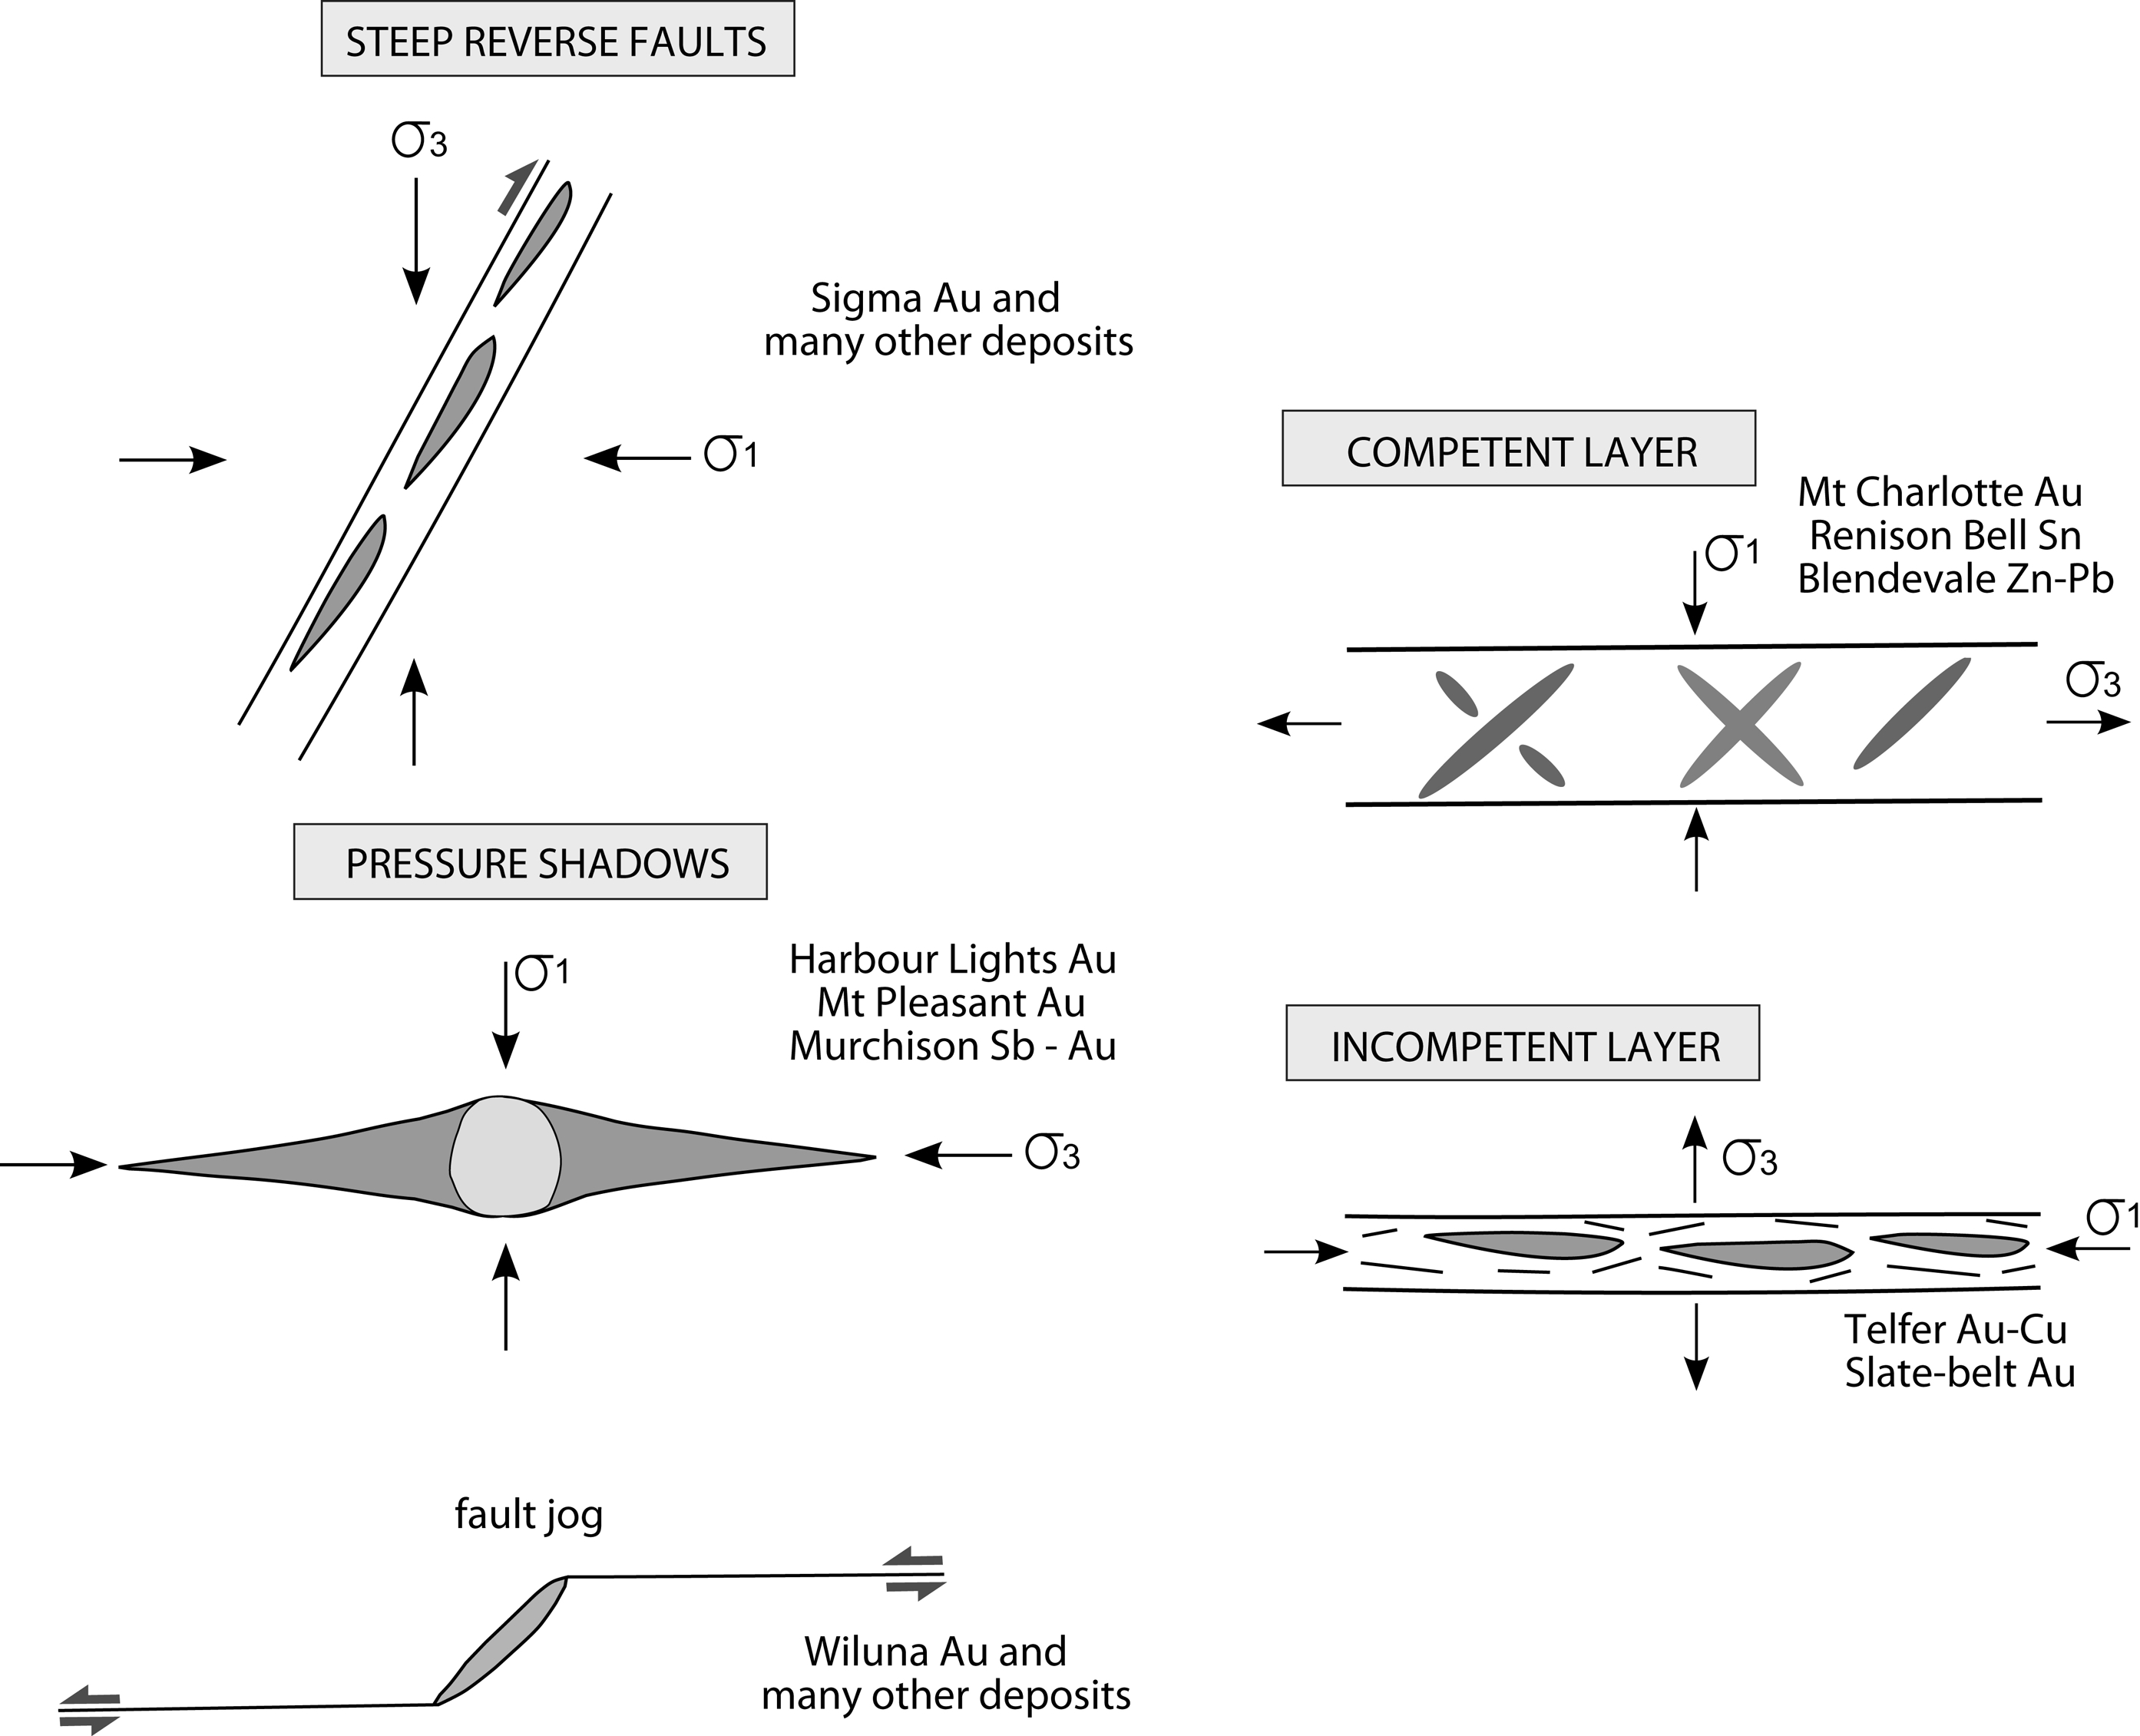
Schematic diagrams illustrating that mineralisation (grey colour) is always related to low stress sites. Diagrams are based on series of case studies from Western Australia first shown to the authors by John Ridley
The frequent, but not ubiquitous, flat extension veins in deposits opened only when the fluid pressure exceeded the lithostat (Fig. 5). Sibson (2002) demonstrates that fracturing under compressional régimes requires extreme stress heterogeneity or supralithostatic fluid-overpressure. Data from the Gulf of Mexico oil exploration drill program (Wood and Walther 1986) show that the fluid pressures below about 3 km of depth tend towards the lithostatic pressure (pressure of the host rock masses, ∼2.7 times denser than water). But, within the first 3 km of the Earth's crust, the fluid pressures are closer to the hydrostatic gradient (Fig. 6).
The development of veins in multiple orientations and a steep re-activated reverse shear zone (left). The recumbent veins show that fluid pressure exceeded the lithostatic pressure. Photograph from Kerr Addison mine Canada by Mike Grigson
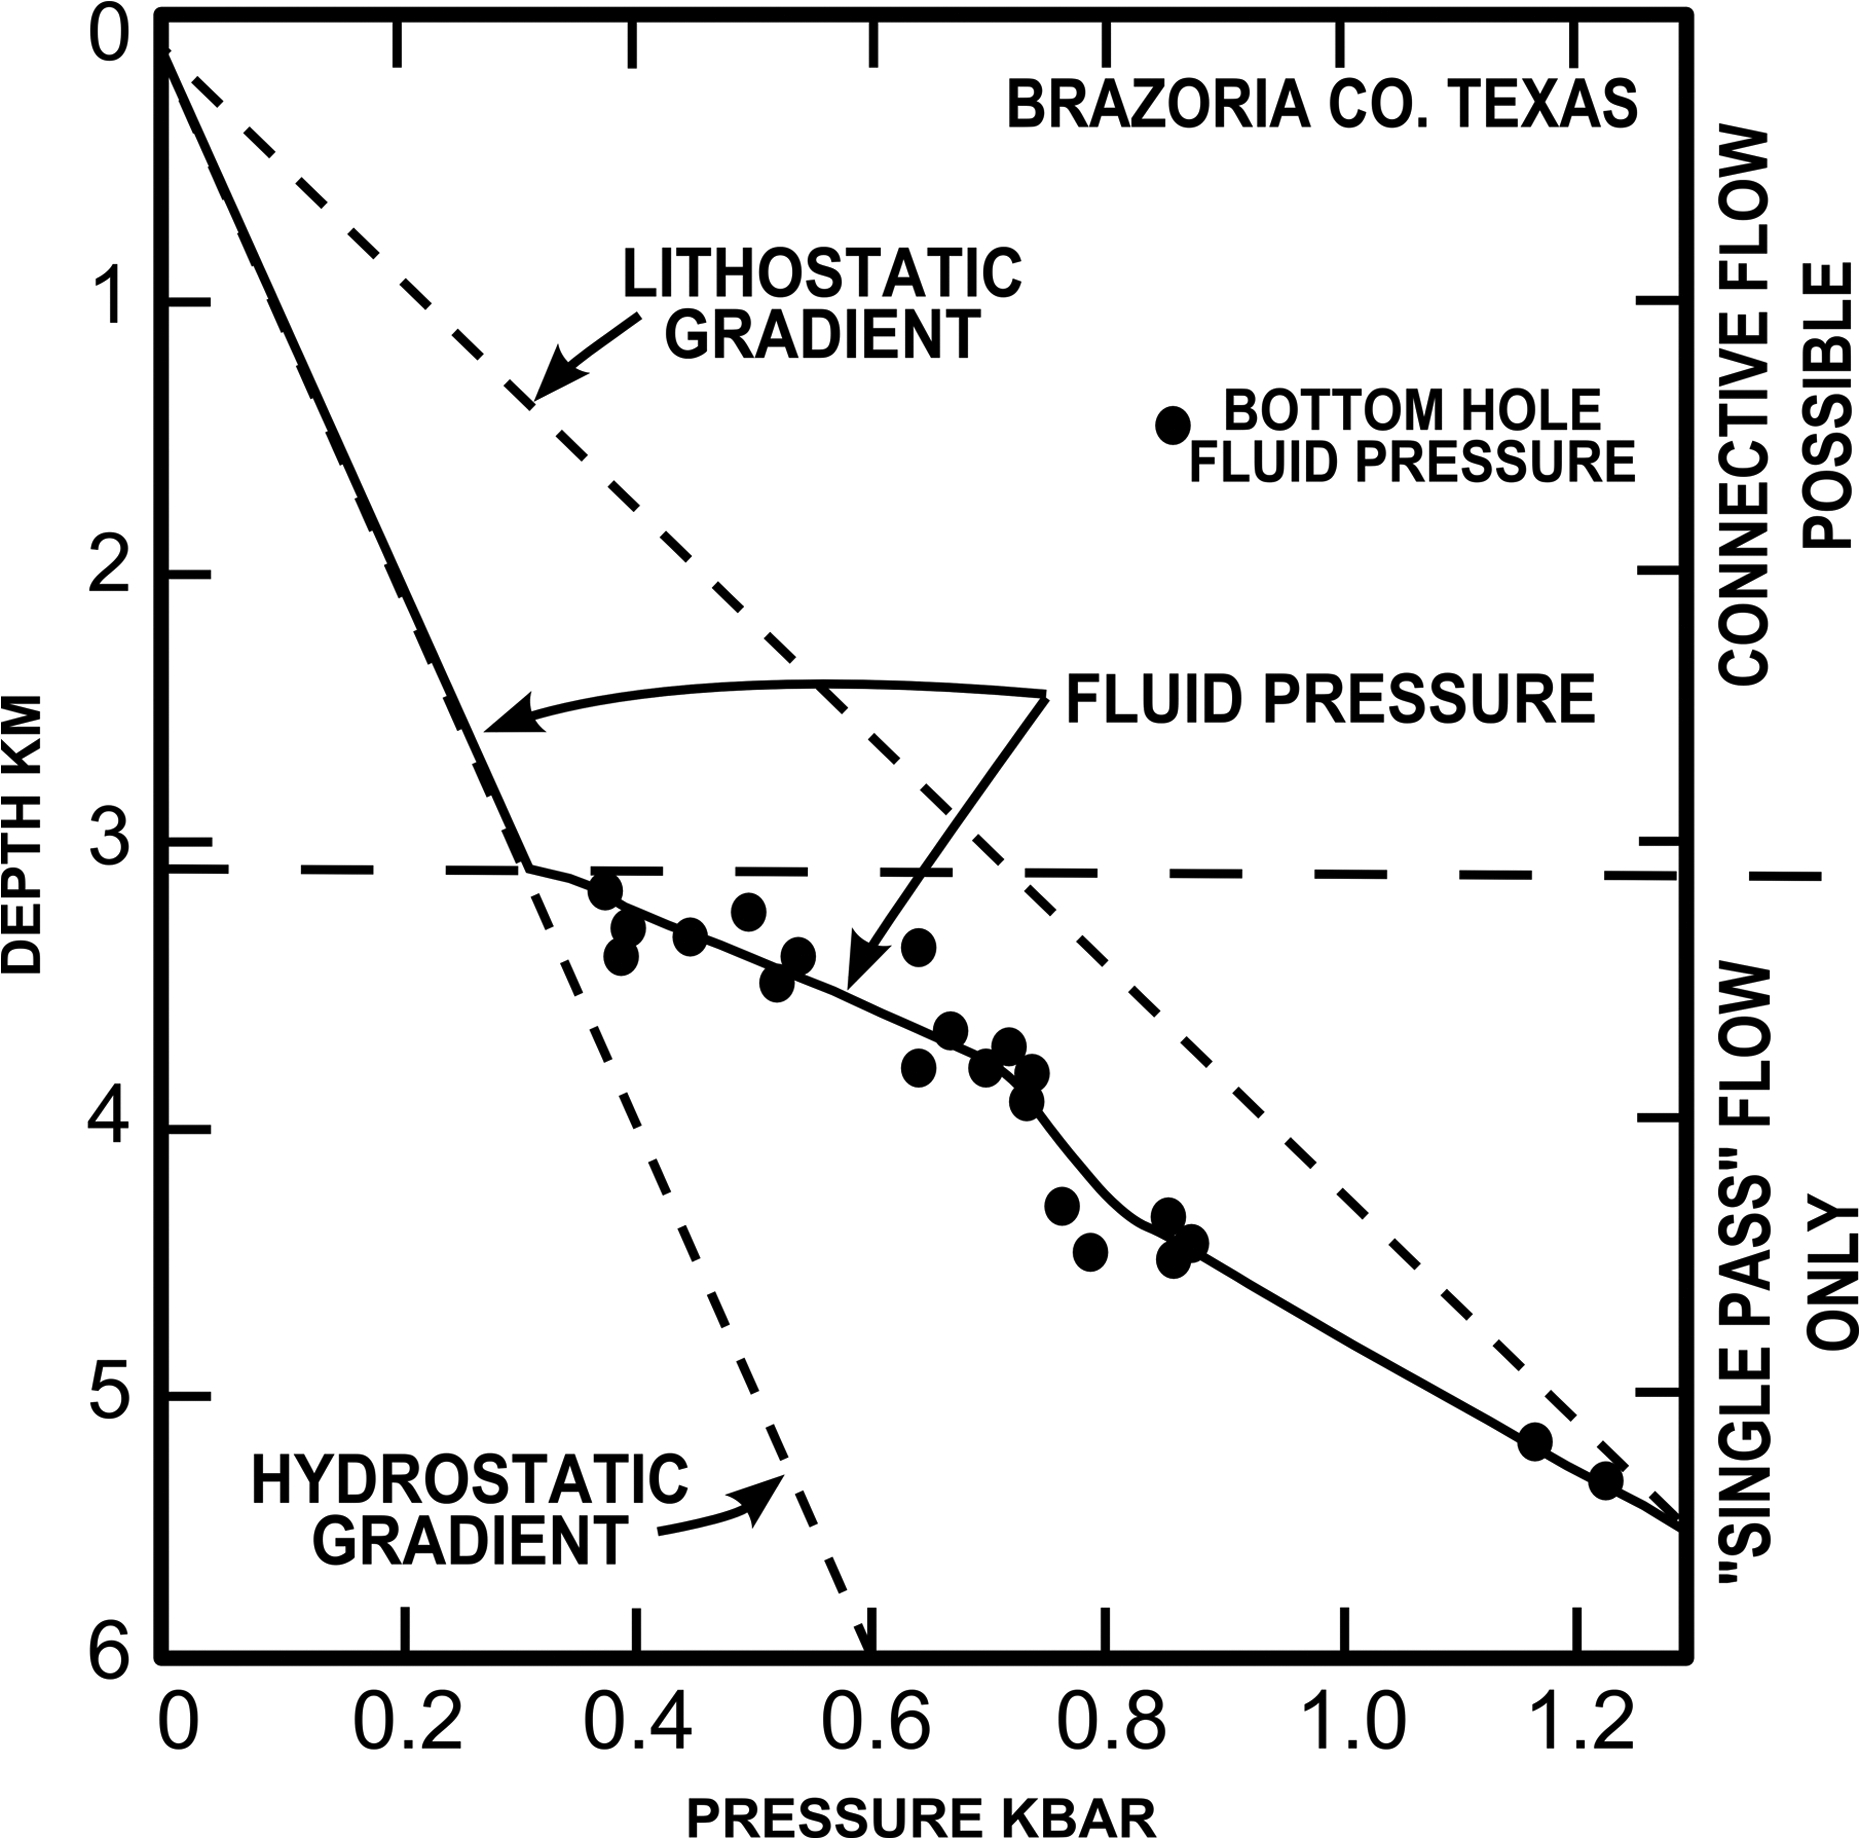
Diagram showing fluid pressure as a function of depth, from measurements in a sedimentary basin in the US Gulf Coast. Note the cross-over from hydrostatic pressures and its implications for fluid connection (modified after Wood and Walther 1986)
Overview of the structural paradigms for gold
Syngenetic (1950s–1980s)
Before the dramatic increases in gold price, following the 1971 abandonment of the gold standard, gold mineralisation processes were viewed as similar to the more important base metals and particularly volcanogenic sulphides. This view totally ignored the established work of Conolly (1936) and McKinstry (1948) who decades before developed structural technologies to assist in the exploration for and mining of gold. All hydrothermal mineralisation was regarded as a product of high salinity magmatic fluids (Skinner and Barton 1973), and exploration focused on prospective stratigraphy. The reason why this sometimes worked was because shear zones were mistaken for stratigraphy, and schist and mylonite with porphyroclasts were mistaken for tuffs (sadly, these errors still occur). The indications that the paradigm was incorrect came from the realisation that the Archaean gold-only fluids were low salinity and metamorphic in origin (Phillips 1993; Groves and Philips 1987), and that the host rocks were consistently deformed. Nowhere could ore be found that it was not in a structure, and undeformed (Groves et al. 1988; Colvine 1988; Kerrich and Feng 1992). The 1970–80s increases in gold's dollar value encouraged gold-only exploration and this resulted in models for gold, independent of base metals.
Late compressional shear zones
The late compressional shear zones paradigm was operational mostly during the 1980s. The paradigm is based on the structural dataset from southern Africa, collected and presented by Nutt, McCourt and Vearncombe (1988), Boocock et al. (1988) and Vearncombe et al. (1989). The main observations linked to this paradigm developed in southern Africa are that the gold mineralisation and related alteration are hosted within brittle-ductile vein systems on high-angle dip- or oblique-slip faults or shear zones, showing minor displacement and commonly on the edge of granite batholiths. In this paradigm, gold was not related to the regional crustal shear zones nor their subsidiary structures, but to late compression in the tectonic history (Fig. 7).
Schematic illustration of the evidence for late steep reverse shear zones that hosts gold. Many of the best examples known to us are in southern Africa (from Nutt et al. 1988)
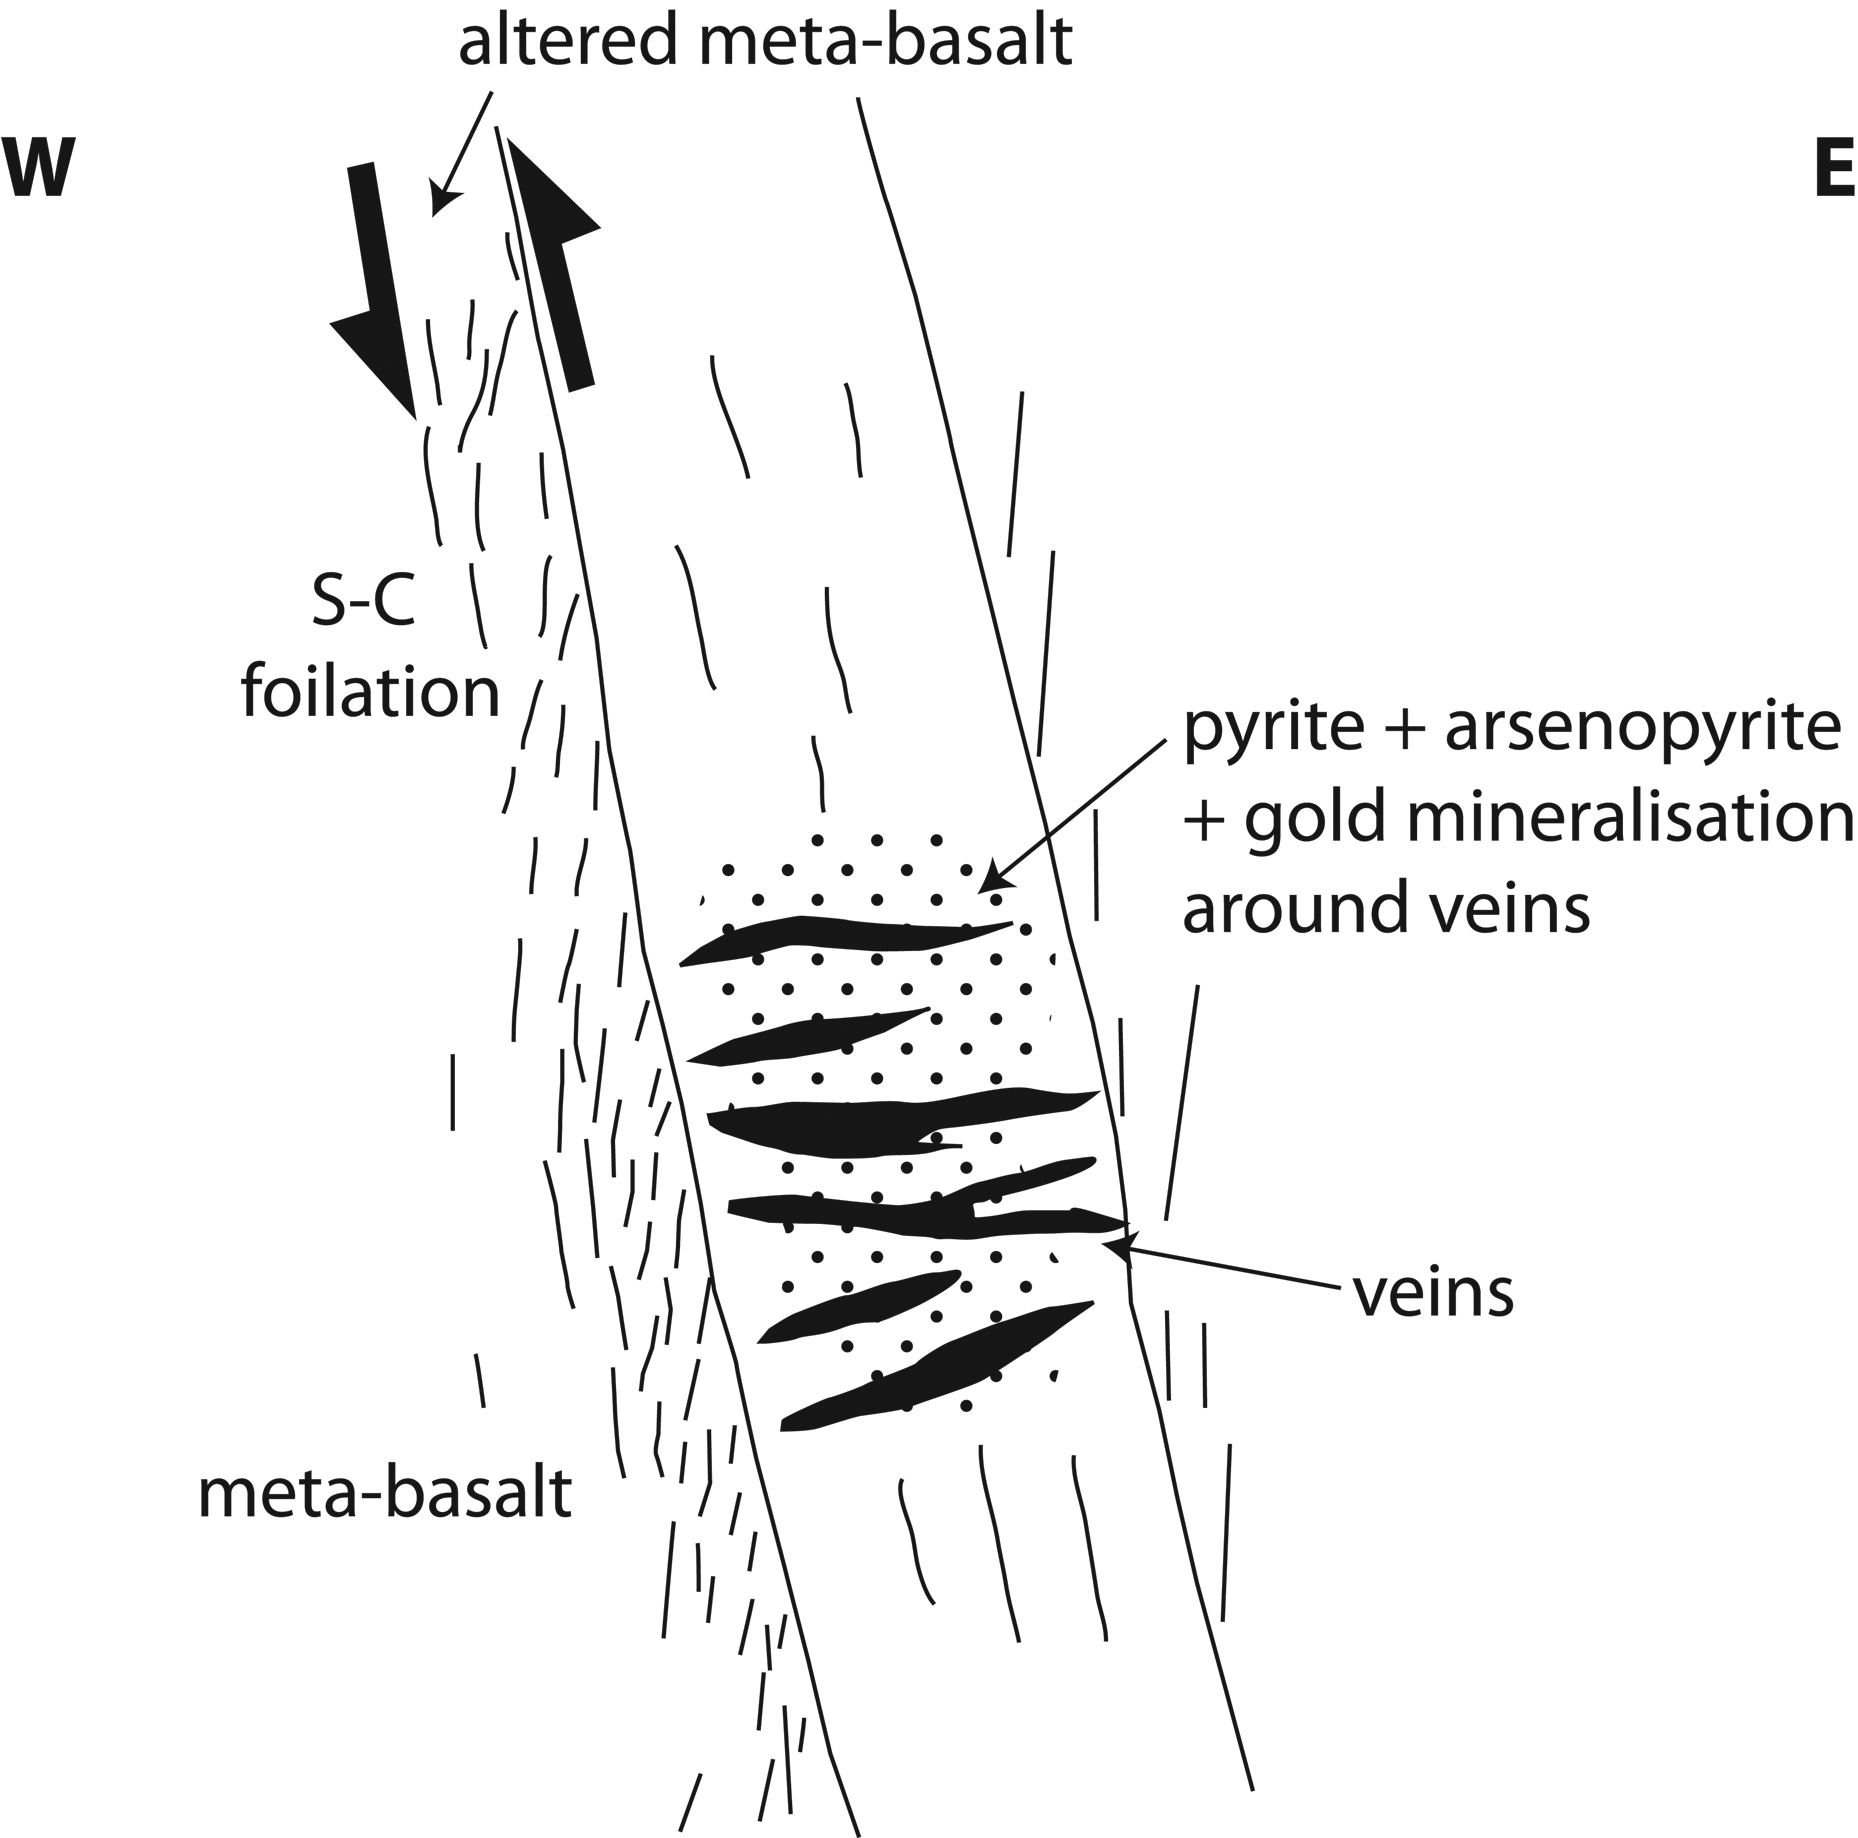
Field examples show the fluids precipitated mineralisation focused on sites characterised by change of orientation of shear zones, contacts between rocks of different competencies, and zones of pre-existing weaknesses in rocks. While the observation of late reverse motion applied well through South Africa and Zimbabwe, the paradigm did not successfully translate across the Indian Ocean. Empirically, in most cases in Western Australia, gold mineralisation is related to brittle-ductile to brittle structures in a terrain of regional strike-slip shear zones (Fig. 8). Exceptions may be the lateral ramps in strike-slip systems as at Kambalda and St Ives, Western Australia (Vearncombe et al. 1989).
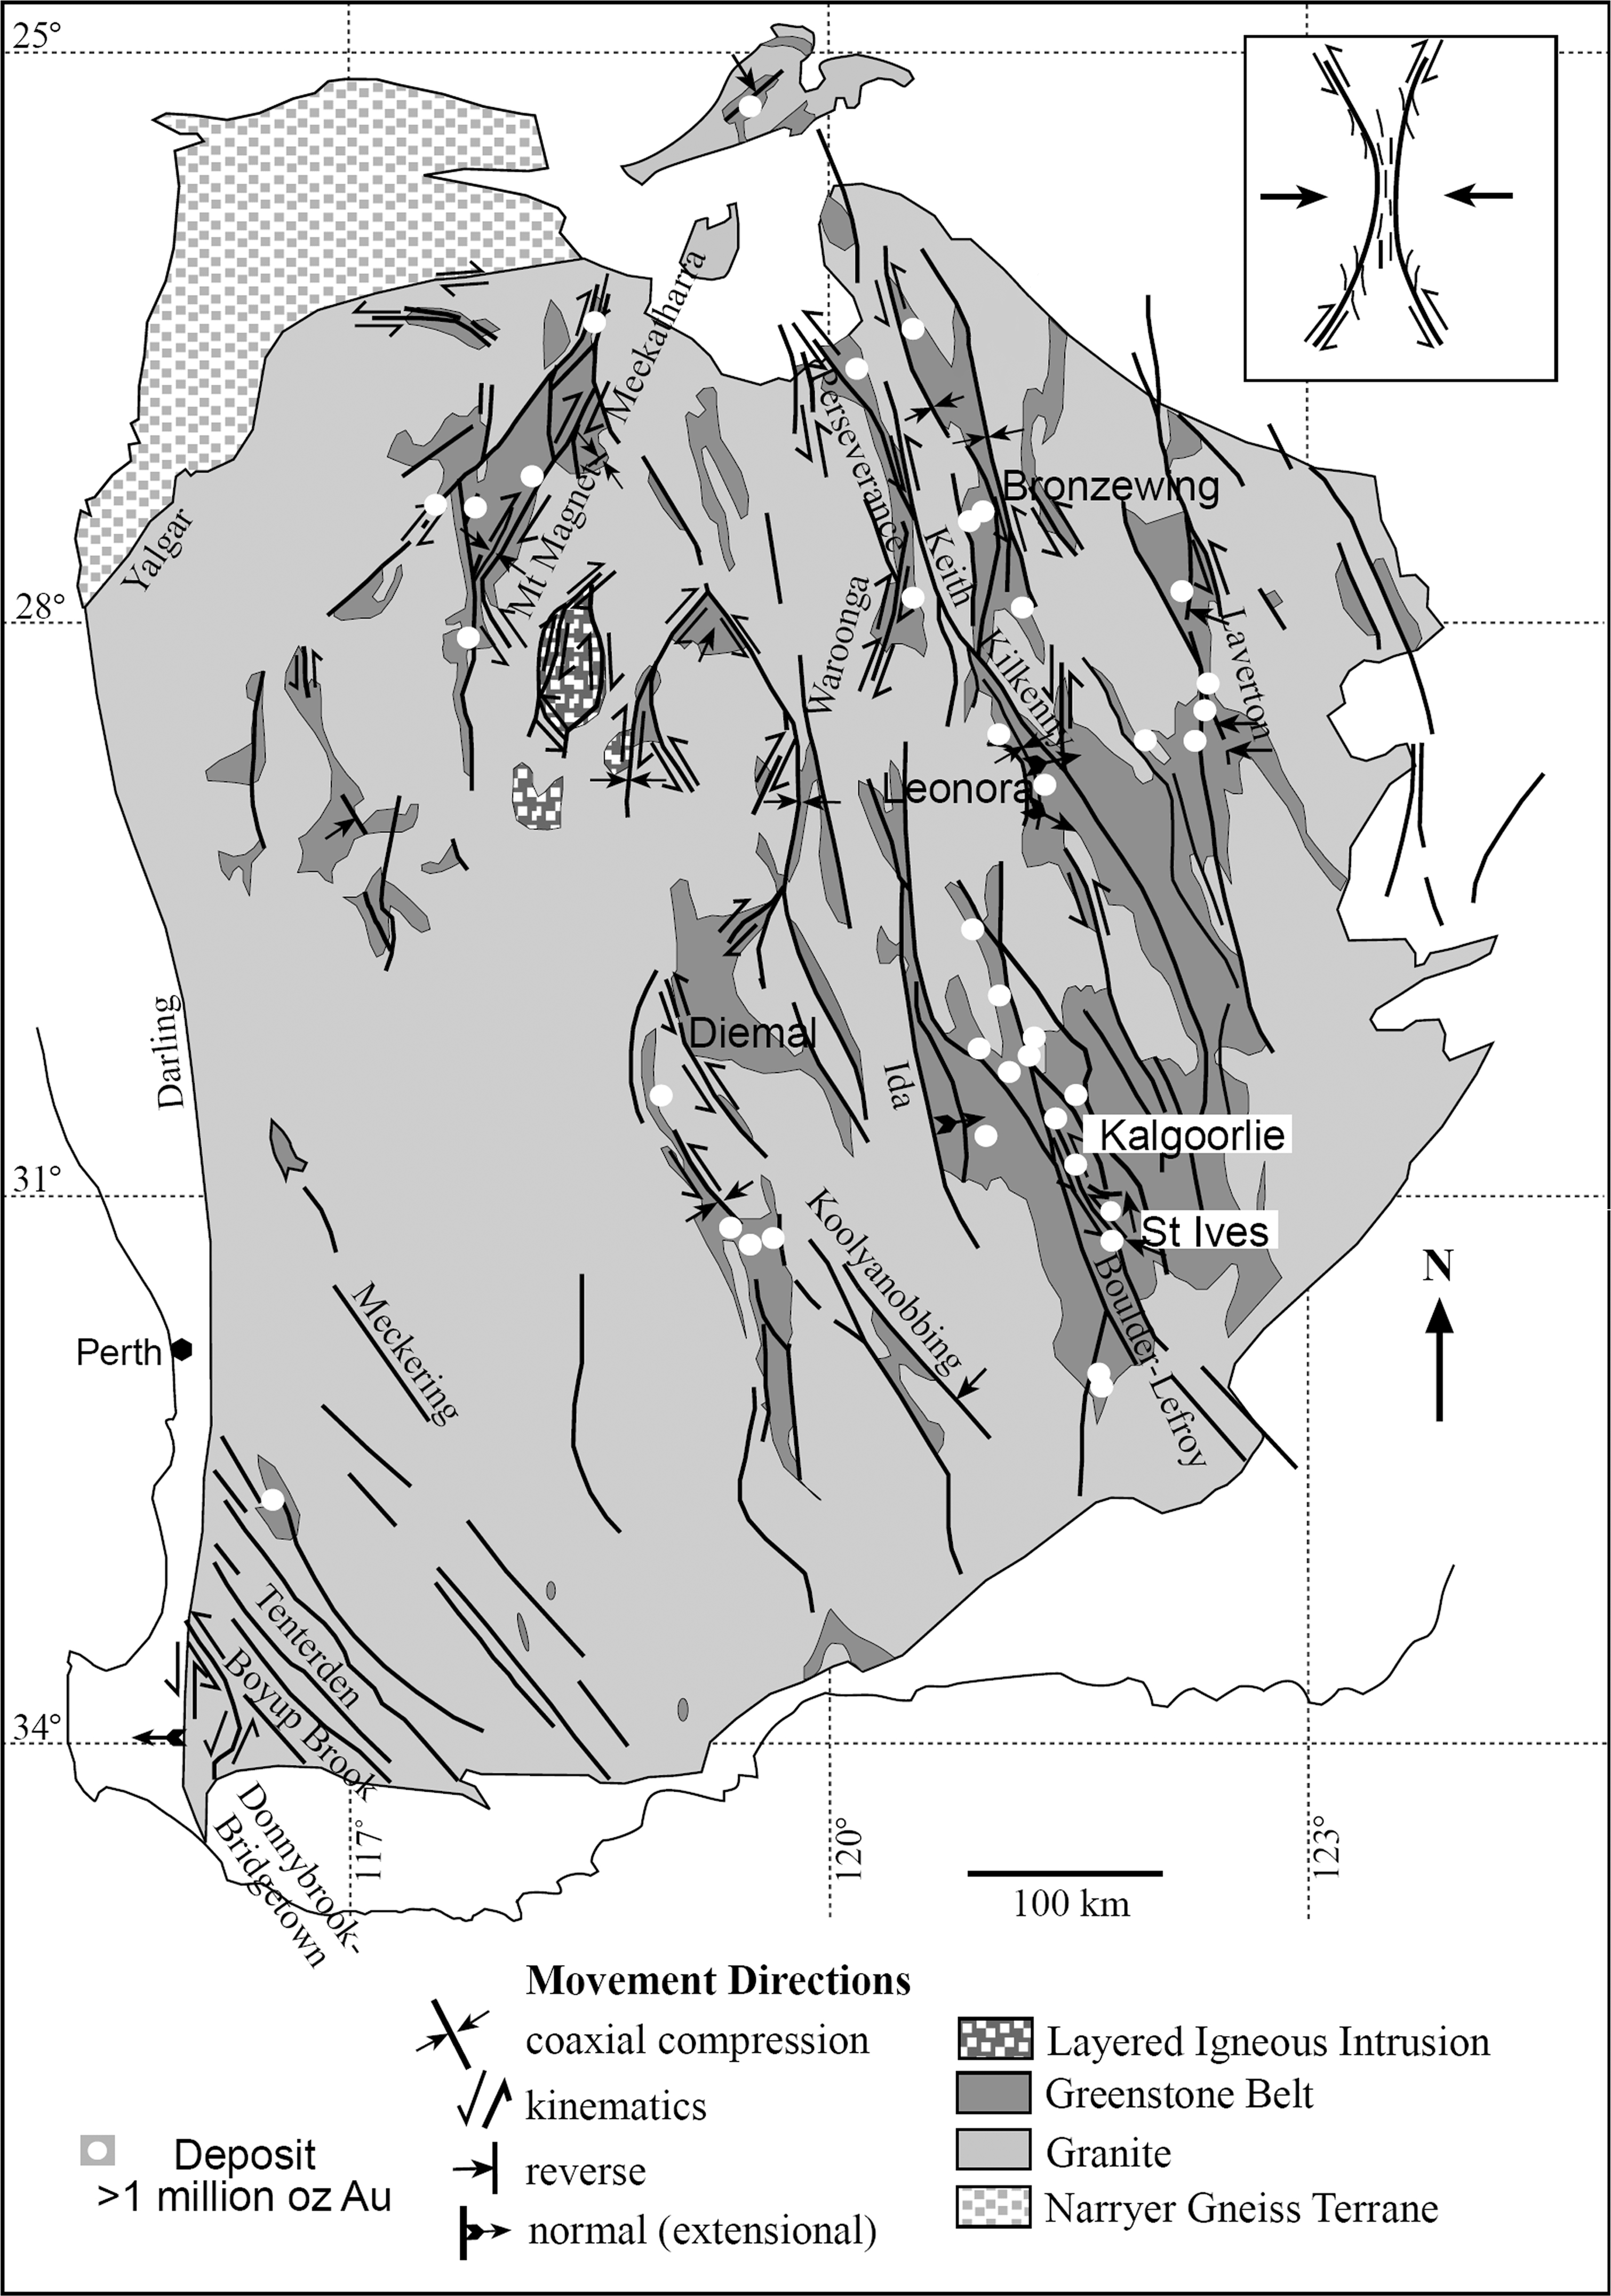
Aeromagnetic interpretation of the schematic geology of the Yilgarn Craton (Western Australia), with shear zones developed mostly along rheological contacts between granite and greenstones (Vearncombe 1998)
Wrench tectonics (intra-shear structures)
This paradigm attempts to explain the distribution of gold in Western Australian as related to NNW-and NNE-trending regional, crustal wrench faults showing displacement of several tens of kilometers and their subsidiary splays (Harris 1987; Mueller and Harris 1987). The paradigm identifies brittle-ductile to ductile shear zones, developed mainly under sub-amphibolite metamorphic facies conditions (Harris 1987), and in particular dilatant zones within the major shear zones, as the most prospective domains. Generally, gold mineralisation is interpreted to be distributed along second- to fourth-order structures located between principal, regional wrench faults (shear zones), being precipitated from the large volume of hydrothermal fluids derived from an external source, flowing through the depositional environment (Mueller and Harris 1987; Fig. 9). The lithology plays an important role in deposition of mineralising fluids, both in chemistry and rheology terms (Groves 1982; Colvine et al. 1984), while permeability in the rock mass, formed by tectonic deformation (i.e. structural control), remains the major control of fluid flow and deposition (Harris 1987). Because of favourable metamorphic conditions, chemistry and host rocks, the shear zones represent the ideal sites for mineralisation, and most importantly, subsidiary dilational structures, such as tension gashes, Riedel bends and saddle reefs (Harris and Cobbold 1984; Mueller and Harris 1987).
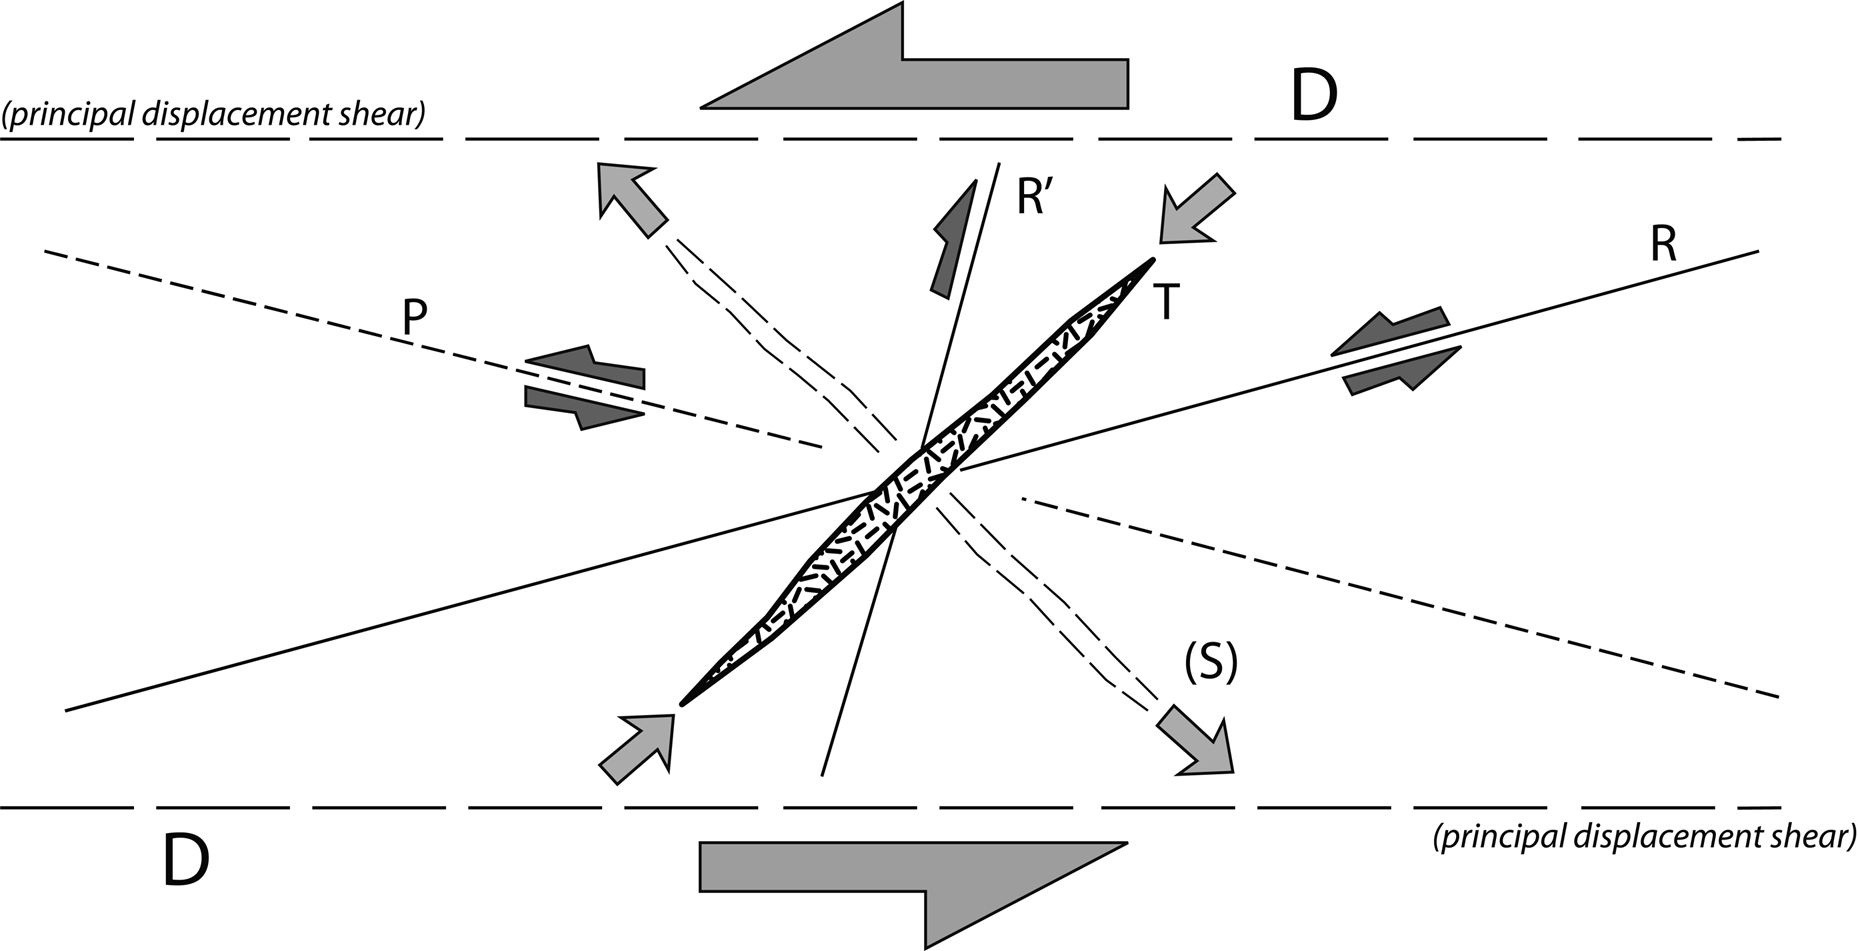
Geometry of main subsidiary structures within a wrench zone (Scale independent). D = principal displacement shear parallel to boundaries of zone; R and R′ = Riedel shears (dilational); T = tension gashes or normal faults (dilational); S = fold axes, cleavage or reverse faults (modified after Harris 1987)
Using this paradigm, important in exploration for gold are transcurrent shear zones and localisation of dilatant shear zones with a high potential for mineralisation (i.e. intensively deformed domains related to shear zones; Harris 1987). The main structures controlling and hosting gold mineralisation, presented and described by Harris are saddle reefs, tension fractures and boudinage, conjugate faults and en échelon tension gash arrays, wrench fault zones and associated structures (Figs. 9 and 10). Field observations and analogue modelling (Harris and Cobbold 1984) showed that the greatest permeability and potential for deposition of mineralising fluids is controlled by a change from one set of shears to another (e.g. from D to R to D, with gold mineralisation along R structures; Fig. 10). However, there are some examples showing distribution of gold along P structures and at the junction of D and P shears of a major fault system (e.g. the Cameron Lake in Ontario, Melling, Watkinson, Poulsen and Chorlton 1985). Additional attention is also given to the presence of dilational or anti-dilation jogs, as a mechanism for accommodation of movement from one fault to another. At the regional scale, these structures are associated with transtensional and transpressional tectonic regimes, characterised by pull-apart basins, negative and positive flower structures (Fig. 10).
Schematic representation of likely regional-scale control of the gold mineralisation and structural configurations for major fault jogs, a dilational jog, and b anti-dilational jog and c analogue modelling results showing distribution of mineralisation sites within the fault zone (modified after Harris and Cobbold 1984). The modelling indicated dilation where there is a change in geometry from D to R to D, along the R orientation
The structural interpretation of the shear zones and their subsidiary structures geometries are the recommended exploration tools of Harris (1987). The first step in exploration is detection of transcurrent shear zones and localisation of dilatant shear zones. This can be performed first on a regional scale by analysis of aeromagnetic images and detection of large lineaments showing D, R and T geometries (Harris 1987). On a map-scale, structural and lithological mapping is recommended. Particular attention must be given to a multi-scale mapping and careful kinematic analysis (from region to outcrop to microscale), since the prospectivity for gold mineralisation distribution is strongly controlled also by fractal behaviour of these structures (Harris 1987). The recognition of dilational or anti-dilation jogs, and related transtensional and transpressional structures (i.e. negative and positive flower structures) is important. Careful and systematic structural analysis is a requirement, since different geometries may be mineralised during the same tectonic event. However, the large-scale strike-slip shear zones remain the most favourable tectonic setting for hosting gold deposits, which could represent reactivated regional, crustal structures. Although these shear zones acted as fluid conduits, most of the mineralisation occurs along subsidiary structures within these shears, such as tension gashes, Riedel bands and saddle reefs (Harris 1987). Therefore, the successful exploration for gold must be systematic, multi-scale, and detailed in the structural analysis of the exploration ground.
This paradigm encouraged some poor quality science (late 1980s–90s), in particular, the two dimensional interpretation of maps and geophysical images without mineral lineation data on the movement direction of a structure, effectively ignoring the third dimension. It has been argued (Vearncombe 1998; Tripp and Vearncombe 2004) that the majority of gold in the Yilgarn are not related to the large-scale crustal shear zones, but cross-cutting structures associated to the late compressional events. Furthermore, most of the features described as D, R and T shears extend beyond the margins of regional shear zones, sometimes beyond the limits of the regional aeromagnetic imagery. They are in fact overprinting features and not internal components of a shear zone. The paradigm proposes the development of gold mineralisation under sub-amphibolite metamorphic facies as brittle-ductile to ductile shear zone, although there are many deposits both showing lower and higher metamorphic grade, which is not elaborated by this paradigm.
Intersecting sites of complexity (mid-1980s to present)
Intersecting sites of complexity is the simplest, certainly cheapest, exploration methodology that illustrates structure as the principal control of gold-bearing fluids transport and gold mineralisation deposition (Groves et al. 1988; Colvine 1988; Kerrich and Feng 1992). An observation on most geology maps is that the gold mines are invariably in the geologically most complex part of the map, the part with the greatest structural, lithological and rheological complexity. Arguably, the complexity on some maps is biased as a product of local data, but the worldwide application of the paradigm suggests that it is not just an aberration of data around the item of interest. In this paradigm, the most complex spots on a map result from faults in unusual orientations, bends in structures, interacting cross-faults and significant variations in rock rheology. Complex fault, fold and shear patterns result in similarly complex rock unit patterns.
Williams, Nisbet and Etheridge (1989) proposed a structural, evolutionary model for the Leonora area and observed that all mineralisation occurs in highly foliated chlorite-sericite-quartz schist. Their study from the Sons of Gwalia shear zone indicates that the mineralisation body is pipe-like, plunging steeply down-dip. An important observation was that gold deposits are coincident with the changes in strike of lithological contacts, whereas the early foliation remains parallel to them (Williams et al. 1989). Therefore, the mineralised horizons (lodes) are interpreted as areas of the most intense shearing and fluid flow (Williams et al. 1989). Moreover, gold is associated mostly with shear zones but is commonly controlled by secondary faults that splay off or cross-cut the shear zones (e.g. Groves et al. 1988).
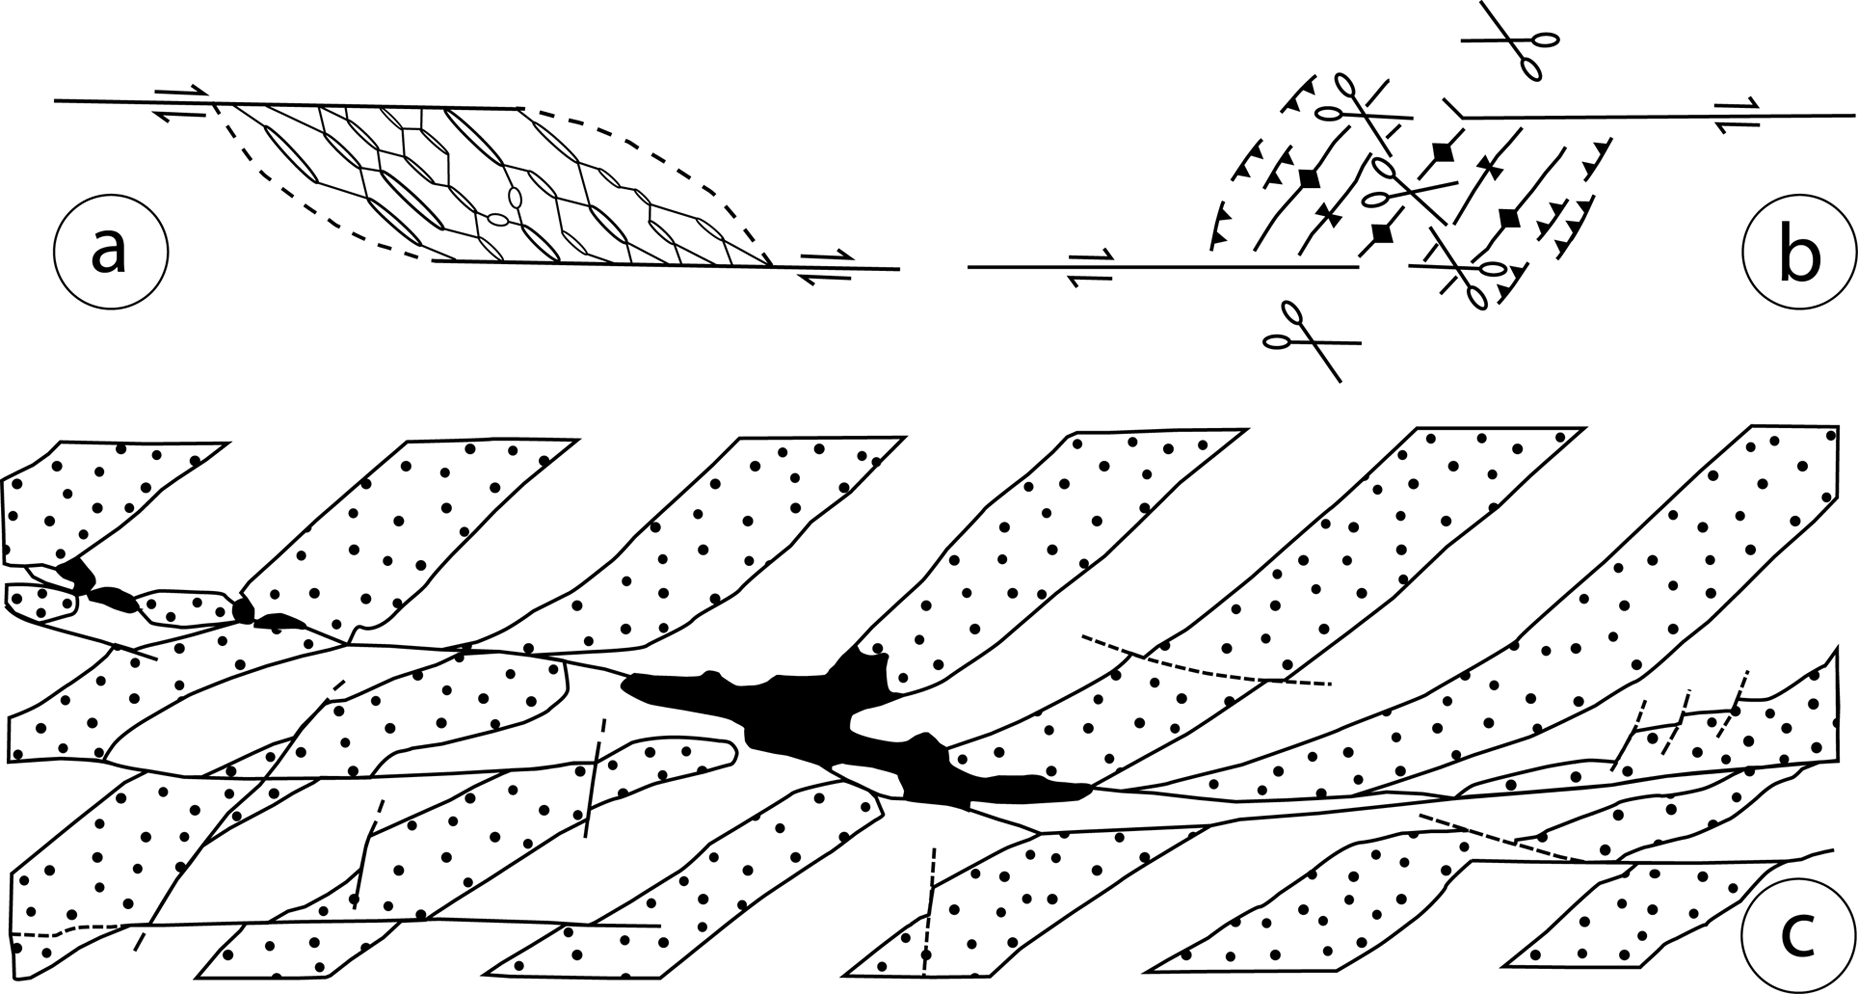
Tripp and Vearncombe (2004) show that high fracture density, mineralisation and ore forming processes in Archaean terranes of Western Australia demonstrate a direct correlation (Figs. 8, 11 and 12). Archaean lode gold in Western Australia is hosted by low-displacement faults, cross-cutting greenstone boundaries and older regional-ductile shear zones. The cross-cutting geometries produced linked networks for the whole craton (Sibson 1996; Vearncombe 1998). Rock alteration and mineralisation occurrences show a direct link with density of rock fracturing and elevated fluid flow (Tripp and Vearncombe 2004) and/or areas of anisotropy from primary layering and intrusions (Tripp 2000).
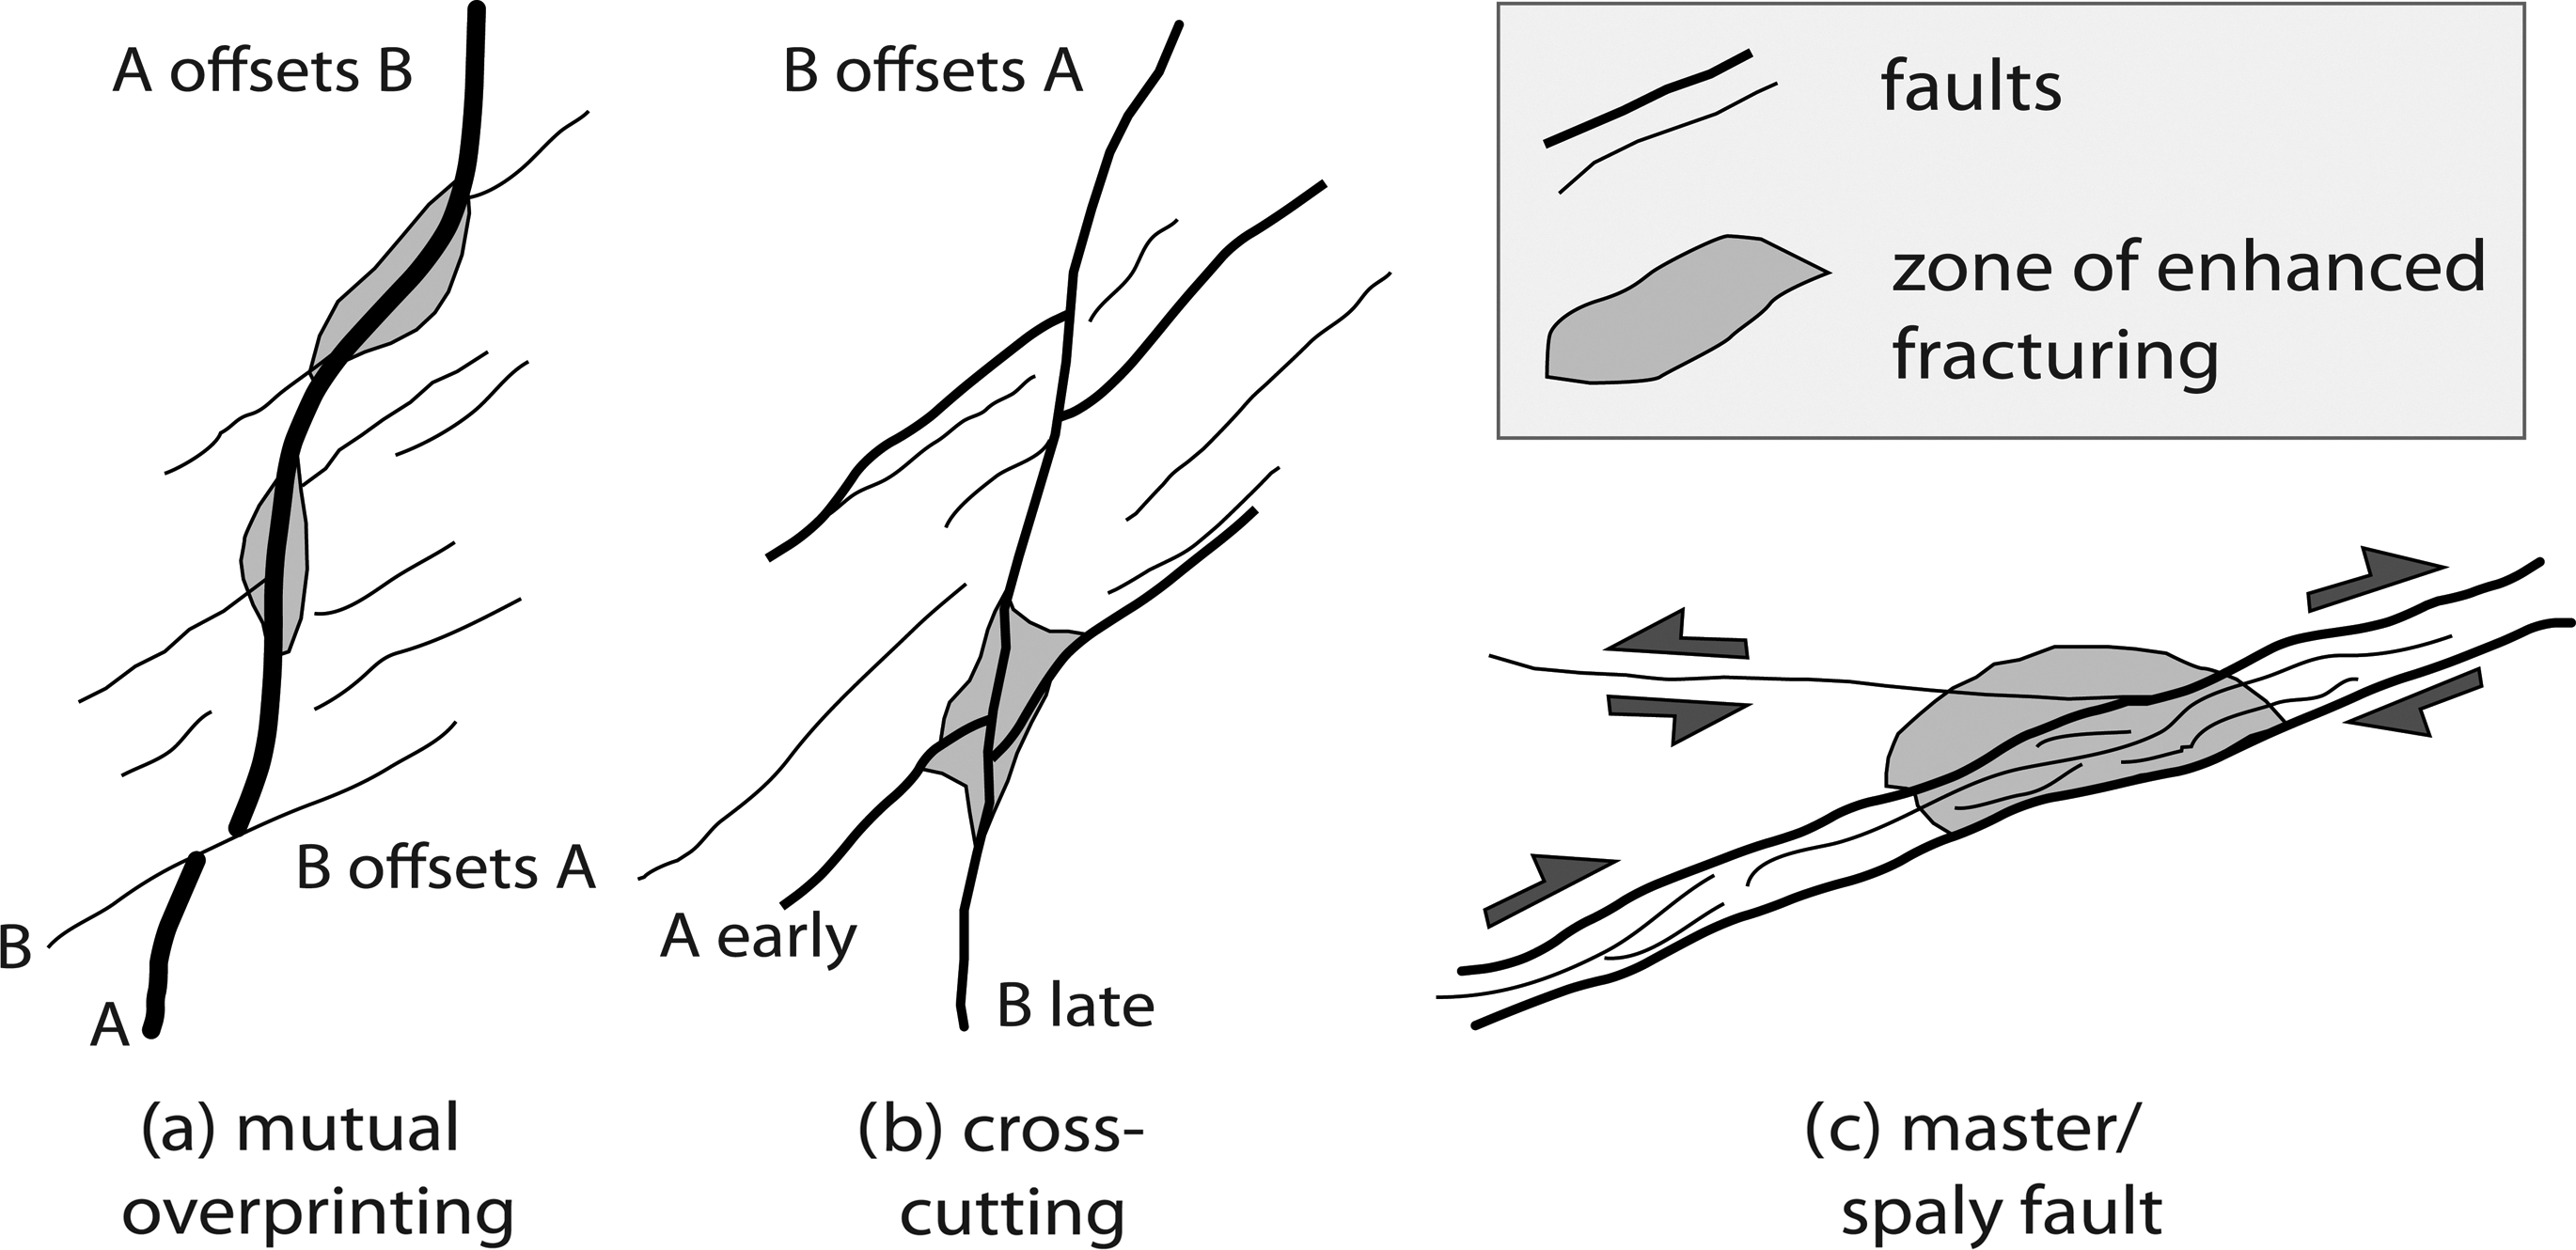
a overprinting faults; b cross-cutting faults; c master-splay faultSchematic summary-diagrams of different fault–fault interactions prospective for gold precipitation (from Tripp and Vearncombe 2004).
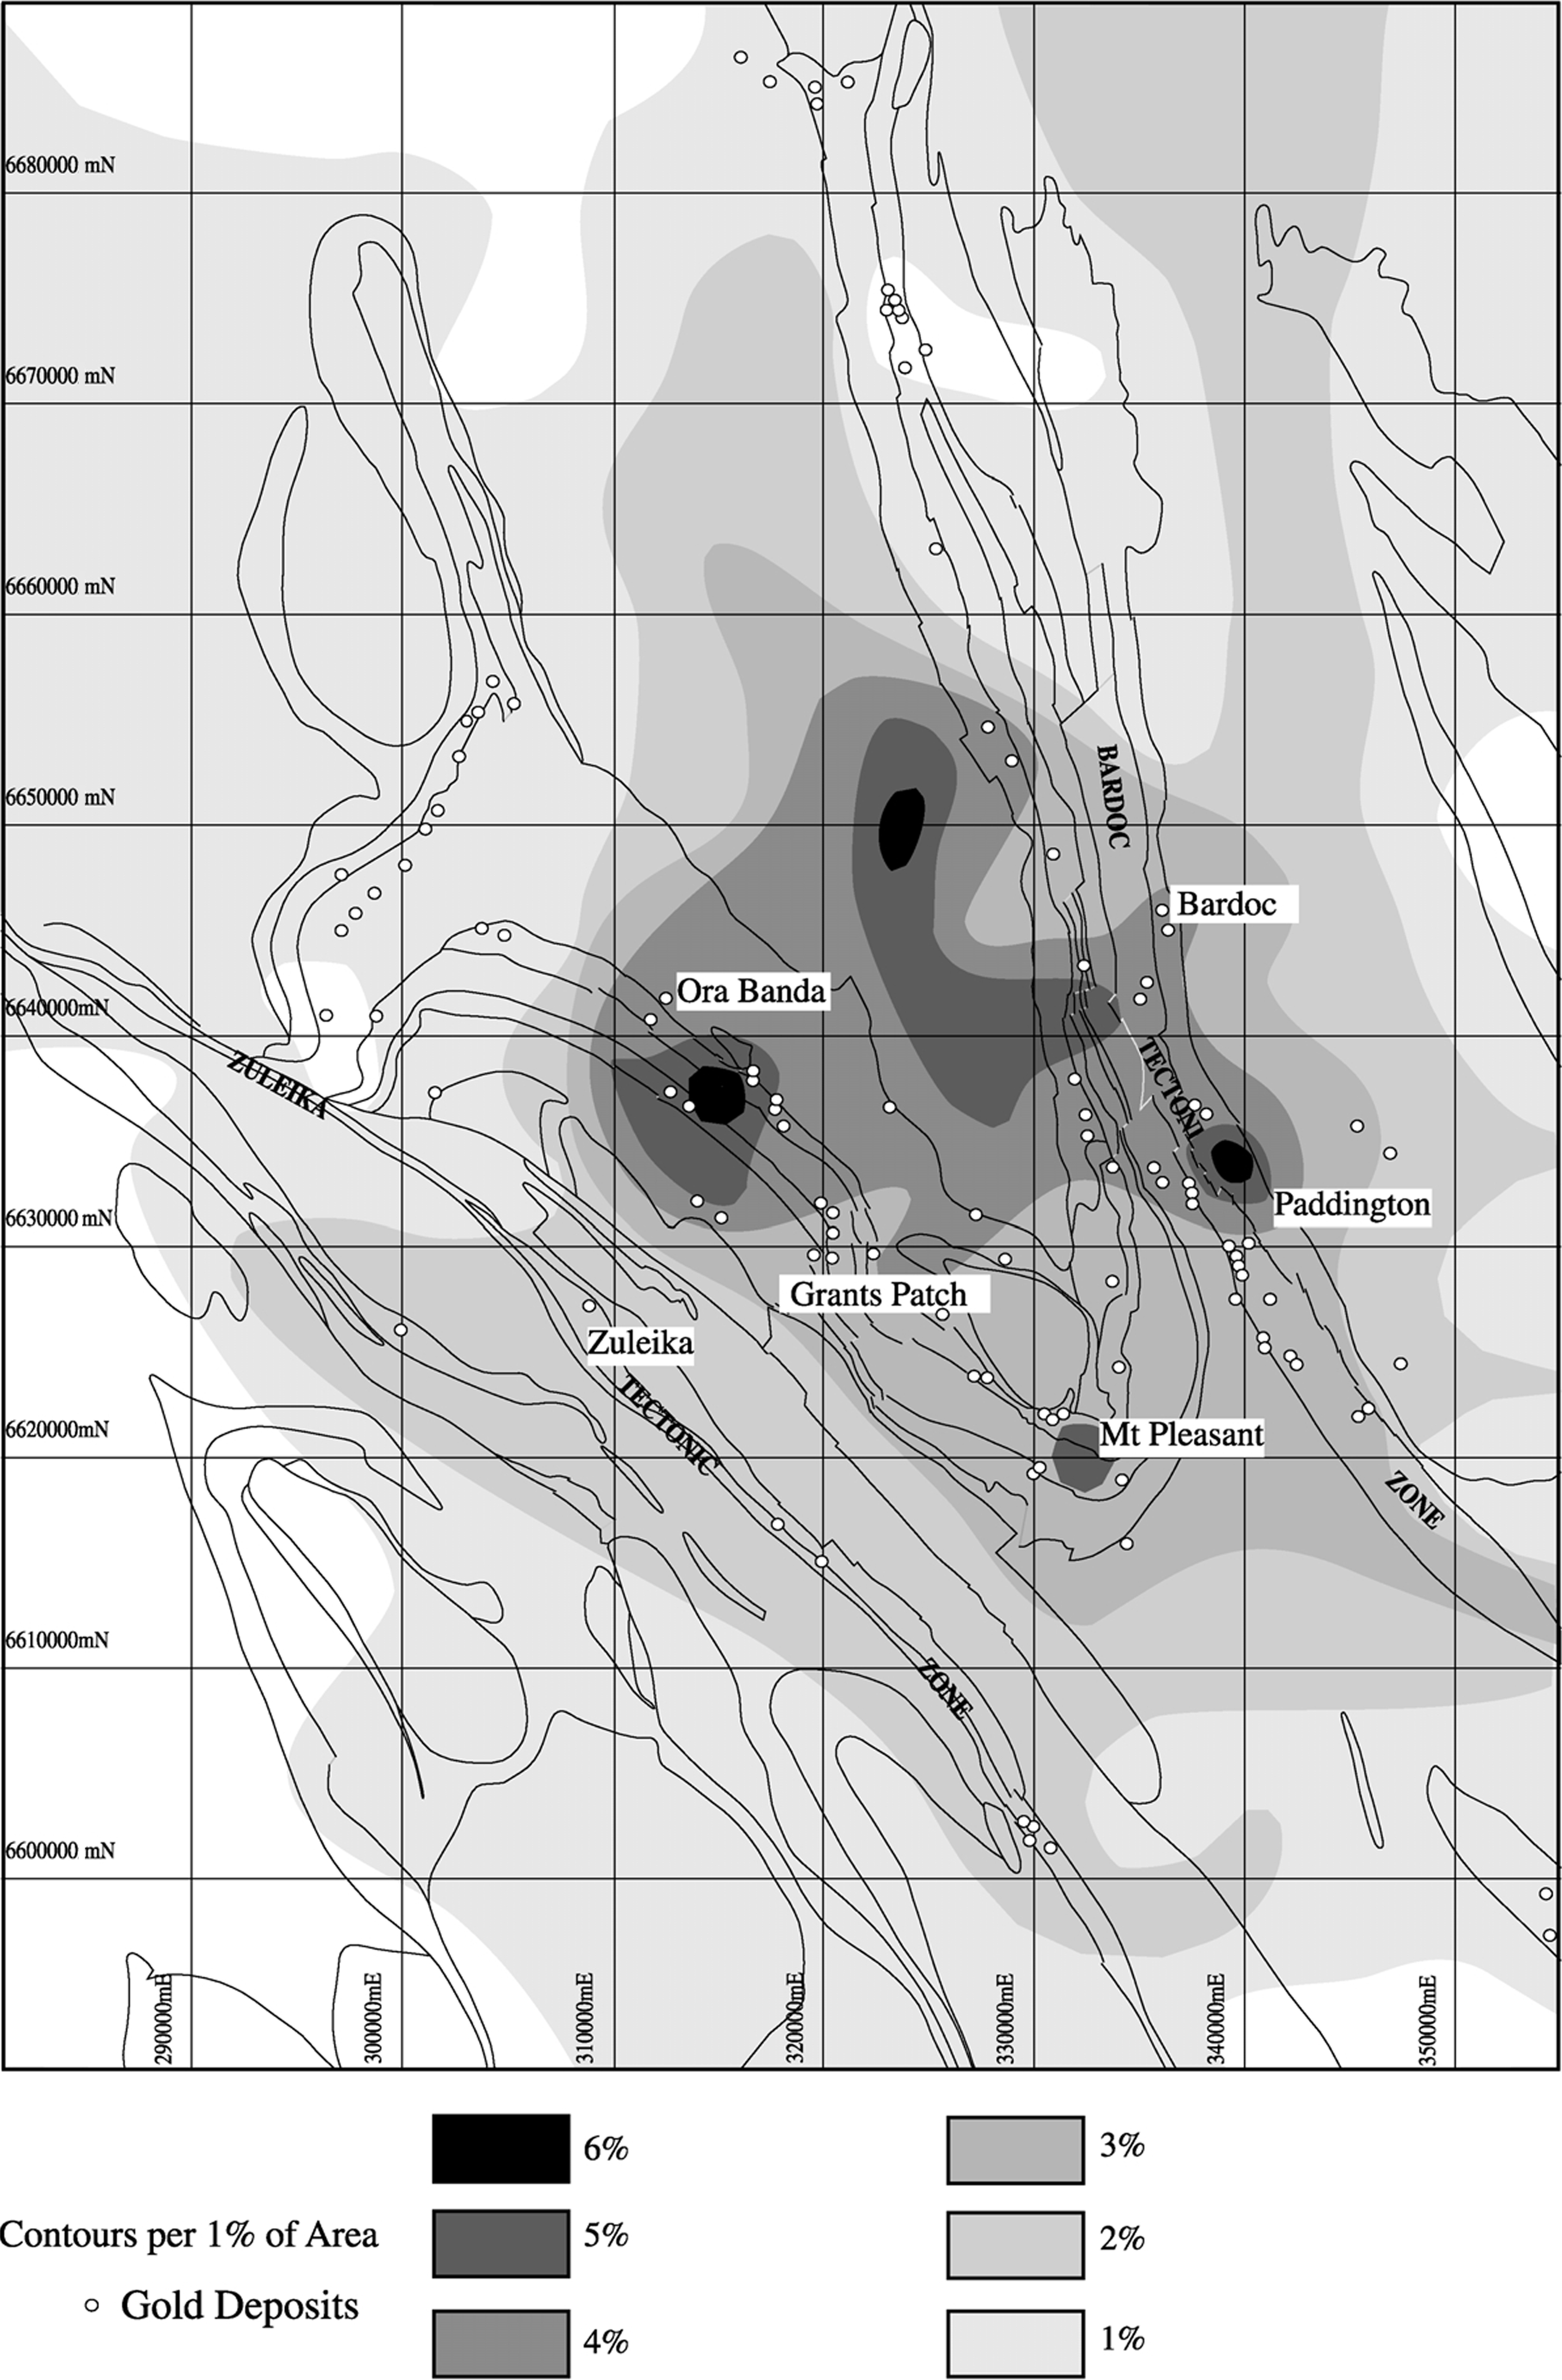
Fracture density map indicating structure-intersection domains in the Mt Pleasant – Ora Banda area NW of Kalgoorlie, Western Australia (Tripp and Vearncombe 2004)
A starting step in exploration is detection of the areas where fracture density and rock type variation are high. Three sources of complexity are: changes of fault geometry, domains of fault-fault interaction and within areas of interaction between faults and pre-existing geometries. Fault–fault intersections are presented by Tripp and Vearncombe (2004) as the most common domains of elevated fluid flow. Where the faults are developed synchronously, intersection types can range between simple cross-cutting relationship and master-splay fault geometries. The role of rock mass anisotropy is critical and can strongly influence the elevated fluid flux and distribution of gold. Some of the main anisotropies to consider are bedding contacts, igneous layering, rigid boudins, and zones of hydrothermal alteration. Recognition of these areas both on a regional and mine/deposit scale may provide important constraints in outlining or expanding the exploration prospective domains.
Quantification of the fracture density is proposed by Tripp and Vearncombe (2004) as a technique of detection of the elevated fluid-flow domains. The first step is analysis of aeromagnetic data in combination with geological maps and Landsat imagery, and detection of fault–fault and fault–contact intersections per unit area (Fig. 12). The areas with the greatest intersection density are the most prospective areas for gold mineralisation. While the methodology proposed by the paradigm is mainly driven by time-effective analysis of regional, satellite and geophysical data, the same can be applied by detailed field (and pit) mapping, as evidenced by the case study from Ora Banda goldfield, Western Australia (Tripp and Vearncombe 2004).
Stress mapping (1990s)
The mean stress or stress mapping paradigm is based on the works of Oliver, Valenta and Wall (1990) and Holyland (1990), informed by the perceptive observations of Ridley (1993). According to this paradigm, variations of mean stress and not permeability are the control for focused fluid flow and the formation of mesothermal gold deposits. The paradigm investigates the relationship between stress field, permeability and fluid flow using mean stress variation yielding conceptual implications for exploration of gold and other deposits. This paradigm assumes a large flow of fluid and metal transport that is long-lived (Browning, Groves, Blockley and Rosman 1987; Ridley 1993).
Fluid pressure at depth, where most of the mesothermal deposits formed, is buffered to lithostatic pressure, being controlled by rock mass pressure (Fig. 6). Changes in fluid pressure, at constant volume of rock, are related to mass balance of fluid influx or outflow through the rock mass storage capacity, in detail a product of pore-space collapse, fluid production and absorption in metamorphic reactions or magmatic processes (Ridley 1993). At depth and in addition to the natural buoyancy of water yielding an upward flow, focusing results from lateral gradients in hydraulic-head and the conditions to produce these gradients are spatial variations in permeability of the rock mass, and/or spatial variations in mean rock stress.
Variations in the permeability of the rock mass generally affect the fluid pressure and initiate fluid focusing (Fig. 13). A zone of high permeability will be a zone of low fluid pressure, in which case it will form an effective continuous channelway allowing fluid up-flow (Ridley 1993). But at depths greater than about 3 km, flat veins and reactivated steep faults (common in gold ore zones) are evidence of high and over-pressured fluids (Pf ≥ Pl) and not the low effective pressures related to high permeability in the channelways (Figs. 5 and 13).
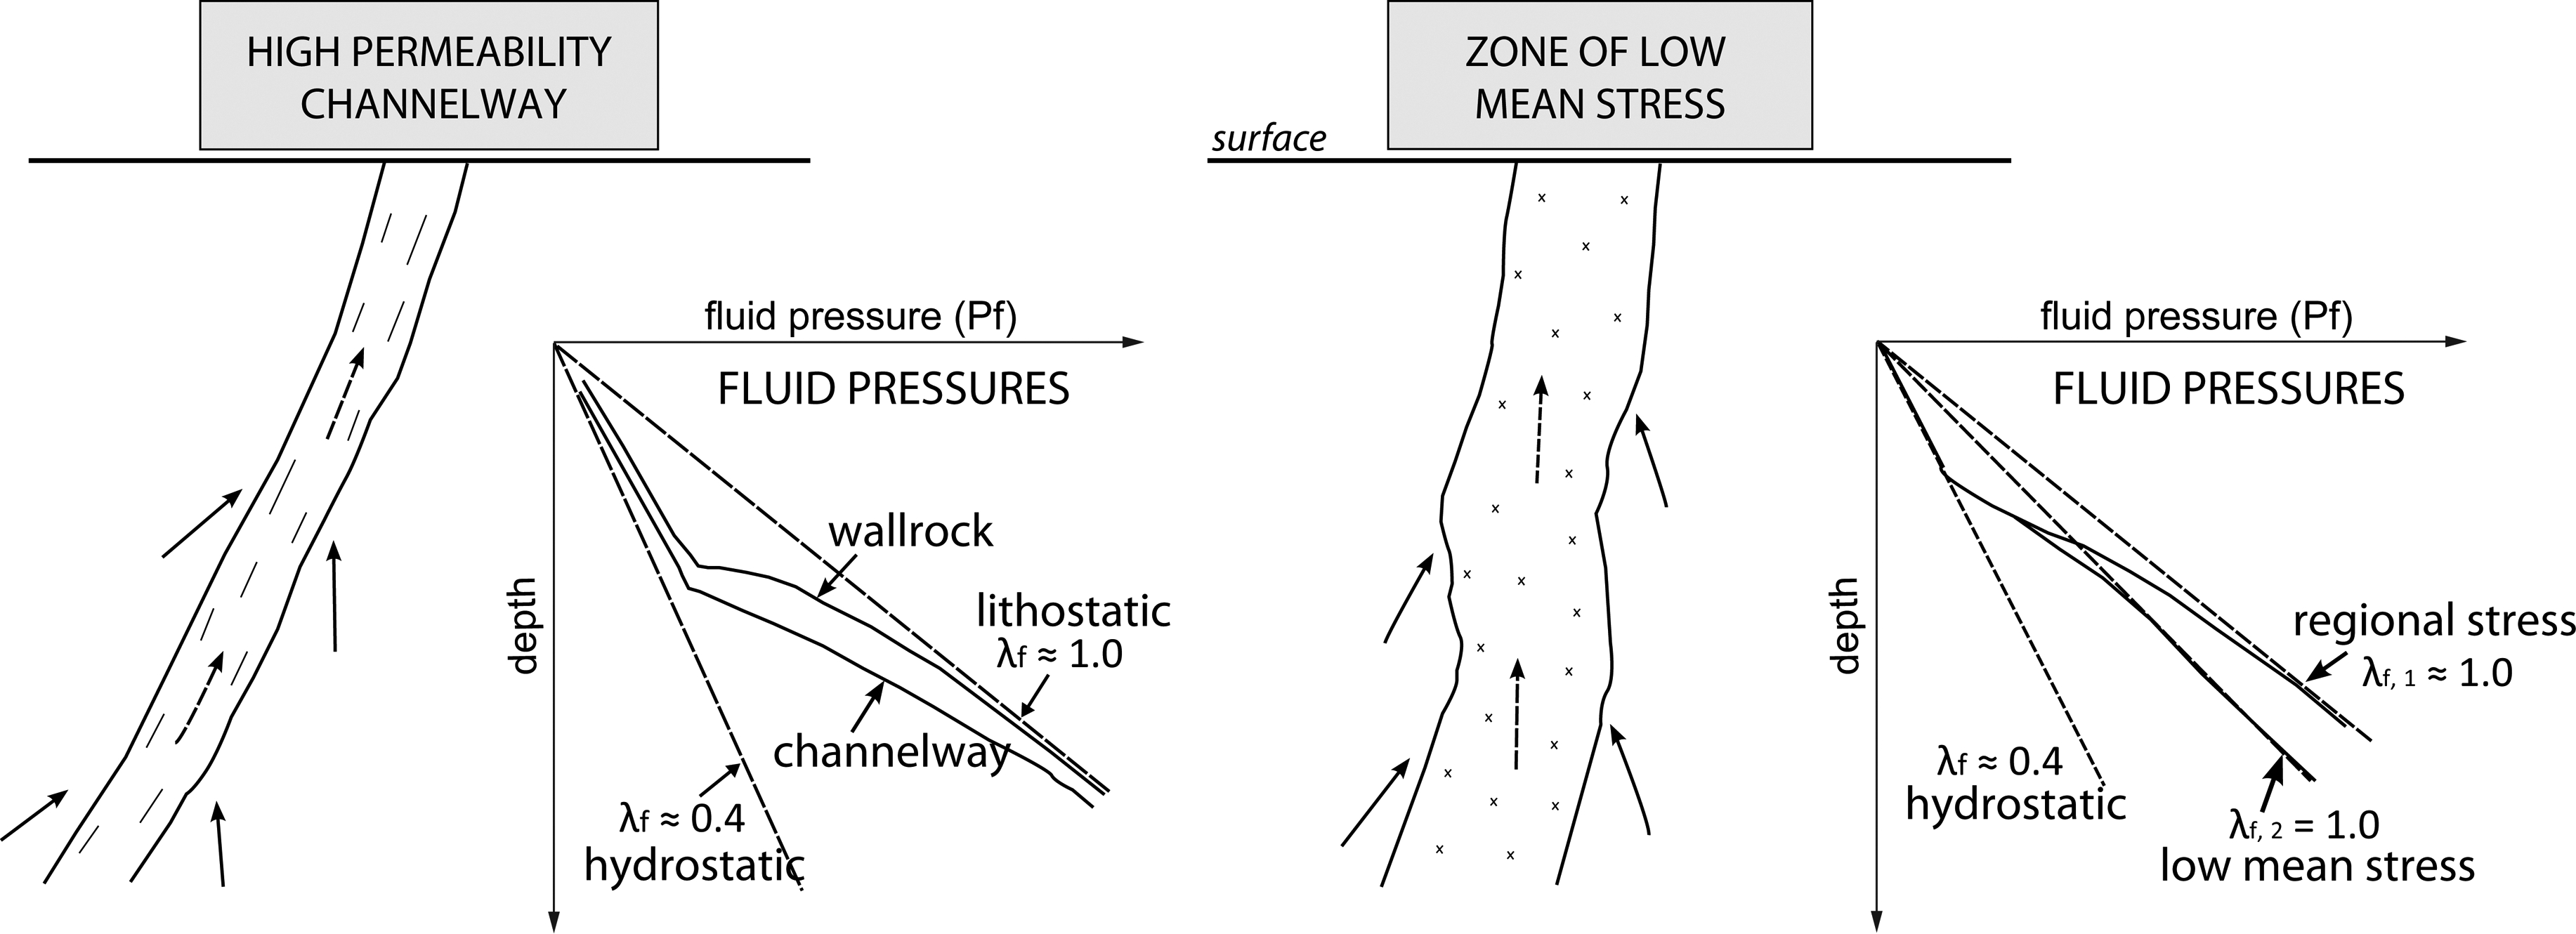
Schematic diagrams of control of fluid-channelling, illustrating both high-permeability and low mean stress-driven models (Ridley 1993)
Variations in mean rock mass stress develop at all scales. A low mean, rock stress will maintain a lower fluid pressure, relative to the surrounding rocks, but enable local over-pressure deformation with flat veins and reactivated steep faults (Phillips 1972; Ridley 1993). High effective mean stress in the surrounding rocks is associated with fluid flow from high-stress to low-stress ore positions. Thus, variations in mean stress are the main control on fluid flux and gold location.
To convert this theory into an exploration method requires an understanding of stress variations in the rock sequence (Ojala, Ridley, Groves and Hall 1993). Modelling of Strömgárd (1973) showed development of a large shear zone along one side of the rigid object, with opposite sense of movement on the different segments and low mean stress sites facing the maximum principal stress. Layered sequences control the position of low mean stress sites by orientation between layers and stress field, and competence contrast between alternating layers (Strömgárd 1973). In the case of layer-parallel extension, the relatively competent layer(s) will show the distribution of lower mean stress sites. In contrast, in layer-parallel compression, the lower mean stress sites will develop in least competent layers. In geologically complex areas, stress field and consequently low mean stress sites will be controlled by a number of factors such as competence contrast, size and mutual position of different rock types, and the presence, orientation and size of faults and fractures.
As shown by Sibson (1987); Hodgson (1989) and Hronsky, Ridley and Cathcart (1991), positions of low mean stress are dictated by irregularities along the fault zones (e.g. dilatational jogs, releasing bends, tension gashes and Riedel shears), changes in orientation of the shear zones and areas of fault intersection. The low mean stress sites and areas of potential gold precipitation may be given by the rheological factors, such as a presence of a more or less circular rigid body. This paradigm is a numerical extension of the (above) intersecting sites of complexity paradigm. The sites of complexity are by their very nature sites of low mean stress. The calculation of the stress field is a concise tool in exploration for mineral deposits. In this way, stress maps indicate areas of low mean stress (Ridley 1993). The identification of areas of low mean stress, and enhanced fluid flow and sites of possible gold precipitation, is a critical exploration tool (Ridley 1993; Vearncombe and Holyland 1995). The low mean stress sites usually range between two end members: low mean stress areas related to structural discontinuities, fractures, fault and shear zones, and low mean stress domains associated with rheology, differences in adjacent rock masses. As indicated before, sites of low mean stress have a huge range of different geometries and possible origins, being dependent on rheology or structural discontinuities. Moreover, as shown in the recent literature, understanding and simulating the potential partitioning of stress and strain during deformation can provide robust structural targets for exploration (McLellan et al. 2012). Accordingly, geo-mechanical modelling using mean stress controls can greatly enhance the understanding of structural evolution of many structurally controlled mineral deposits, particularly the sequence of events that led up to, and followed, mineralisation events. This kind of approach, given by application of finite element analysis and discrete element modelling (McLellan et al. 2012) highlights the structures that are most important for mineralisation.
The low mean stress paradigm provides a critical explanation tool for the wide variety of mineralised sites, and a methodology for gold exploration in deformed terrains. The technique of stress modelling and mapping provides bullseye anomalies (Vearncombe and Holyland 1995; Holyland and Ojala 1997; McLellan et al. 2012). Therefore, stress mapping is a computational method for detection of low mean stress areas, favourable for deposition of gold. But, it is our observation that rarely is the product more than a sophisticated highlight of the most complex geometry and the location of significant rheology contrasts. The targetting of the computer program can usually be achieved by simple examination of the geology map picking the most complex positions.
Earthquake Analogy (1990s–2000s)
Fault systems behave episodically, shifting between fault activation and high permeability and fault healing by precipitation of hydrothermal fluids and a dramatic decrease in fluid flux rate. This cyclicity is described by Sibson, Robert and Paulsen (1988). Accordingly, mesothermal gold deposits are products of large-volume fluid flow and a fault-valve mechanism. This mechanism is given by alternating periods of seismic, and inter-seismic activity characterised by increase in fluid pressure and precipitation of minerals from hydrothermal fluids. An increase of fluid pressure may trigger an earthquake and almost instantaneous permeability of the rock mass followed by a lowering in the fluid pressure. Subsequent to the earthquake, during inter-seismic period, mineralisation precipitation may and hydrothermal sealing of the fault will occur, leading to the new fluid-pressure increase, and again, a repeated earthquake (Fig. 14). Importantly, understanding the cyclicity and seismicity of the crust may be a key to understanding different types of mineralising environments (Sibson 1996). For an effective mineralisation system and fluid flow, a local high-permeability is required, usually associated with low-displacement faults interlinked with extension and transtensional fractures (Sibson 2002; Hill 1977). Cox and Ruming (2002) described these structures and related gold-mineralisation as a product of earthquakes and aftershock events, and their activity as related to reiterated large-slip faulting, on nearby crustal-scale faults and shear zones. A mesh system (geometrically described by Hill 1977) may develop under different tectonic régimes and usually require a high fluid pressure. In extensional regimes, the sub-vertical extensional structures are interlinked with steep conjugate system of normal faults. In a compressional régime, sub-horizontal extensional fractures are interlinked with gently dipping thrust faults, showing conjugate geometries. In strike-slip regimes develop subvertical extensional fractures interlinked with strike-slip faults (Sibson 1996). Within the extensional tectonic régime, extensional fractures may develop under hydrostatic fluid pressure to a depth dependent on rock tensile strength. But, extensional fracturing in a compressional régime requires stress heterogeneity or supra-lithostatic fluid-overpressure. Elevated fluid overpressure, at certain depths of extensional–transtensional regimes and at all depths for all other regimes, is required (Sibson 2002) 15 .
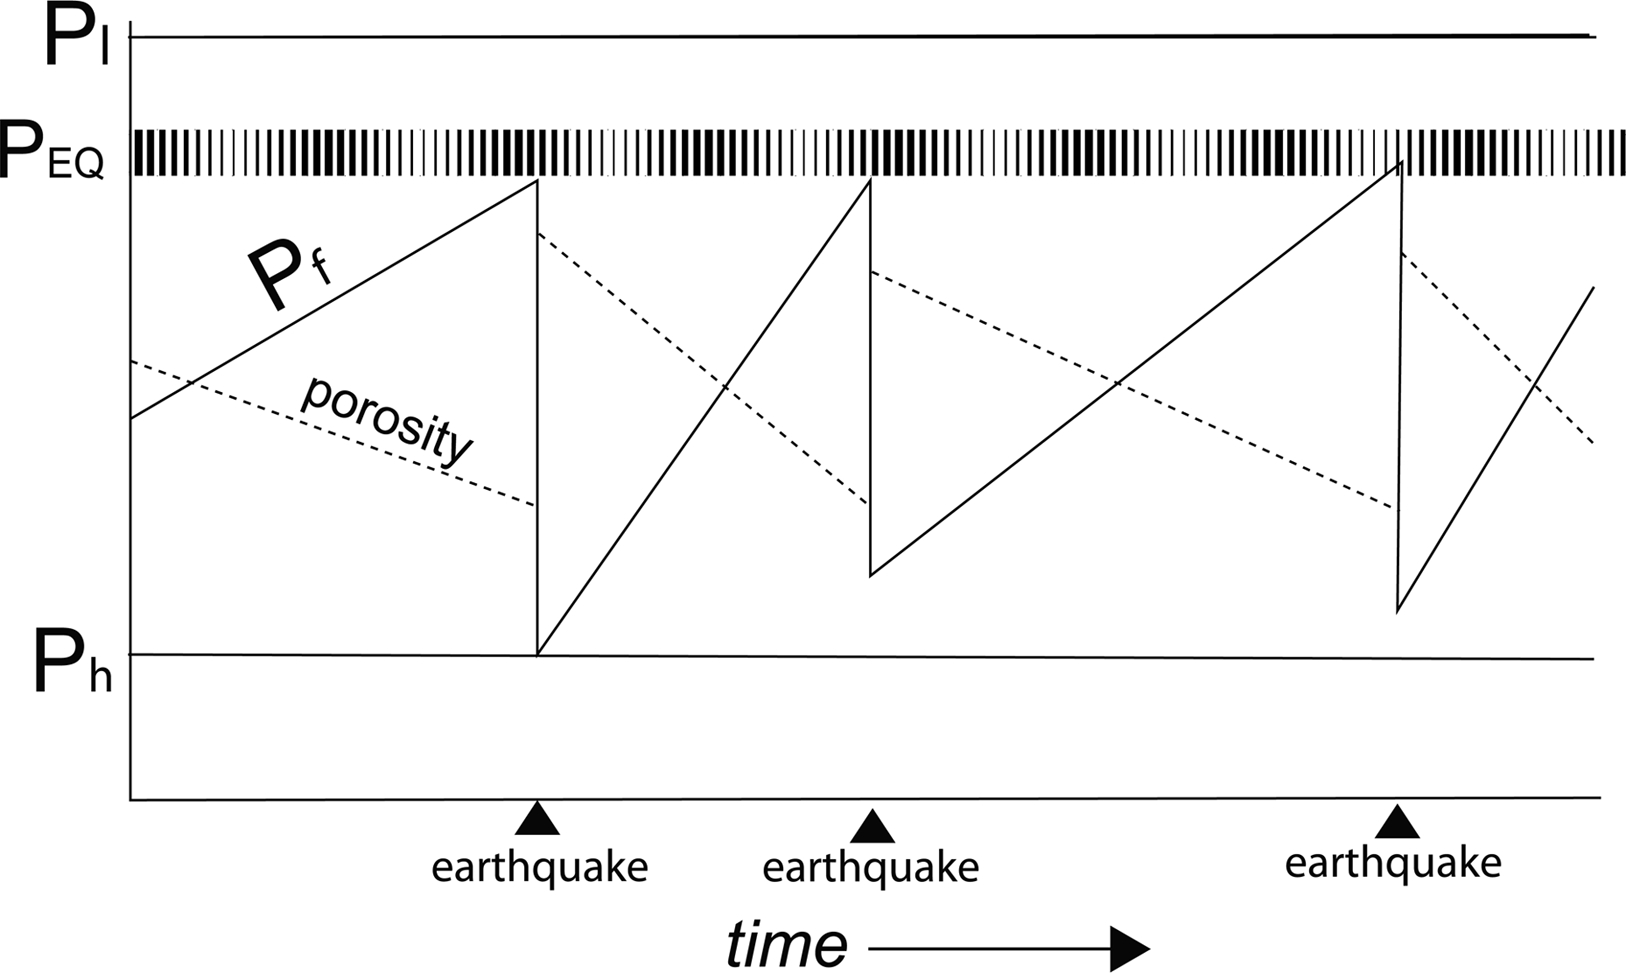
Fault-valve mechanism, given by the alternating cycles of increase and decrease of rock permeability, fluid pressure and potential mineral deposition, synchronous with earthquakes illustrated by solid black lines triangle (from Hacker 1997, based also on work of Sibson 1992). The cyclicity is characterised by alternating inter-seismic episodes when the fluid pressure reaches the levels high enough to initiate an earthquake, followed by seismic periods, given by almost instantaneous increase in permeability of the rock mass and lowering in the fluid pressure
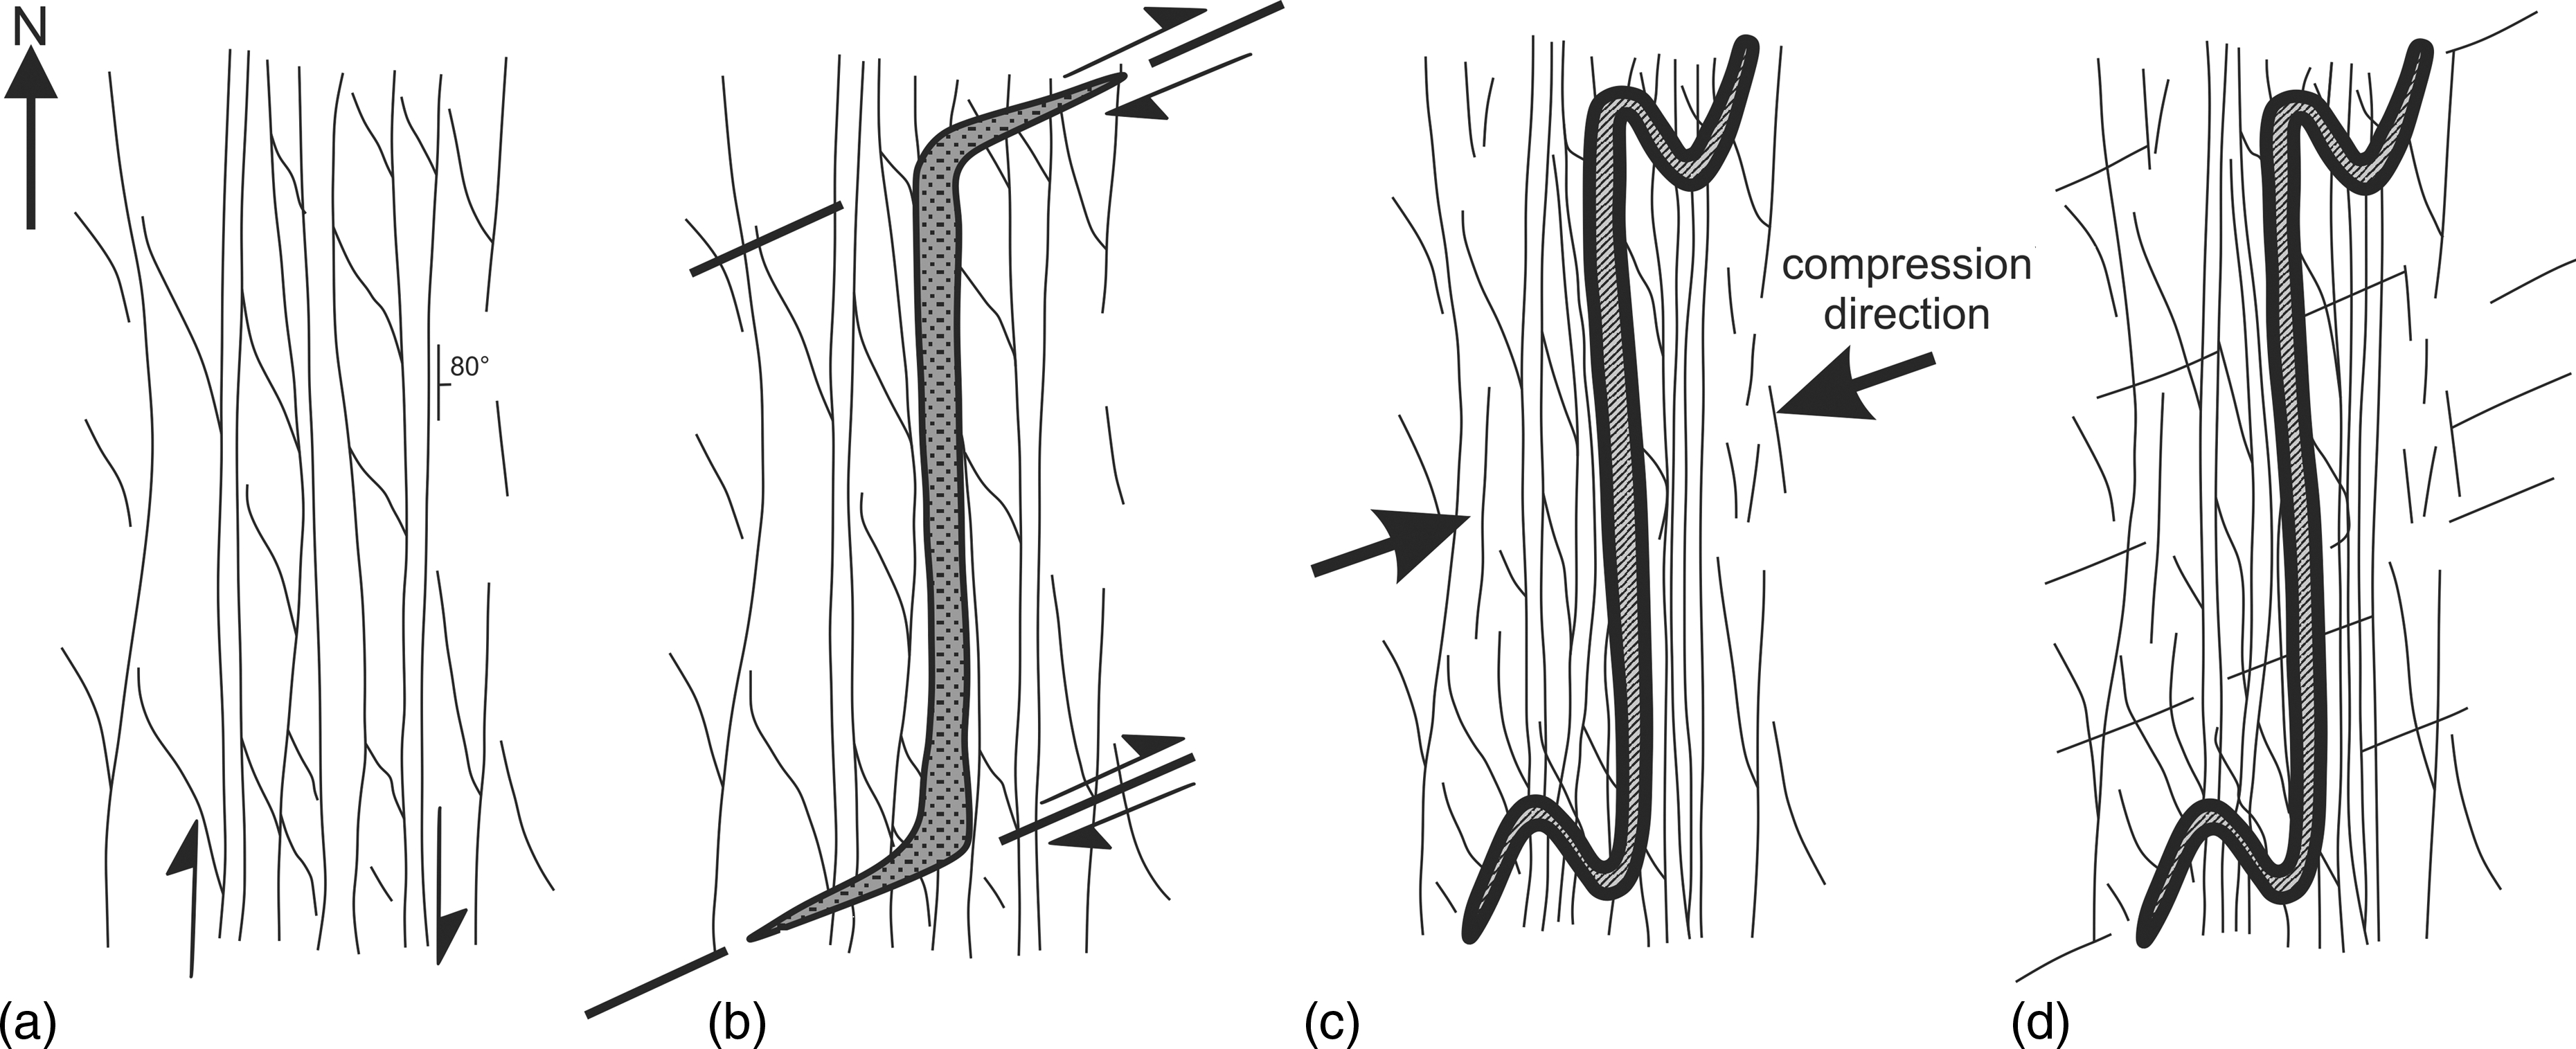
Western Zone, Bronzewing, evolution showing the interaction of cyclic deformation (Vearncombe et al. 2005): a The initial dextral shear zone. These shear zones are generally regarded as D3 in the Yilgarn and are assigned that deformation in published schemes for the Yandal Belt; b Cross-faulting, usually regarded as D4 is refracted along the pre-existing shear zone with development of the schistosity parallel quartz lode limited to north and south by the cross-faults; c Further compression across the deformation zone results in folding of the Western Zone limbs. Folding is commonly referred to as D2 or D3 (see Table 1 in Vearncombe 2000); d The geometry of Western Zone as it occurs today with superposed cross-fractures with minor displacement. These cross-fractures are typically regarded as D4. The Western Zone is about 150 m long (N–S). Note, however, that this paradigm requires a holistic understanding and approach. Phrased simply, older structures can be re-activated during younger deformational phases and transposed into the younger fabric
This paradigm explains the low-metamorphic grade, brittle to brittle-ductile terrains, but is not providing an explanation for gold hosted in terrains at higher (deeper) metamorphic grades. Moreover, 3D mesh structures will have more complicated geometries than the 2D examples presented and illustrations in the paradigm relevant papers. From a practical point of view, in the exploration process, it is challenging to determine which structures are syn-mineralisation and which ones are related to pre- and post-mineralisation deformation. The paradigm provides an excellent understanding of the features in the regional and local geology of provinces and gold mines, but does not readily translate that understanding into an exploration model.
Detailed textural chronology
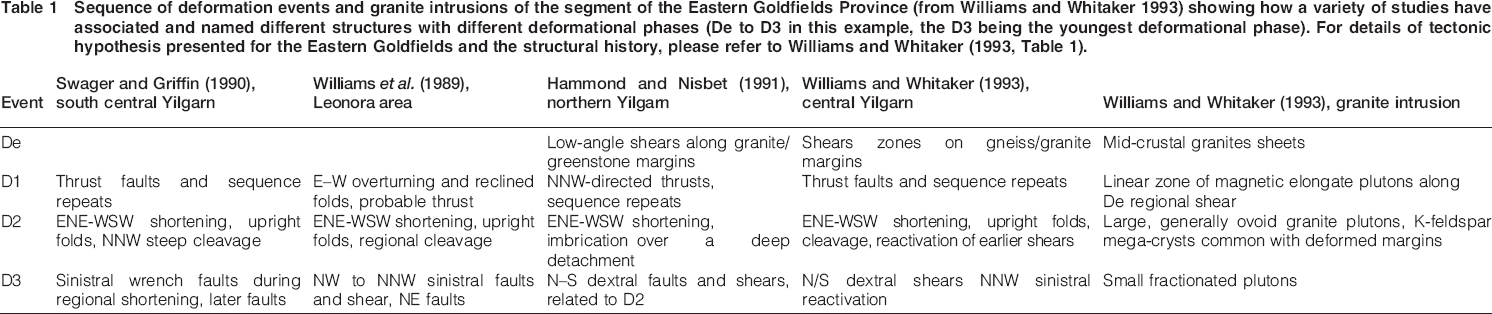
The process of detail and micro-detail documentation in textural chronological sequence follows from the early methods of Bowes (1971) and more recent work of Bell (2010) and is applied to gold deposits and particularly the goldfields of Western Australia (Williams and Whitaker 1993; Miller, Phillips, Watson and Dugdale 2005; Miller and Nugus 2006). Authors include this methodology here, not to suggest or imply that it is a paradigm (which it is not), but because the method yields a significantly different product. The recording of field observations in terms of deformation events or D numbers can be both convenient and effective for communication, but the method ignores several fundamentals of deformation. Deformation is progressive and textural elements form over a period of time often overlapping in the same way that human generations overlap. Second, deformation effects vary with the orientation of the initial feature such as dykes or quartz veins. In simple shear, one quartz vein may buckle and another may extend by boudinage the difference being only their initial orientation relative to the shear zone boundary (Ramsay and Huber 1983). In well exposed and documented terrains, it is often difficult to correlate deforming events over hundreds to thousands of metres (McClay and Coward 1981). That some authors attempt to achieve D correlation in the poorly exposed terrains (such as the Yilgarn Craton) over tens to hundreds of kilometres reflects on the lack of intervening rock and high-level of interpretation. From the Western Zone of Bronzewing gold deposits, Vearncombe (2000) show how a fold typically regarded as D2 (see Table 1) can be after both D3 shearing and late D4 faulting that is not always recorded, making a farce of this methodology (Fig. 15).
Sequence of deformation events and granite intrusions of the segment of the Eastern Goldfields Province (from Williams and Whitaker 1993) showing how a variety of studies have associated and named different structures with different deformational phases (De to D3 in this example, the D3 being the youngest deformational phase). For details of tectonic hypothesis presented for the Eastern Goldfields and the structural history, please refer to Williams and Whitaker (1993, Table 1).
Conglomerate-related (early 2000s to recent)
In many provinces in Canada, gold mineralisation and deposition of conglomerates are fault-controlled. These conglomerates may be used as a proxy for gold mineralisation. This paradigm is built around deposits of the Superior Province in Canada and their associated clastic sedimentary sequence, the Timiskaming polymict conglomerates in the Abitibi greenstone belt (Robert, Paulsen, Cassidy and Hodgson 2005) (Fig. 16). The paradigm has been found relevant in Ghana with the Tarkwaian quartz pebble conglomerates in the Birimian Shield and in the Yilgarn in Western Australia. Examples from the Neoarchaean of the Kalgoorlie district, Western Australia are presented by Tripp (2013). According to this paradigm, gold mineralisation is concentrated in narrow zones above the metavolcanic rock sequences. The examples from gold-rich Superior Province Canada, and Yilgarn, Australia show that orogenesis and gold deposition in each craton are marked by a shift from dominantly volcanic processes to clastic deposition above unconformities, followed by granitic plutonism and progressive deformation (Robert et al. 2005). Crustal shear zones are important since they acted as long-lived structures, which acted as magma and fluid conduits, and subsequently as a major control of the clastic sedimentation (Fig. 17). Formation of gold deposits is characterised by multiple phases of extensive alteration and mineralisation, shallow-level porphyritic intrusions, deformation, and deposition of coarse clastic rocks (Hutchinson 1987; Robert et al. 2005) (Fig. 17). Exploration attention may be focused towards unconformities and their overlying coarse clastic strata of polymictic conglomerate, and underlying volcanic sequence. Examples of large gold deposits that occur near the unconformity include Kalgoorlie Western Australia (Hutchinson 1987; Robert et al. 2005; Tripp 2013). Thus, the unconformity is a key guide for exploration that can be used in Archaean terrains of the Yilgarn and Superior Province.
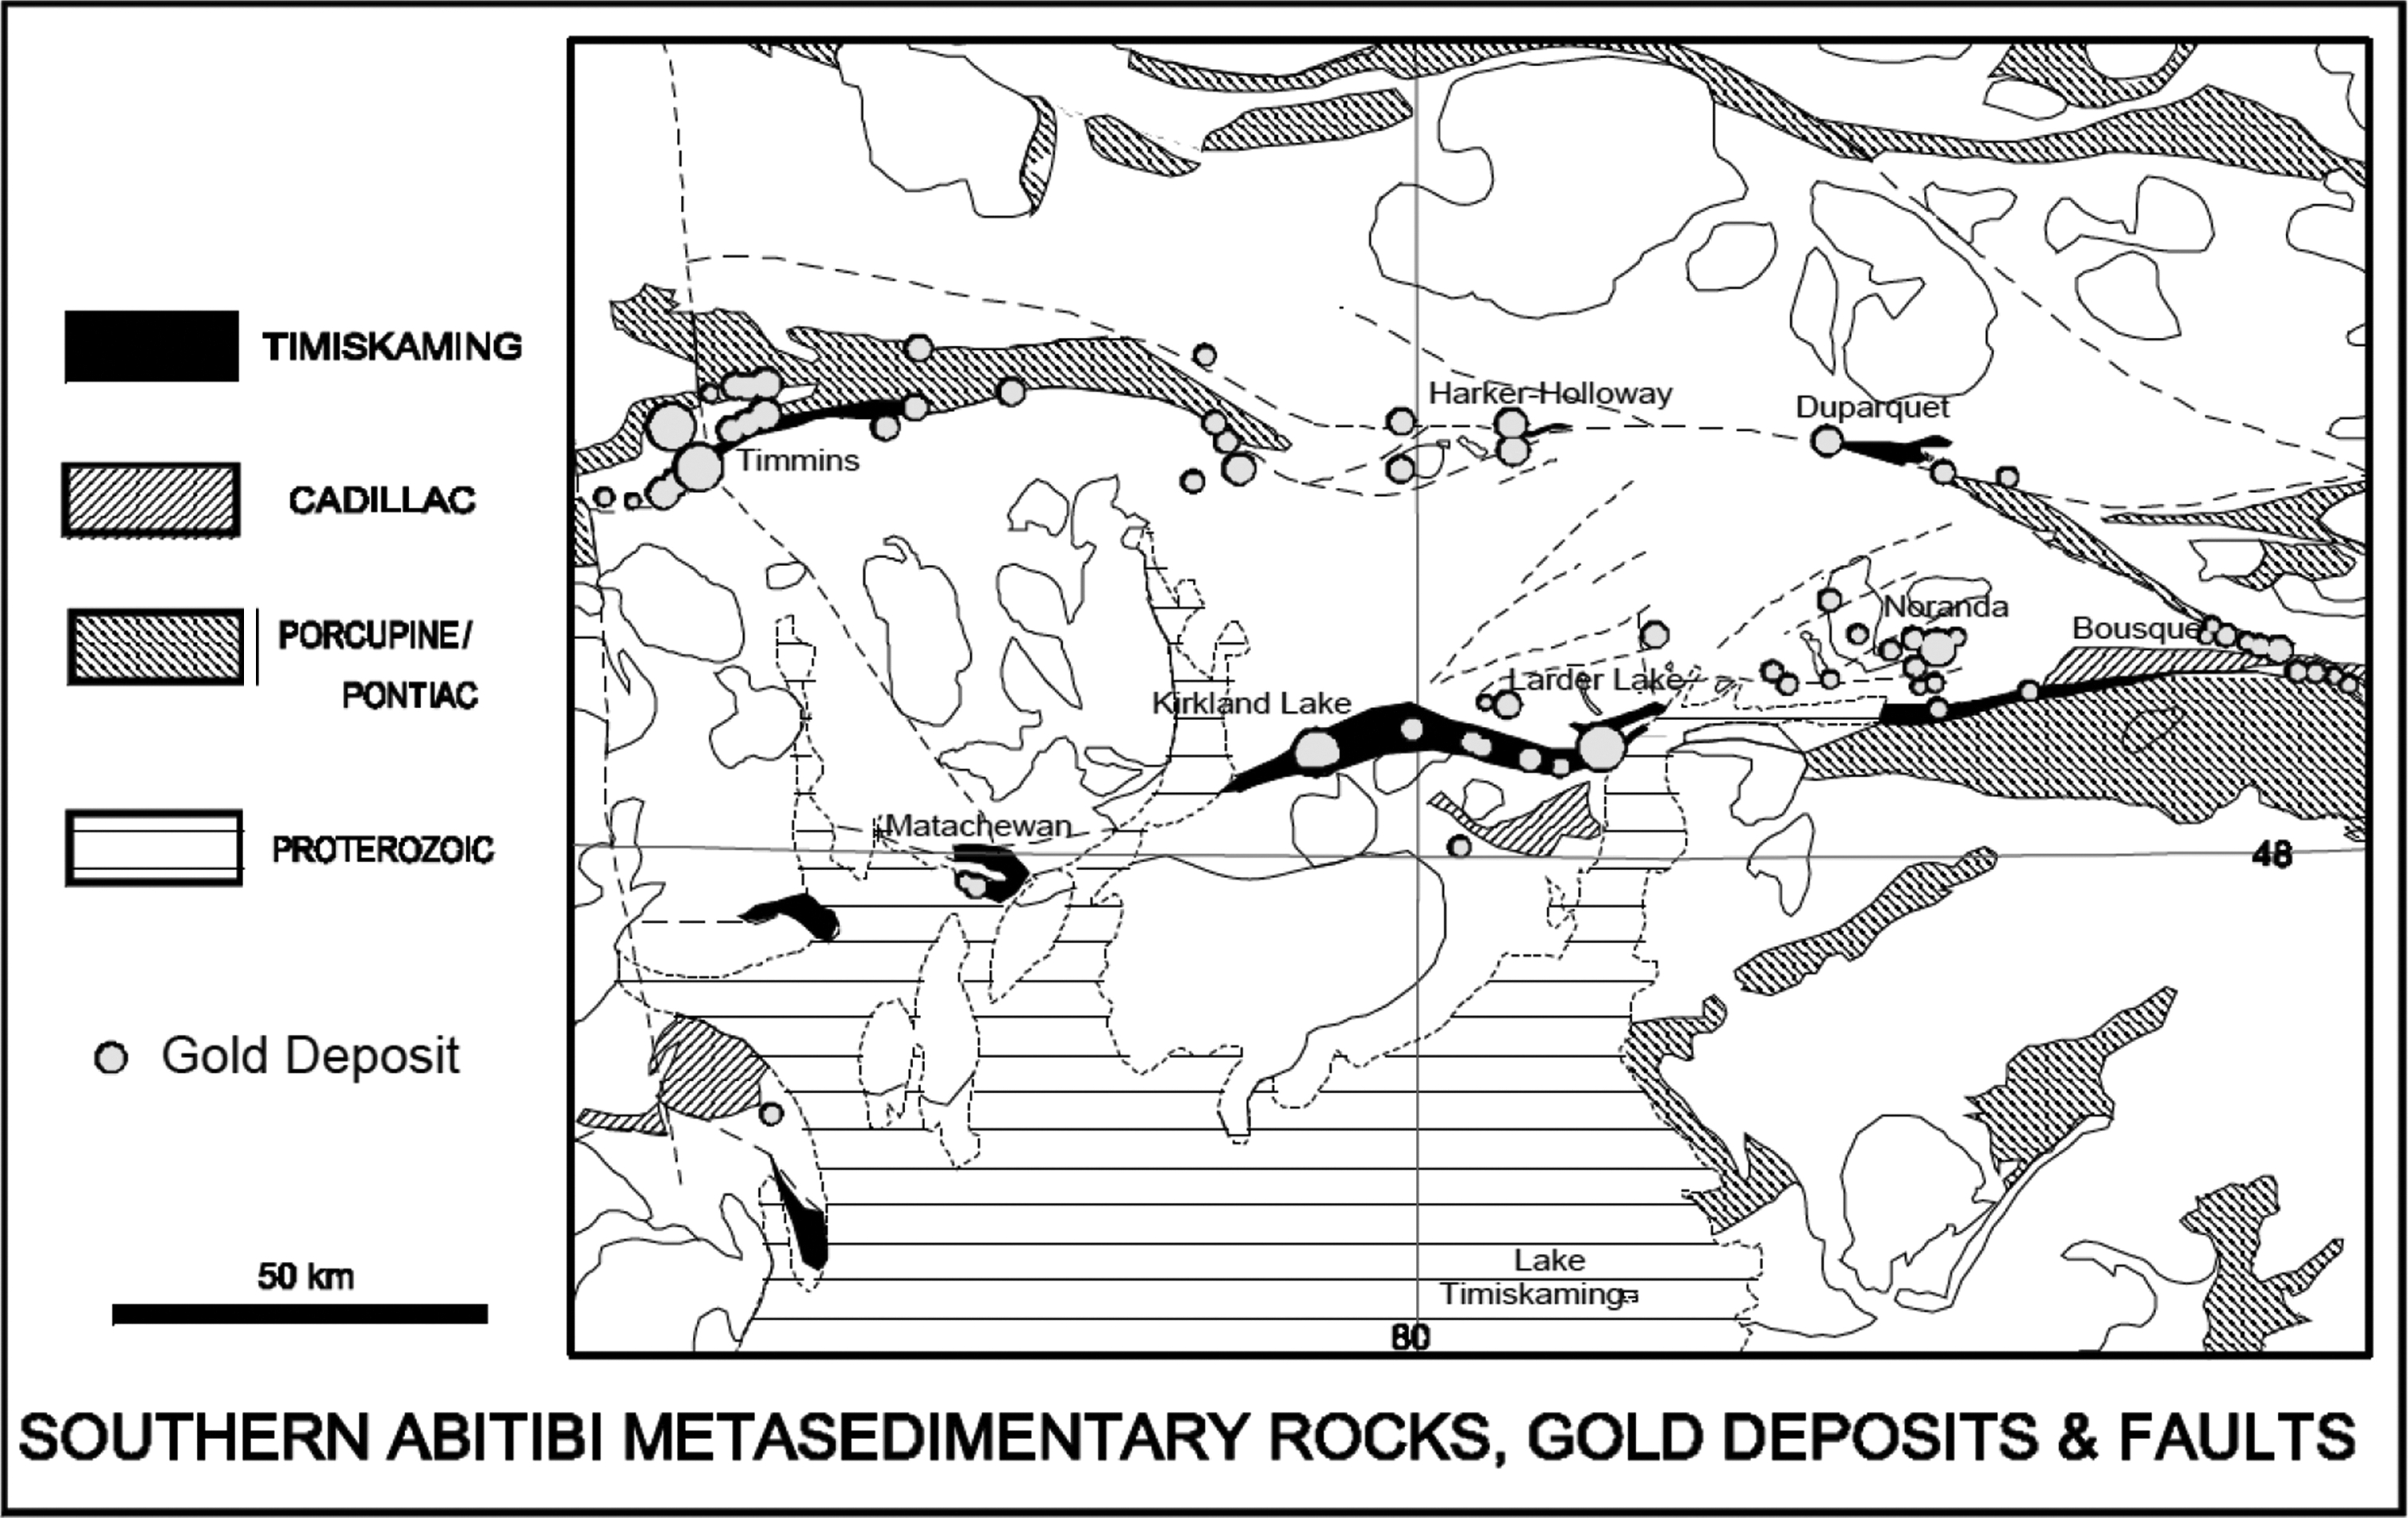
Schematic map showing distribution of gold deposits, faults and conglomerates in the Southern Abitibi (Canada) metasedimentary rocks (Robert et al. 2005)
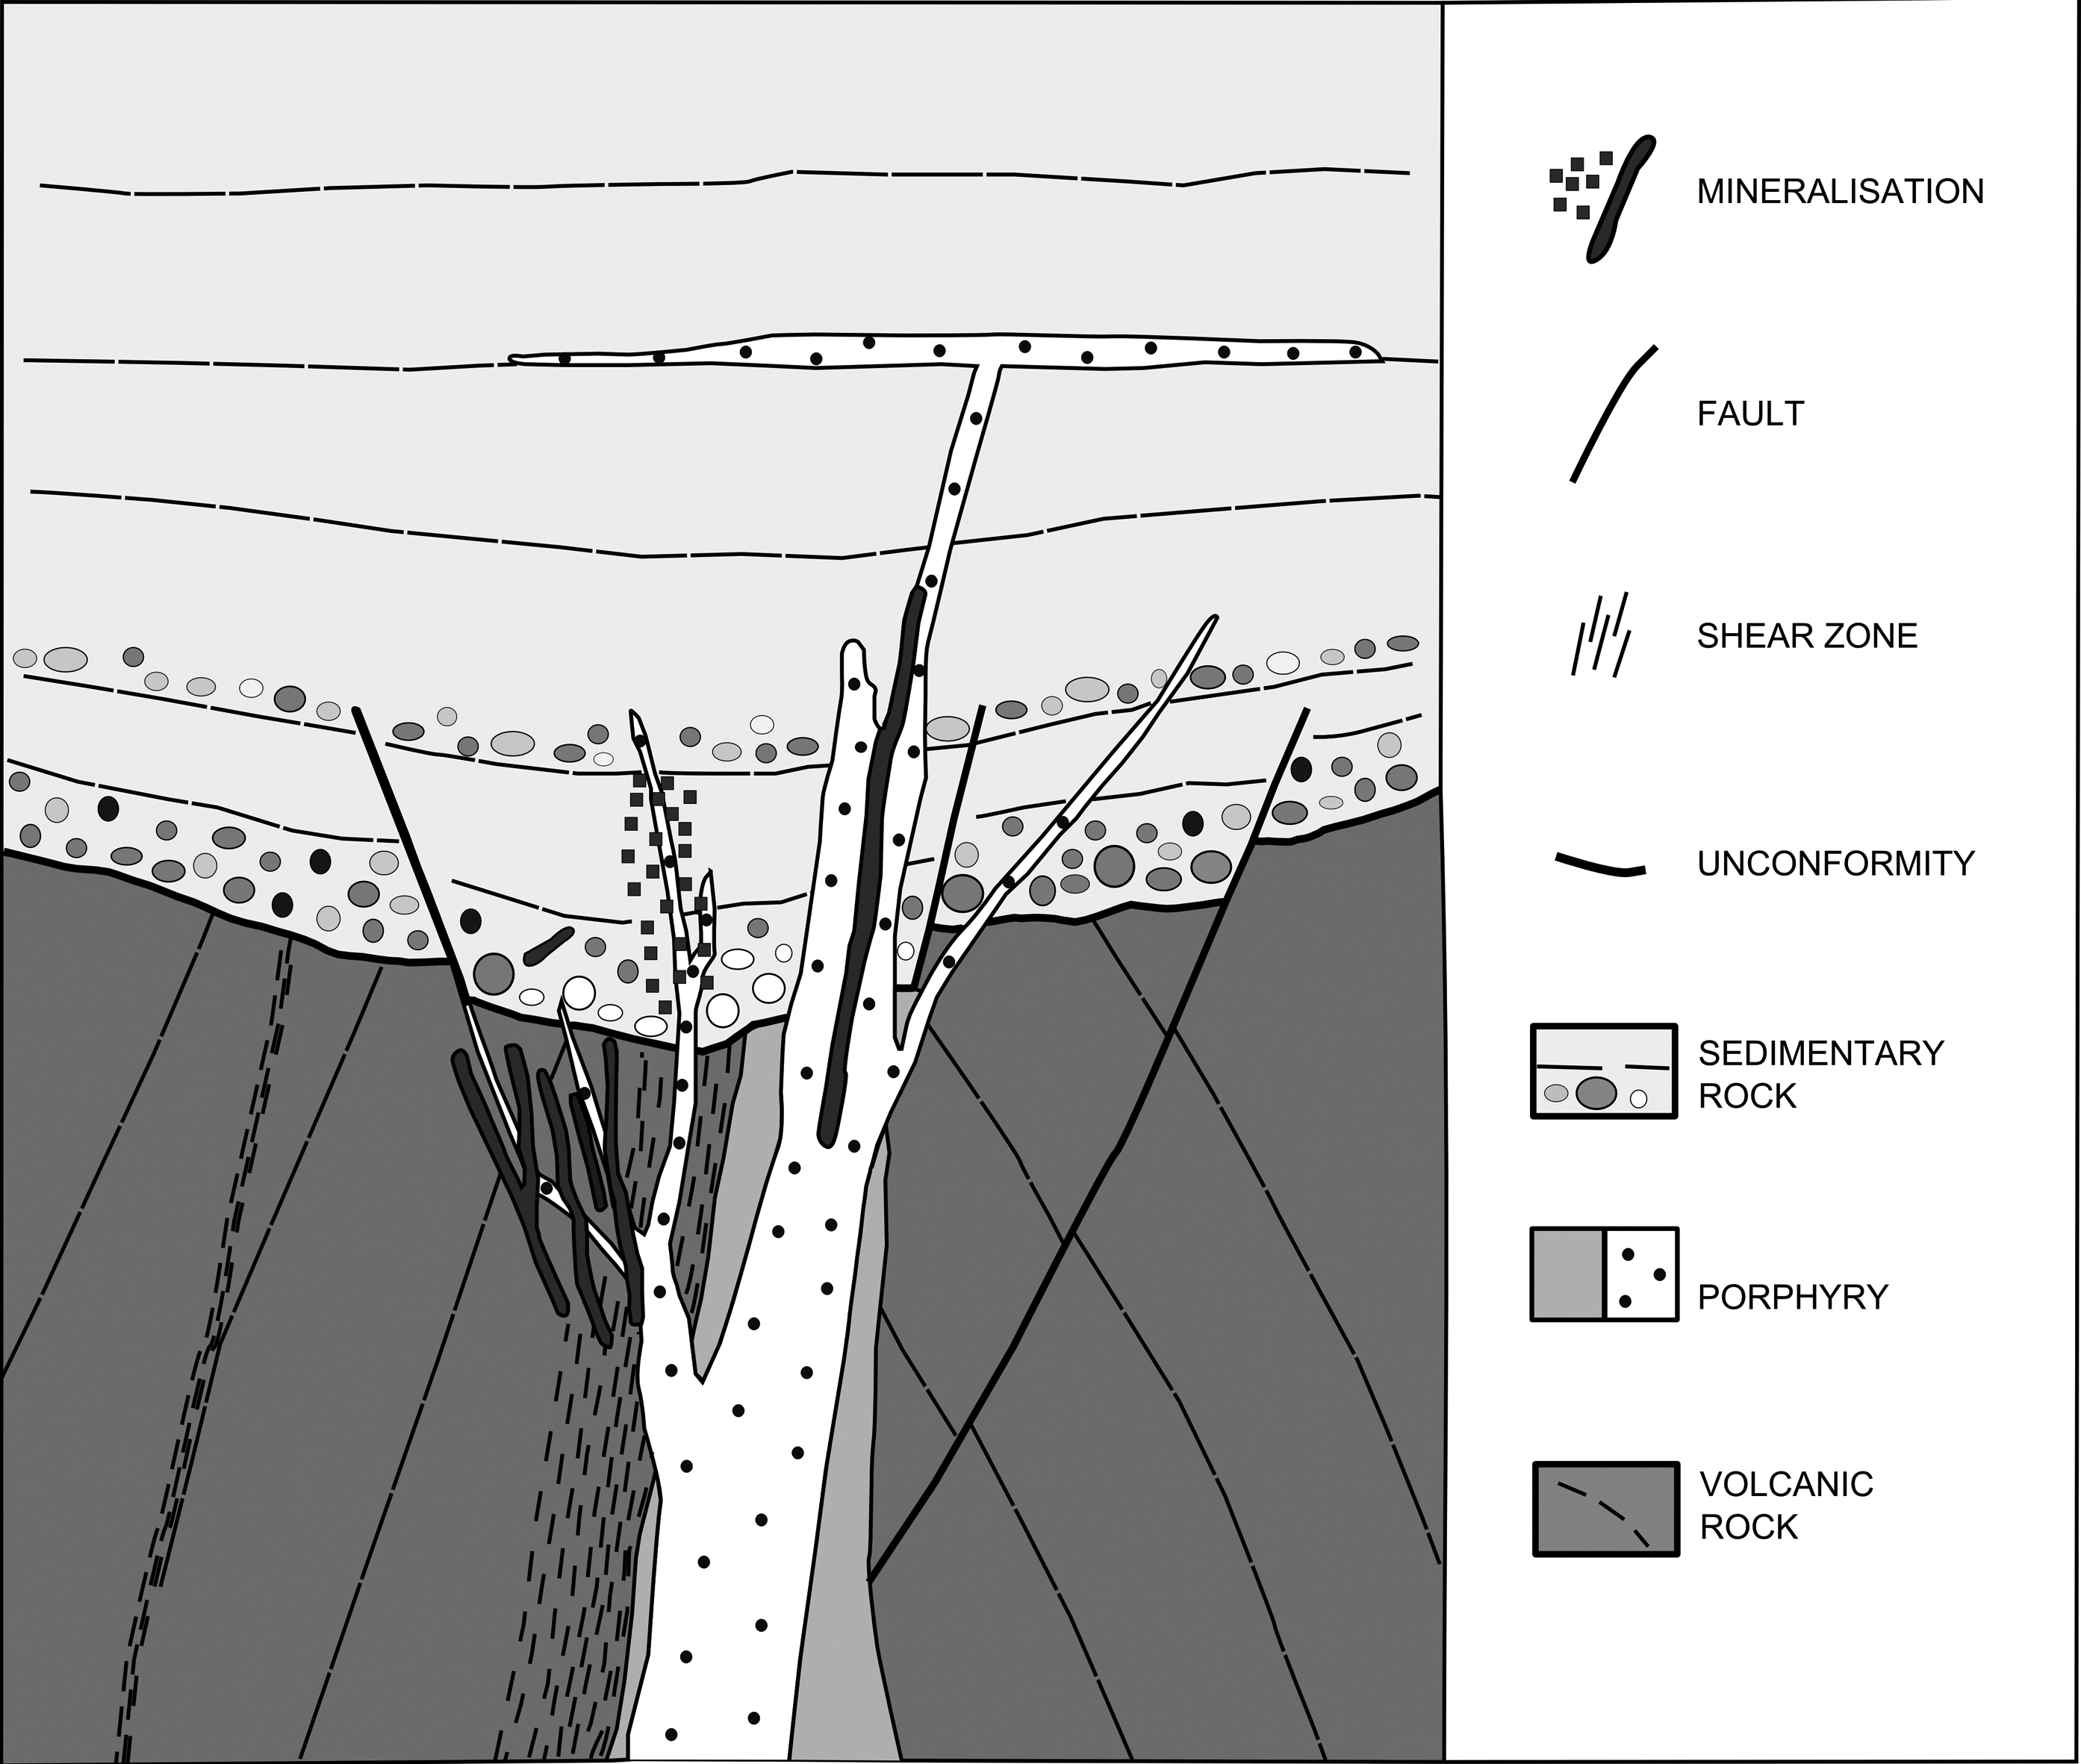
Schematic geologic model of distribution of the gold mineralisation in greenstone belts, associated with high-level porphyry intrusions and unconformities at the base of conglomeratic sequences (Robert 2001)
For the exploration for gold deposits in Archaean terrains, understanding the magmatic processes and clastic sedimentary processes is the critical step in the exploration. As presented by Robert et al. (2007), both typical greenstone-hosted gold deposits and atypical (do not correspond to the traditional orogenic model) greenstone deposits, are usually marked by conglomeratic sequences located above the unconformity (Fig. 17). Importantly, geological field mapping is a main tool for understanding of regional and local stratigraphy, petrography and structural history of the terrain. A careful stratigraphical analysis can help in detecting the major unconformities and drive exploration towards the horizons of coarse clastic rocks, and conventional geochemistry remains an important tool in targetting prospective areas.
Rapid energy transfer: Self-Organising Systems (recent)
This paradigm, described and developed by Hronsky (2011) describes the mineralisation events using an analogy with the natural self-organising systems (SOC; i.e. lightning). The concept is that natural systems organise themselves in order to maximise their entropy production. The ore-deposits are formed after the anomalous dynamics (Fig. 18) during the evolution of large-scale flux systems controlled by geodynamics, lithospheric architecture, and litho-stratigraphy. The main characteristic of the self-organising systems is that they are scale-independent with scale-invariant power-law behaviour and fractal geometries (Bak 1996). Another important feature of SOC is that they are dynamic, episodic (cyclic), and characterised by a constant, slow input of hydrothermal fluids in the system, followed by a sudden release of energy and production of breccia and hydraulic fracturing, associated with mineralisation in a successful system (Cox 2005; Hronsky 2011; Sibson et al. 1988). The transition between two events is correlated with the presence of the local threshold (barrier) and energy release (mineralisation) that can occur only if the barrier is overcome. In spite of the complexity of the system dynamic, Hronsky (2011) proposes that the prediction of the mineralisation sites is influenced by the heterogeneity of the barrier. ‘Avalanches’ (i.e. sudden release of energy) nucleate where the net threshold barrier is smallest. Hronsky (2011) states that for the deposition of metals, a focused fluid flux and anomalous dynamic processes are required and the only mechanism, which can produce this type of concentrated flux in the Earth's crust, is SOC (Cox 2005; Cathles and Adams 2005; Hronsky, Groves, Loucks and Begg 2012).
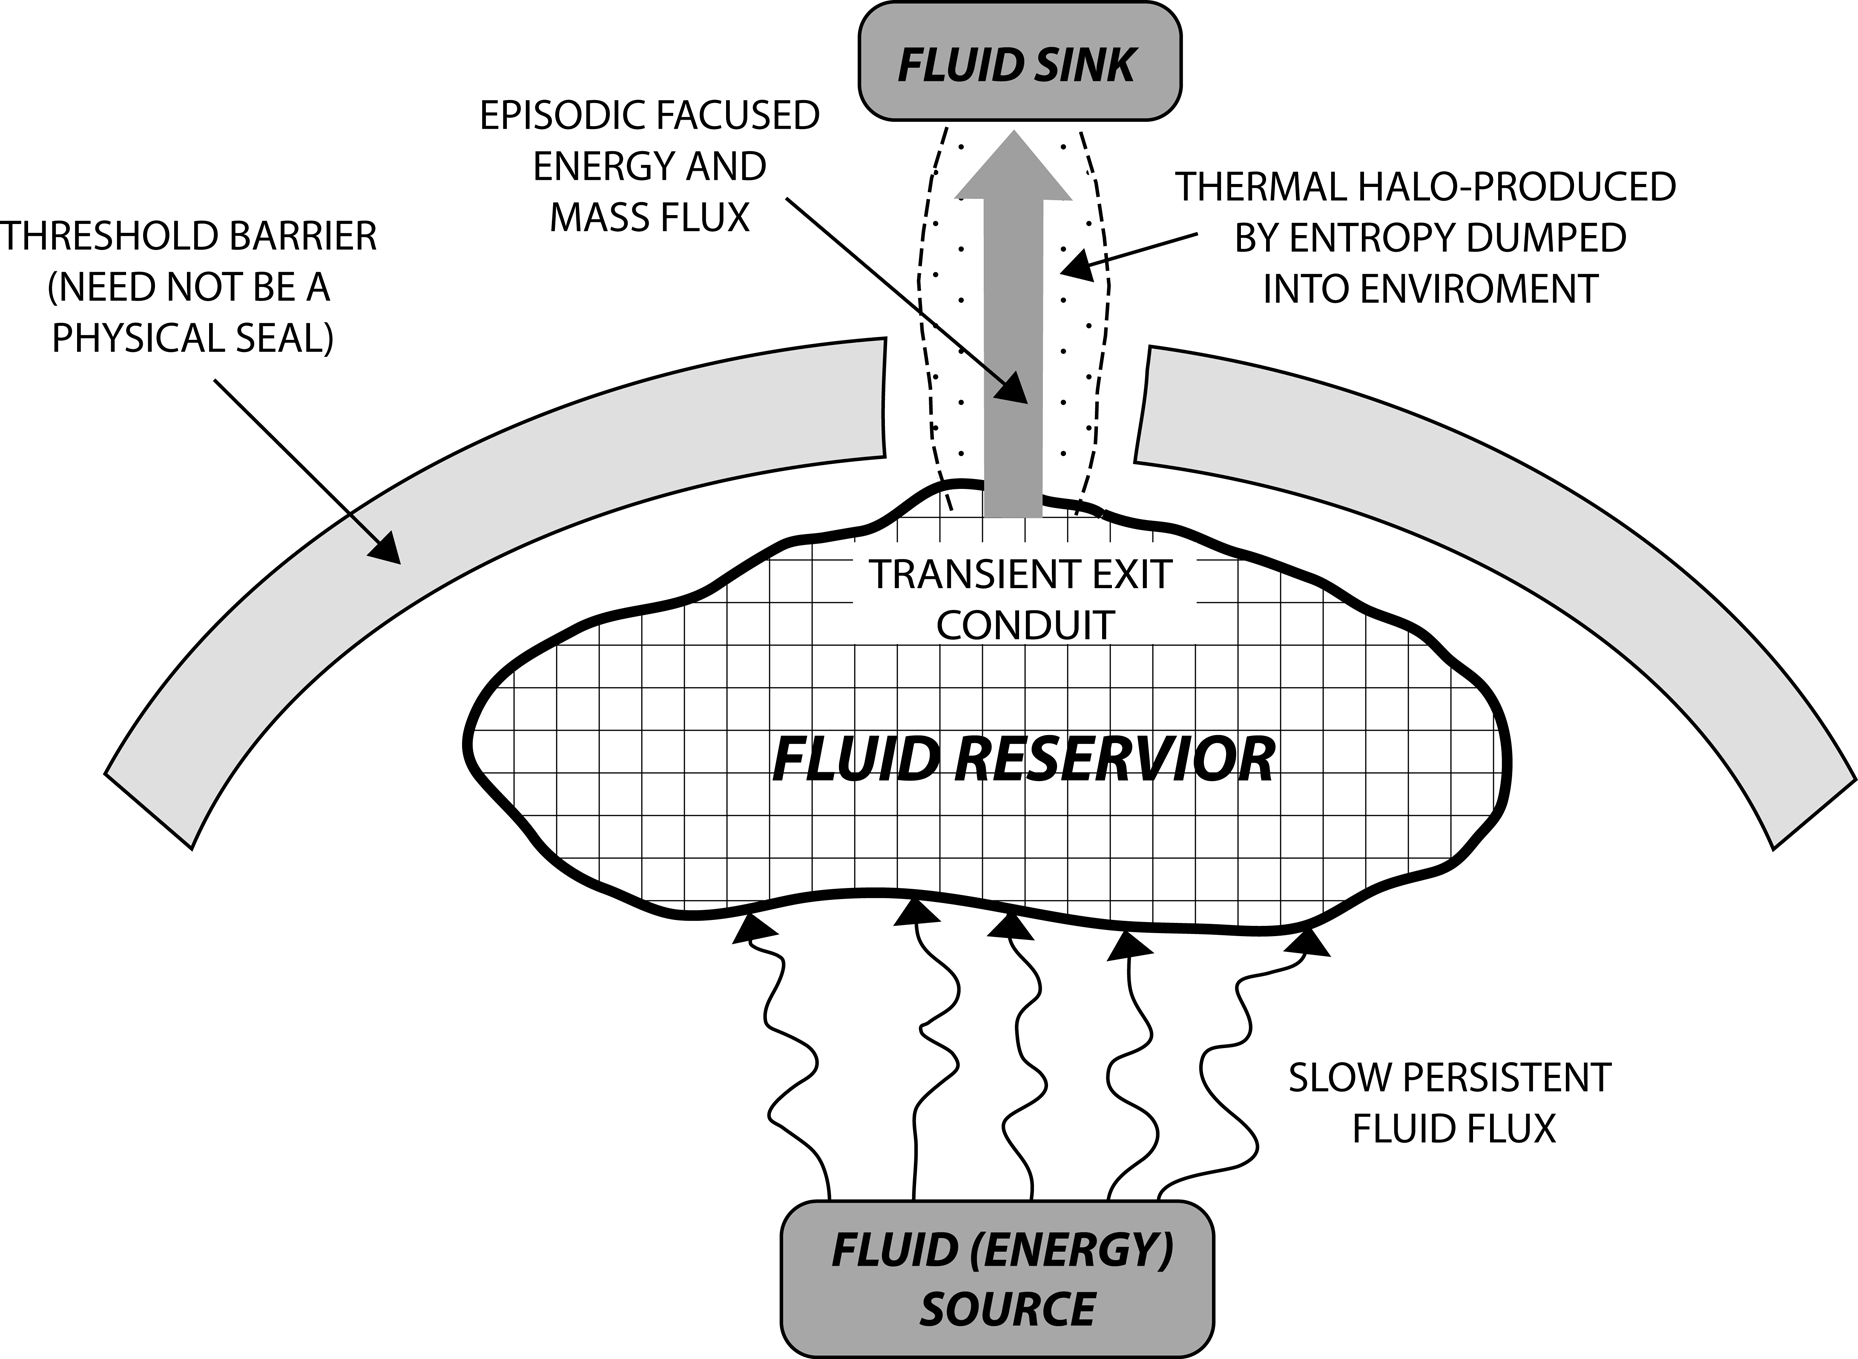
Genetic, simplified general model of ore-forming self-organising systems (modified after Hronsky 2011)
Success in exploration, according to this paradigm, is governed by the ability to recognise fluid exit conduits, which represent rock masses with high fluid flux, and not exclusively and necessarily structurally related pathways. This paradigm is fluid-centric, not a structure-centric system, as many of the above paradigms are. The sites of fluid exit are given by domains of the rock mass fractured and deformed showing extreme (transient) permeability developed when the pressure pulse broke to the surface. Because stress changes associated with the fluid flux are large, it is difficult to predict structures before initiation and thus also mineralisation sites (Hronsky et al. 2012). Moreover, ore-bodies are more extensive vertically than the hosting structures. Therefore, the main focus of the exploration must be on 3D rheology-structure study of the rock mass above the source reservoir or threshold barrier. Some geometric patterns of rock distribution are consistently more favourable, most notable where steeply orientated brittle pipe-like rock volume occurs within a weaker wall-rock sequence. Many ore deposits show dynamically emplaced pipe-like geometries. Examples in Western Australia include Wallaby and Sons of Gwalia. Kalgoorlie is a combination of multiple pipe-like bodies such as the Oroya Shoot. The brittle rock is more favourable and behaves like a lightning rod for the propagating fluid pulse to get to the surface, analogous to a lightning strike transferring energy pulses to the ground. However, despite difficulties in recognising the different range of structures produced by fertile fluid flux, recognition of multiple pulses of intense fluid flow (different generations of breccia and veins), and the detection of threshold barriers are the key exploration guides (Hronsky 2011). These barriers include antiformal structures that create a fluid seal, local zones of compressional deformation, crystallising carapaces of intrusions, steep-structural margins of the sedimentary basins, faults poorly oriented for reactivation, and localised zones of structural heterogeneity (Hronsky 2011, 2013).
This paradigm is still in development, being essentially in a conceptual phase. Applicable set of techniques for the recognition of the conduit systems remain to be developed. In addition, the recognition of some of the key proxies for mineral exploration, such as identification of domains with a continuum of composition between ore-fluids and background crustal fluids, or detection of (palaeo) barriers, might be difficult. Thus, the detection of structural palaeo-barriers has to involve careful structural analysis and 3D modelling that is challenging in poly-deformed terrains. A negative with this paradigm is the comparison with lightning. Mineralisation requires repeated fluxes focused in the same site, fault or lode. Lightning in contrast is scattered (near random) and rarely hits the same place twice. Both the ruler shape of ore zones and the energy transfer are critical to our understanding of ore systems.
Disequilibrium – non-linear models (recent )
This innovative initiative led by Hobbs and Ord (2012) and Ord et al. (2012) shows hydrothermal systems as open-flow chemical reactors, in which heat and metals are constantly added to the system, and depleted and cooled fluids leave the system (Figs. 1 b and 2). As long as new fluids are added to the system, they are reacting (mixing together) with the host rocks a non-equilibrium state of the reaction system is maintained and the system is alive with a possibility to produce mineralisation. Once the system is closed (at equilibrium), it dies. Therefore, a successful system goes through different stages of development represented by iterative and constant alteration with endothermic and exothermic reactions (Hobbs, Ord and Regenauer-Lieb 2011). Exothermic reactions in a long-living, successful system are networked and autocatalytic. In order to find a successful mineralising system, the authors recognise the proxies described above. More specifically, Hobbs and Ord (2012) and Ord et al. (2012) describe these proxies as Mode 1 to Mode 4. Mode 1 is important because it produces an extensive (and easy to notice) alteration as a consequence of a fluid flux through the rock mass. The system survives during this stage through a serious of exothermic reactions and negative volume change by most of the reactions. When the starting reactants are consumed, the system must switch to a subsequent phase, presented as Mode 2 by Hobbs and Ord (2012), in which localised brecciation and/or laminated (and patterned) veins are developed, increasing/maintaining the permeability of the flow. Subsequently, Mode 3 is given by fracturing of the host rocks and competition between exothermic (alteration assemblages) and endothermic reactions (gold and sulphides), enabling the introduction of new fluids and longer life of the system, which thus can produce a bigger ore body (Fig. 1b). The Mode 4 is characterised by cyclicity between Mode 2 and Mode 3. In other words, the recognition of laminated (patterned) veins and breccia, in combination with alteration assemblages is the critical proxy in exploration for mineral deposits (in particular, greenfields exploration). There are many examples of ‘interesting-looking’ (common word in mineral exploration industry terminology and communication), widespread, non-localised alteration assemblages, but lacking any significant mineralisation.
It is shown that these networked chemical reactions behave in a non-linear, chaotic manner, governed by thermodynamic rules (given mostly by Korzhinskii 1959, rather than Gibbs's laws). On the other hand, endothermic reactions are the mineralisation deposition, and they are system-closing. To maintain the system open, additional energy input is required. In order to maintain the system long-living, enough to produce a significant mineralisation, the systems toggle from endothermic to exothermic reaction (alteration competing with deposition of sulphide minerals), produce breccia and/or veins, and must simultaneously maintain dissolution/deposition of carbonates and, silicates and sulphides to generate porosity.
Simple detailed mapping and careful alteration and lithological logging of the drill core can provide useful indications if the system was long-living, given by the non-linear nature of chemical reactions. Moreover, recognition of key elements indicative of continued energy input from below, such as alteration assemblages coupled with brecciation, laminated (patterned) veins and fracturing of the underlying rocks, indicate if the system was successful and potentially produced a larger quantity of gold or sulphides. This paradigm is new and innovative, but lacks detail and practical application, preferably given by few case studies. The application of the paradigm is based on non-linear mathematics, dis-equilibrium thermodynamics, challenging the understanding of junior and senior staff and many students. The main point, which must be highlighted here, is that the hydrothermal systems are complex systems, and must be studied as a whole. Studying the particular elements of the system (i.e. stages, or Modes 1–4) will not provide useful information to predict the successful systems. Perhaps, the contribution that this paradigm can make is not one of finding a new deposit, but in the non-linear mathematics, and the potential to replace geostatistics as the science of the distribution of grade with multi-fractal mathematics.
Structure in exploration
Structure is unambiguously the principal control on gold mineralisation, and from the above extensive and punctuated evolution it may be expected that structure would play a critical role in successful exploration. In fact, the opposite is the case. Using all 154 studies published in 20 years of the biannual NEWGENGOLD series, Brown and Vearncombe (2014) analysed the methods used to find the 154 deposits described in this case study series. This source is the only systematic description of exploration case studies with bias minimal, but not entirely absent. In most cases, the papers were written by company directors and senior managers 1–2 years after discovery. While it is possible that the geologists on the ground held different views, the papers were written by the guys with corporate power and influence. In some instances, the papers were authored by staff in companies that had recently acquired the projects, but for the most part authorship is by those who managed the exploration process. For each deposit, a priority numbering system was used of one to four with the most important or first mentioned exploration technology to the fourth mentioned importance (Brown and Vearncombe 2014). Of the deposits studied (one per case study), only 82 (53%) document the use of structural geology during the discovery phase. Structure is clearly subordinate to regolith or stream sampling, drilling of all types and even geophysics, having a significant impact at only the third or fourth order of priority. Forty six (29%) case studies mention structure for the purpose of regional setting, but make no further reference or provide any indication of it being used during exploration. Some 26 (16%) of case studies make absolutely no mention of structure. Only two (1%) of the case studies makes reference to any structural model that may be recognised in the above paradigms list, Matabe and Kanowna Belle and in both cases wrench fault, Reidel shear models are documented (the above paradigm 3).
Discussion
Below is a brief and simplified summary on the role of paradigms for structure controls on gold. The table summarises the above descriptions of each paradigm (Table 2). First, each paradigm has its life-time, usually lasting not more than 30 years and in rough average about 10 years. The explanation can be based on a classical paradigm shift phenomena, when a point is reached where it is not possible to provide an explanation of differences between what is observed and what is predicted by the paradigm, a paradigm crisis occurs, which is usually resolved by replacing the old paradigm with a new one (Kuhn 1962).
Summary of the main (well known and the most popular) paradigms for the exploration of gold. In the table are summarised a temporal context, critical geological proxies, area of origin and if the paradigm has been successful in finding new gold deposit.
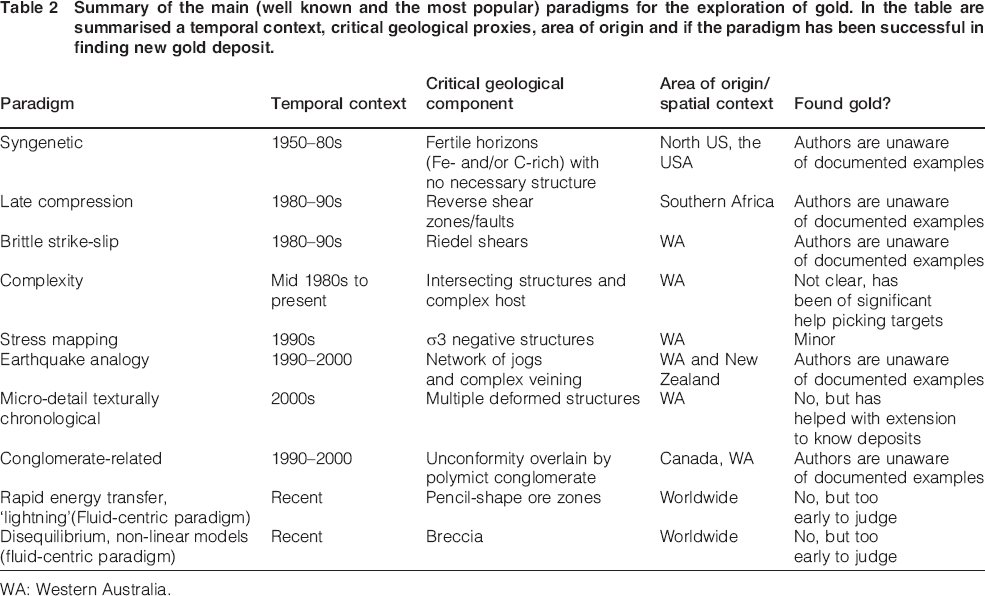
WA: Western Australia.
Second, most of the structural paradigms originated in the Archaean terrains of Western Australia, Canada and South Africa. Less commonly, paradigms have been driven by workers in the Phanerozoic or Caenozoic terrains or working on epithermal-porphyry type systems. Perhaps, this is because exploration here is more chemistry-, alteration-, and stratigraphy-based. At both regional and local scale, favourable settings for the gold deposits are a combination of tectonic, structural, chemical and lithologic factors. In other words, a single gold deposit is usually formed in multiple-phases, having evolving styles and formed by various processes. Therefore, as shown from the Table 2, being focused on one aspect of the gold-formation-related processes, as most of the paradigms are, risks missing other important constraints in the exploration for gold.
The common aspect of all the structural paradigms examined here is that they are more explanatory than predictive. Importantly, few if any have genuinely found gold! In other words, most gold deposits are not discovered using instructions or techniques provided by a structural paradigm. Structural paradigms help geologists (in particular junior staff) to describe and understand complex geometry and processes, and in most cases they encourage collection and analysis of quality structural data. In a nutshell, the paradigms usually encourage high-quality science, but rarely new discoveries!
The main positive aspects of the structural paradigms for gold can be summarised as: (1) Understanding of complex geometry and geology; (2) Most require good geology and hence encourage good science; (3) enable research funds; and (4) they do not escape the need for basic quality structure data, interpretation and a 3D picture.
The main negative aspects of the structural paradigms for gold can be summarised as: (1) No paradigm is a ‘silver bullet’; (2) They are explanatory more than predictive, few if any have genuinely found gold; (3) Some paradigms have encouraged flippant science (especially the wrench tectonics and Riedel shearing); (4) Structure remains a poor cousin relative to regolith and stream sediment sampling, geochemistry, spectroscopy and geophysics.
Structural paradigms have been stunningly unused or unsuccessful in the exploration for gold. Authors suggest that while knowledge transfer may be an issue, the principal reason for this may be the difficulty for industry to conduct structural geology in large data collection teams. Structure (paradigm-based or generic) requires a more or less immediate conversion of data into interpretation and success should not be measured by the volume of data. A massive opportunity exists for companies to embrace structural geology at all points in the exploration journey, using it for regional target selection, area selection, drill targetting, ore shape modelling and to determine grade distribution. This requires structural geology and structural geologists to be an integral part of the process from initiation, and not just crisis-solving consultancy.
The really useful deliverable of a structural analysis during exploration remains a picture, be it 2D, 3D or even 4D, hand-drawn or computer generated (Bright, Conner, Turner and Vearncombe 2014). This enables the communication of the structure, hence better target selection and better designed drilled holes. The picture may or may not comply with a paradigm.
Acknowledgements
The authors would like to Neil Philips for critical discussions and encouraging this review. Lauren Brown, Sian Bright and Graham Conner assisted with earlier drafts of this manuscript. The authors especially thank Bruce Hobbs, David Groves, Mike Grigson, Neil Philips, John Ridley and Tim Nutt (dec.) who have over the past two decades contributed to the authors’ understanding of structural controls on gold mineralisation. Three anonymous reviewers contributed significantly to this paper.