
Abstract
The corrosion evolution of scaled rebar cooled by a chemical reagent FM in concrete immersed in 3·5%NaCl aqueous solution was studied by electrochemical impedance spectra and compared with bare rebar. The results show that the corrosion evolution process of FM cooled rebar consists of three stages during the immersion: the passive stage, the accelerated corrosion stage dominated through the charge transfer step and the steady corrosion stage dominated through the mass transfer step. The corrosion rate of FM cooled rebar reaches a steady rate (<0·7 μA cm−2) after 80 days. However, the corrosion rate of bare rebar always increases at all immersion times. After immersion for ∼1 year, the corrosion rate of bare rebar is nine times larger of that of FM cooled rebar. Therefore, the corrosion resistance of the rebar has been improved significantly by applying the FM cooling process.
Introduction
Corrosion of reinforcing steel bar (rebar) is the most important cause of concrete degradation. As the corrosion of rebar in concrete occurs on the surface, the surface state of the rebar (such as stability, compactness, thickness of the surface film, etc.) affects the corrosion resistance greatly. Therefore, the corrosion resistance of the rebar can be improved by optimising the quality of scale on the rebar surface. In previous studies, a new chemical reagent named FM was used as the quenching medium during cooling of the hot rolled rebar instead of water. A layer of compact scale formed on the surface of the rebar when using FM cooling, which provides better protective performance against atmospheric corrosion than the water or air cooled rebar. 1 1,2
When the rebar is embedded in concrete, its corrosion resistance also differs greatly with different surface states. As for bare rebar, a layer of passive film will form on its surface due to the high alkalinity condition (pH 12·5-13·5) of the pore solution in concrete, which can protect it against corrosion.3 However, as the thickness of the passive film is only tens of angstroms, 4 4,5 it can be easily destroyed by aggressive mediums (such as chloride, sulphate and carbonate) in the environment. 6 6,7 Furthermore, once the passive film is destroyed locally, the expansion force caused by rust accumulation on the rebar surface will induce the breakage of the thin passive film in the large area. As a result, the corrosion will then expand rapidly on the whole rebar surface. Compared with bare rebar, the compact scale on the FM cooled rebar surface is ∼20 μm.2 Therefore, the obstructing ability for the FM cooled rebar surface against aggressive mediums into the rebar substrate is much stronger than that for bare rebar. Moreover, even if the scale is locally destroyed by aggressive mediums, the expansion of corrosion must be slower than that of bare rebar due to the thick and compact scale. This implies that the corrosion evolution process of FM cooled rebar can be expected to exhibit significant difference from that of bare rebar. Therefore, it would be very helpful to monitor the corrosion evolution of FM cooled rebar in concrete compared with bare rebar to understand the corrosion mechanism and to evaluate the corrosion extent.
In general, the corrosion evolution of the rebar in concrete consists of very complex electrochemical processes, including the depassivation of the surface film and the rust accumulation on the rebar surface. Furthermore, the charge transfer and mass transfer steps are two main factors influencing the corrosion rate of the rebar. Therefore, a suitable monitoring method should be selected to obtain the dynamic information of the corrosion process. Electrochemical impedance spectroscopy (EIS) is proved to be a non-destructive technique for monitoring the corrosion process.8 – 10 It provides the electrochemical dynamic information that reflects passivity, charge transfer and mass transfer steps of the electrode process. Particularly, appropriate interpretation of EIS data using equivalent circuits (ECs) can provide detailed information on the resistance and dielectrical properties of the surface film and the corrosion rate of the rebar.
In this paper, the corrosion evolution of FM cooled rebar and bare rebar in concrete immersed in 3·5%NaCl solution was studied by EIS spectra, and the corrosion resistance of FM cooled rebar was evaluated and compared with that of bare rebar. The EIS data were further interpreted using ECs, which were proposed based on the physical models describing the electrochemical corrosion at the rebar/concrete interface.
Experimental
Material and procedures
Rebar sample preparation
The steel used in the experiment was a commercial 20SiMn hot rolled rebar. The chemical composition is 0·17-0·25C, 0·40-0·80Si, 1·20-1·60Mn, 0·050P and 0·050S (wt-%). The rebar samples were machined into cylinders (Φ10×60 mm), and the surfaces were polished using 1200 grit sandpaper. The machined rebar samples were used as bare rebar directly. For FM cooled rebar, the machined samples were heated to 1000°C for 10 min in the pipe furnace under an antioxidising flux protection. Then, the high temperature samples were cooled by the chemical reagent FM for 1 s. In addition, the samples were cooled in air to room temperature. The component of FM is 10%H2O2, 5 g L−1 NaBO3, 0·45 g L−1 Na2SiO3 and 0·45 g L−1 MgSO4. The chemical reagent FM is an aqueous solution. In addition, the treatment temperature of FM cooling is fixed to room temperature (25°C).
Concrete sample preparation
Reinforced concrete samples (80 mm in diameter and 80 mm in height) were cast according to standard experimental procedures using ordinary Portland cement 42·5 (with a water/cement ratio of 0·5 and cement/sand ratio of 1∶3). The schematic diagram of the electrode system is shown in Fig. 1, and all the length units are in millimetres. A three-electrode cell was used in this experiment. The working electrode (WE) was the machined rebar sample. Both ends of the rebar were coated with dense epoxy, leaving an exposed length of 40 mm. The rebar was positioned at the centre of the concrete sample with a cover thickness of 35 mm. The reference electrode (RE) was Cu/CuSO4 electrode, which was positioned 5 mm near the WE to reduce the IR drop between WE and RE. In order to distribute the electrical signal uniformly, a 60 mm height annular graphite electrode was used as the counter electrode, which was positioned in the concrete with the cover thickness of 11 mm. After demoulding for 1 day after casting, the concrete samples were cured in a standard curing chamber at 20±1°C and ⩾95% relative humidity for 28 days. In order to avoid the non-uniform penetration of solution, both ends of the concrete samples were coated with epoxy resin, leaving 40 mm height profile exposed.
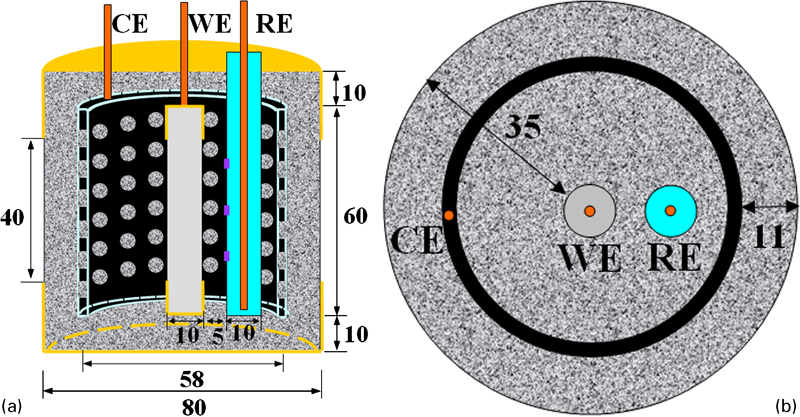
Schematic diagram of electrode system for reinforced concrete samples
Long term immersion tests
Long term immersion tests were carried out to accelerate the corrosion of rebar in concrete. First, the concrete samples containing two kinds of rebar were immersed in deionised water to reach a constant weight. Then, they were immersed in 3·5%NaCl solution.
Electrochemical measurement
During the long term immersion tests, E corr and EIS were measured using a PAR 273 potentiostat and a PAR 5210E lock-in amplifier. The EIS measurements were performed at the open circuit potential with a 10 mV perturbation from 100 kHz to 10 mHz. All the measurements were carried out at room temperature (25°C). The EIS results were fitted by ZSimpWin software based on the EC models.
Results
EIS spectra and EC models
Figure 2 Figures 2 and 3 show the impedance Bode plots of bare rebar specimen and FM cooled rebar in concrete immersed in 3·5%NaCl solution for different immersion times respectively. For the Bode |Z| plots, the low frequency impedance corresponds to the total impedance, which is equal to the sum of the solution resistance R s, the film resistance R f and the charge transfer resistance R ct. It is shown that the total impedance for both rebars decreases with increasing immersion time, indicating the increase in corrosion rate. At the same time, as shown in the Bode phase plot, the peak value of the phase angle also decreases with increasing immersion time, which indicates the decay of the capacitive impedance of the surface film. As the capacitance of the surface film represents the penetrability of the film, this decay of capacitive impedance means that the penetrability of the film increases with increasing immersion time, and more ions can reach the matrix through the film to erode the steel. 11 11,12 Furthermore, it is obvious that the total impedance and the phase angle of bare rebar dropped sharply since the initial 2·5 days, which indicates that the breakdown of the surface film and the initiation of corrosion are rapid for bare rebar. However, the total impedance and the phase angle of FM cooled rebar decrease gradually and slowly. Therefore, it can be concluded that the corrosion of FM cooled rebar is much slower than that of bare rebar.
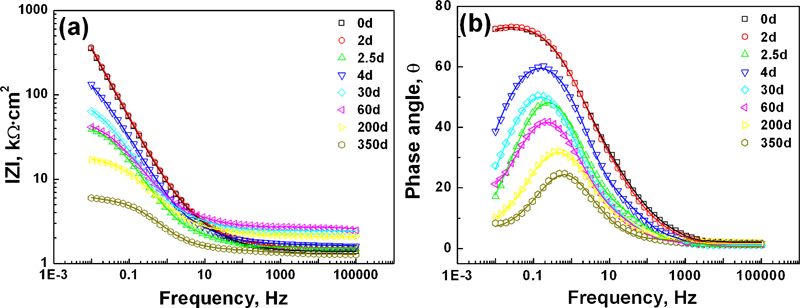
Bode plots of bare rebar in concrete as function of immersion time (solid lines represent fitting results)
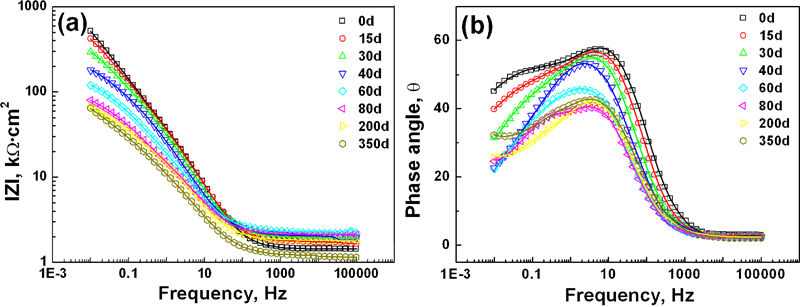
Bode plots of FM cooled rebar in concrete as function of immersion time (solid lines represent fitting results)
The EIS results were analysed by applying EC models. The selection of the EC is based on the characteristics of the EIS spectra, which are determined by the corrosion process on the surface and surface state of the rebars. The corrosion evolution contains three stages for both rebars. The physical models and the corresponding EC models of these three stages are illustrated in Fig. 4.
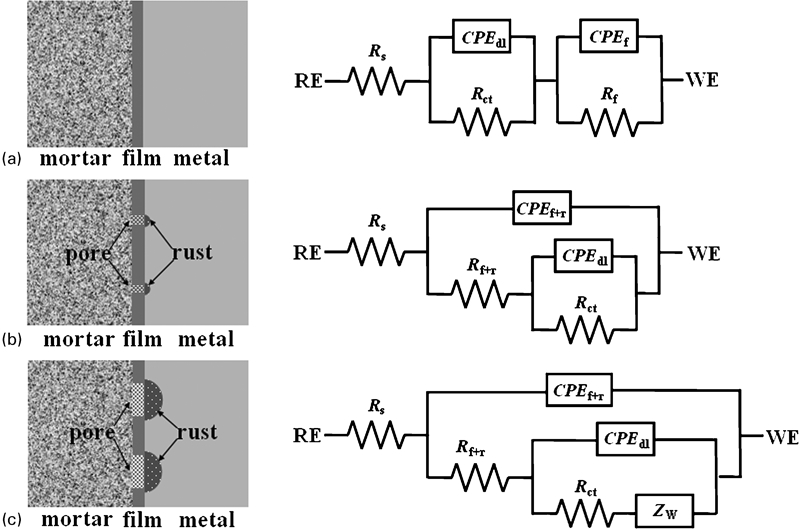
Physical models and corresponding EC models
Stage I corresponds to the condition that an intact and compact passive film or oxide film covers on the rebar surface, and the rebar is in passive state, as shown in Fig. 4a. In the EC model, R s stands for the solution resistance of concrete pores between RE and WE, R f stands for the resistance of the surface film, CPE f stands for the constant phase element of the surface film, R ct stands for the charge transfer resistance and CPE dl stands for the constant phase element of the double electrical layer. Generally, a passive film consisting of a compact Fe3O4 and/or Fe2O3 layer or γ-FeOOH layer can form on the surface of bare rebar due to the high alkalinity condition (pH 12·5-13·5) of the pore solution in concrete. 13 13,14 The passive film formed during the curing period can thus protect the rebar against corrosion. However, the difference has been observed for FM cooled rebar. Neglecting the very thin Fe2O3 layer on the scale surface, the scale consists of three layers: a thick and compact inner Fe3O4 layer, a middle FeO layer and a compact outer Fe3O4 layer, as shown in Fig. 5.2 The method to distinguish the oxide between layers has been illuminated in Ref. 2. Both the inner and outer Fe3O4 layers are favourable to resist corrosion. According to the EIS results, the passive periods for bare rebar and FM cooled rebar are 2 and 15 days respectively. As the thickness of the passive film on bare rebar is only tens of angstroms, it can be easily destroyed, and its protection action against corrosion is limited. However, the thickness of the scale on FM cooled rebar is ∼20 μm. Therefore, FM cooled rebar can provide longer protection against corrosion than bare rebar.
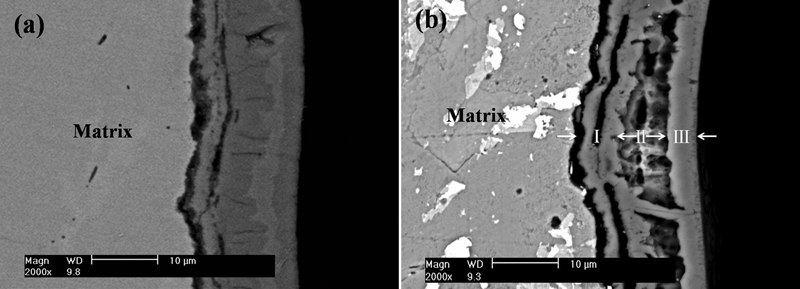
Cross-section morphology of FM cooled scale
Stage II corresponds to the condition that the surface film is locally destroyed by chloride ions and corrosion of rebar initiates, as shown in Fig. 4b. In the EC model, R f+r stands for the sum resistance of film and rust, and CPE f+r stands for the sum constant phase element of film and rust. In this stage, the initial corrosion rate is relatively slow, and the dissolved oxygen in the pore solution is sufficient for charge transfer reduction. Furthermore, the thickness of rust at anode regions is not thick enough to block the diffusion of the reactants and products to and from the electrode surface. Therefore, the corrosion process is controlled by the charge transfer step in stage II.
Along with the corrosion proceeds, the volume expansion caused by the corrosion product enlarges the broken area of the film, thus accelerating the corrosion of the rebar. With the increase in corrosion rate and thickness of the rust on the surface of the rebar, the diffusion of the reactants and products cannot satisfy the need of electrode reaction. Therefore, the rate determining step of the corrosion process changes from the charge transfer step (stage II) to the diffusion step (stage III) gradually. The boundary of stages II and III is not distinct. However, it has transformed to stage III from 60 and 80 days after immersion for bare rebar and FM cooled rebar respectively.
Stage III corresponds to the condition that the broken area of the film is enlarged and a thick rust layer formed at the anode regions, as shown in Fig. 4c. In the EC model, Z W stands for the Warburg resistance of the semi-infinite diffusion process. The obvious characteristic at this stage is that the mass transfer behaviour occurs at the low frequency region. For bare rebar, the total impedance decreases rapidly with immersion time in this stage. However, the change of total impedance with immersion time is slow for FM cooled rebar.
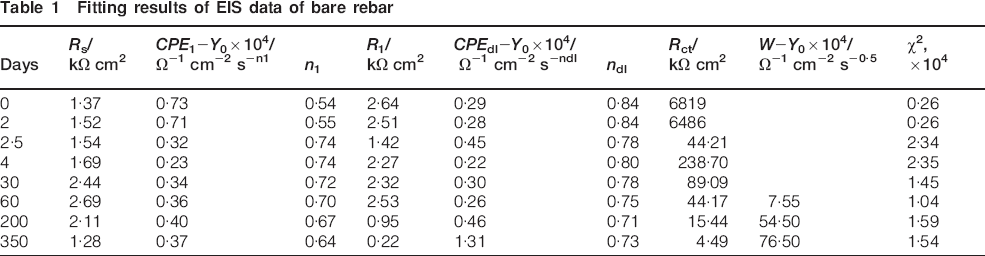
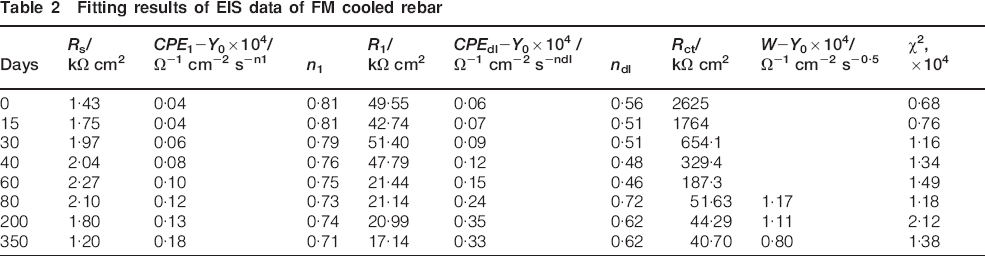
Fitting results of EIS
The fitting curves are presented in Figure 2 Figs. 2 and 3 (see solid lines for each spectrum), and the fitting parameters are listed in Table 1 Tables 1 and 2. The resistances of R f and R f+r are expressed as R 1, and the constant phase elements of CPE f and CPE f+r are expressed as CPE 1.
Fitting results of EIS data of bare rebar
Fitting results of EIS data of FM cooled rebar
The evolution of R 1 with immersion time for both rebars is shown in Fig. 6. The R 1 for bare rebar decreased evidently at 2·5 days after immersing in 3·5%NaCl solution, which implies the breakdown of passive film at some local regions. Then, it reverted at 4 days and decreased gradually with the immersion time. The R 1 of FM cooled rebar changed slightly during the former 40 days, which indicates the unbroken or slight broken of scale on the rebar surface. Then, it decreased from 40 to 60 days. Then, it was stable with increasing immersion time. Furthermore, the R 1 of FM cooled rebar is ∼20 times larger than that of bare rebar initially, and the ratio increases to ∼80 times after immersing for nearly 1 year. Therefore, the corrosion resistance of the surface film on FM cooled rebar is much better than that on bare rebar.
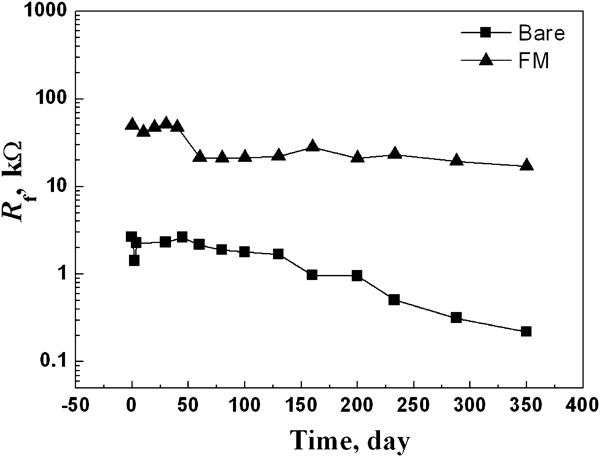
Evolution of R 1 with immersion time
The evolution tendency of R ct with immersion time is similar to R 1 for both rebars, as shown in Fig. 7. The R ct of bare rebar also decreased sharply at 2·5 days. Then, it decreased gradually with the immersion time. The R ct of FM cooled rebar changed slightly during the former 15 days. Then, it decreased from 15 to 80 days. Then, it was stable with increasing immersion time. Despite that the R ct of bare rebar is larger than that of FM cooled rebar initially, the R ct of FM cooled rebar decreases much slower than that of bare rebar, and it is about nine times larger than that of bare rebar after immersing for nearly 1 year.
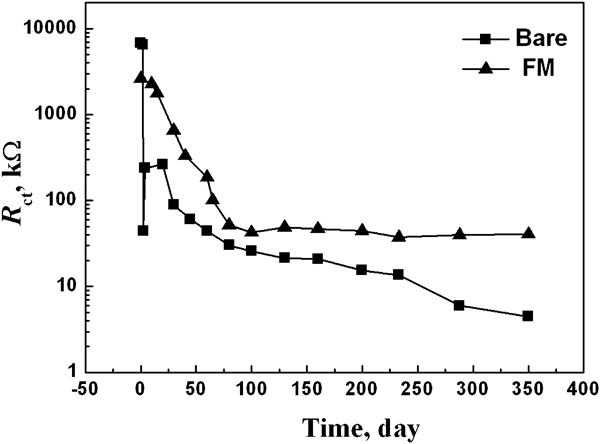
Evolution of R ct with immersion time
The corrosion current density of the rebar can be calculated according to the Stern–Geary equation

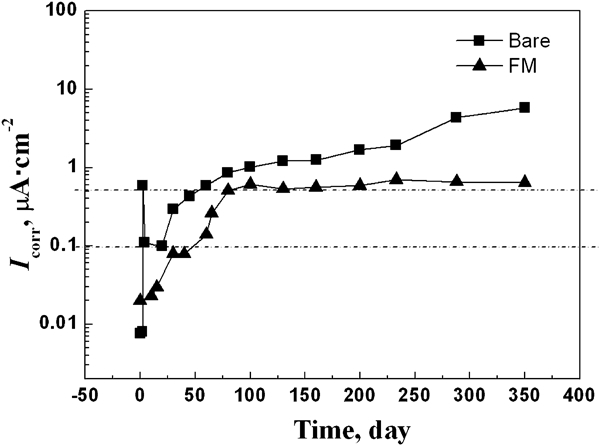
Evolution of I corr with immersion time
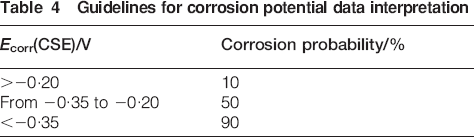
Criteria for estimating rebar corrosion conditions
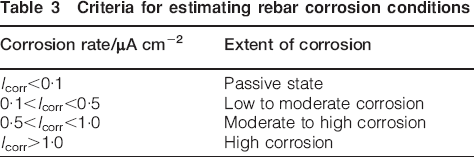
It is shown in Fig. 8 that the change in I corr with the immersion time for both rebars corresponds to the three stages of corrosion processes. In stage I, the I corr is <0·03μA cm−2 for both rebars. Therefore, the rebar is in passive state. In stage II, the I corr increases with the immersion time and is <0·5 μA cm−2 for both rebars. In stage III, the I corr of FM cooled rebar almost keeps stable and is <0·7 μA cm−2. However, the I corr of bare rebar still increases gradually with the immersion time.
Evolution of E corr
According to the ANSI/ASTM C876-91 standards,18 the corrosion probability can be judged by E corr, as shown in Table 4. The evolution of E corr with immersion time for both rebars is shown in Figure 9 Figs. 9 and 10. The change of E corr is the reflection of corrosion processes, and it coincides with the EIS results. The initial values of E corr for both rebars are located in the 50% corrosion probability region, which corresponds to the initial passive state of both rebars. The E corr of bare rebar decreased sharply after immersing for 2·5 days. However, the E corr of FM cooled rebar decreased gradually after 15 days. Therefore, the E corr result also indicates that the corrosion resistance of FM cooled rebar is better than that of the bare rebar.
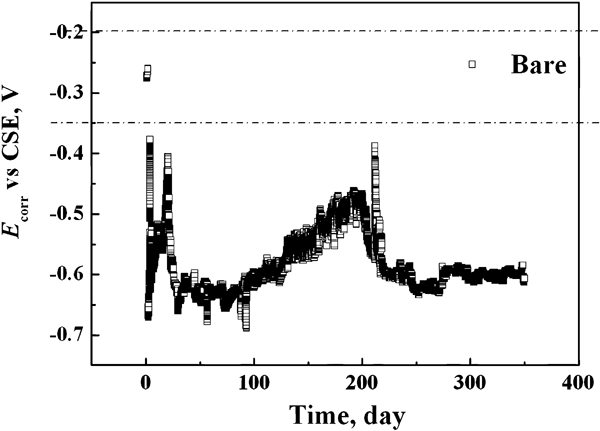
Evolution of E corr with immersion time for bare rebar
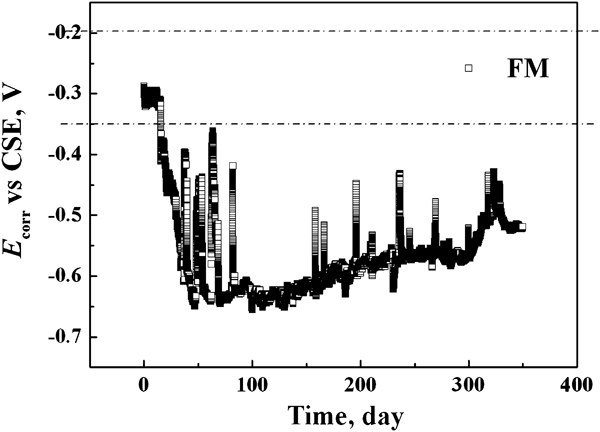
Evolution of E corr with immersion time for FM cooled rebar
Guidelines for corrosion potential data interpretation
Conclusions
According to the results of EIS and E corr, the breakdown of the passive film and the corrosion of bare rebar occurred 2·5 days after immersing in 3·5%NaCl solution. Furthermore, the corrosion rate of bare rebar always increases at all immersion times. However, for the FM cooled rebar, the corrosion initiated 15 days after immersion. Moreover, the corrosion rate of the FM cooled rebar increases much slower than that of bare rebar, and it reaches a steady rate (<0·7 μA cm−2) after 80 days. After immersion for ∼1 year, the corrosion rate of the FM cooled rebar is just one-ninth of that of the bare rebar. Therefore, the corrosion resistance of rebar has been improved significantly by applying the FM cooling process.
During the immersion, the authors further revealed that the corrosion evolution of FM cooled rebar contains three stages: the passive stage, the accelerated corrosion stage dominated through the charge transfer step and the steady corrosion stage dominated through the mass transfer step. Unlike the FM cooled rebar, the corrosion rate of bare rebar still increases rapidly with immersion time in stage III.