
Abstract
Carbon dioxide corrosion involves several factors that complicate corrosion mechanisms due to the possible interactions (synergies, etc.) among the species present. Selective study of each individual effect, by either empirical or mechanistic modelling, is unlikely to uncover these interaction effects satisfactorily. This paper demonstrates the use of response surface methodology as a method to optimise experiments so as to capture better synergies between species and conditions. Here, the multiple effects of acetic acid, temperature, flowrate and pH are studied in the model, which was validated by experiment, prediction software and published corrosion data. In conclusion, the proposed model has shown a good agreement with the validation data, which indicates the suitability of the approach used to model carbon dioxide corrosion at pH 4-5·5.
Introduction
The effects of carbon dioxide are a major cause of corrosion in oil and gas production. CO2 corrosion kinetics is influenced by environmental conditions, such as temperature, CO2 partial pressure, pH and flowrate. The presence of other species, such as acetic acid HAc, will also contribute to the corrosion rate significantly. Many previous studies1 – 10 have demonstrated that these multiple species can affect the corrosion process by several mechanisms. In formulating empirical corrosion prediction models, all variables must, ideally, be considered in the experiments. Consequently, the experiments will become large and costly. Traditionally, researchers use selected dependent variables based on a planned interval test to obtain representative trends for the corrosion mechanism. The empirical relationships among variables are then obtained through best fit regression. Thus, many empirical CO2 corrosion models do not sufficiently consider interactions between environmental variables. Moreover, there are few expressions in the literature that quantify the mixed variables simultaneously, and no expressions are available for a mixed CO2/acetic acid environment. Considering these limitations, it is important to develop a CO2 corrosion model that meets the criteria supported by both strong fundamental theory and proven systematic statistical background, which can express the relationship among the operational conditions (temperature, pH and flowrate) and reservoir species such as organic acids. In this way, the corrosion mechanism can be interpreted comprehensively. Response surface methodology (RSM) is a new approach to CO2 corrosion modelling in which the multiple interactions of independent variables can be included simultaneously.
Mechanistic model of uniform CO2 corrosion
Uniform CO2 corrosion can be modelled using fundamental physicochemical laws encompassing electrochemistry and diffusion process.11 In the case of corrosion occurring at the metal surface, it can be expressed mathematically using equation (1), which is based on several assumptions described as follows: convective diffusion, molecular diffusion and diffusion via solid film. The corrosion that occurs in solutions, as in a combination of mixed gaseous species, can be expressed as11
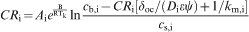
The total corrosion rate is equal to the sum of the corrosion caused by each species. In this research, a response surface model combined with mechanistic theory was used to construct an empirical model that relates the various effects of acetic acid, temperature and rotation speed on CO2 corrosion simultaneously at pH 4 and 5·5.
Research method
Modelling work
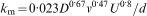
The research can be divided into three main steps: experimental design, experimental work and model development and evaluation. The first step was conducted by screening suitable experiments and identifying historical data variables to find the trends for the CO2 corrosion model. Historical data were provided by a CO2 corrosion database and calculation from mechanistic theory. Once the key trends were identified, the optimum experimental design and model regression can be selected. In order to evaluate the model performance, the model was verified with published experimental data and corrosion software calculation. The model performance is reported by the value of standard error estimation, correlation coefficient determination that represents the accuracy and precision of the model compared to the data provided. The methodology flowchart is shown in Fig. 1. The experiments were divided into three groups:
Methodology flowchart
experiment 1: effects of the concentration of acetic acid, temperature and rotation speed at pH 4
experiment 2: effects of the concentration of acetic acid, temperature and rotation speed at pH 5·5
experiment 3: effects of the concentration of acetic acid, temperature, rotation speed and pH (i.e. a combination of experiments 1 and 2).
Experimental design for CO2 corrosion using RSM
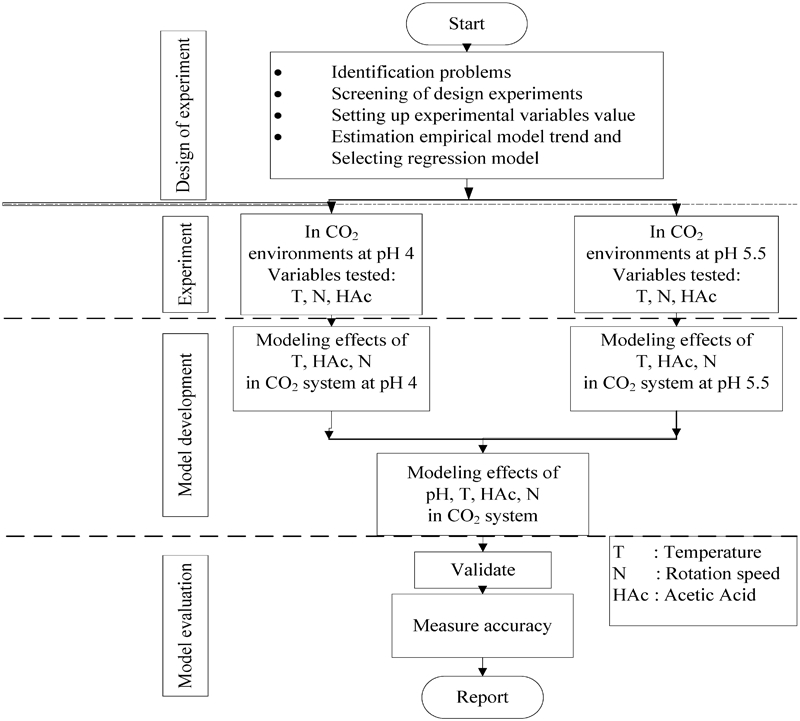
Central composite design (CCD) is an accepted experimental approach in RSM. It enables the construction of a second order (quadratic) model without the need to perform a full factorial design experiment. Response surface methodology is a sequential procedure for constructing the empirical relation of the experimental data. Using response information, the optimum data between factors can be developed, and model improvements can be achieved. 12 12,13 The application of RSM with a CCD technique suggests a design model to calculate the response variables at specific environmental values.14 In order to find potential values that may be used in the experiments, the CCD property must have a rotatable design (Fig. 2). In order to formulate this design, the CCD should consist of a factorial design (the corners of a cube) together with centre and axial points that allow for the estimation of second order effects. For a full quadratic model with n factors, the CCD will have 2n+2n+1 minimum design points for estimating and (n+2)(n+1)/2 coefficients. 14 14,15
Illustration of positions for three variable experiments in CCD14
Thus, the setting variables in the experiment should have the length of 1 unit in each factor. Hence, all the real variables were transformed to +1 as a code for high value and −1 for the low value representing the corner of the cube and additional orthogonal variables codes of ±31/2. After coding, the dependant variables in three factors and two levels were structured in an orthogonal matrix that will be used to calculate the regression model.
Variable coding and experimental design
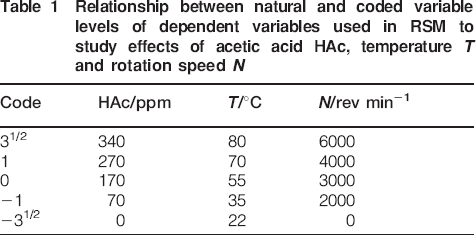
In order to optimise the calculation, the variables were coded according to equation (5). The independent variables, such as acetic acid concentration HAc, temperature T and rotation speed N, in the form of natural and coded variable values, are shown in Table 1 Tables 1 and 2.
Relationship between natural and coded variable levels of dependent variables used in RSM to study effects of acetic acid HAc, temperature T and rotation speed N
Relationship between natural and coded variable levels of dependent variables used in RSM to study effects of acetic acid HAc, temperature T, rotation speed N and pH
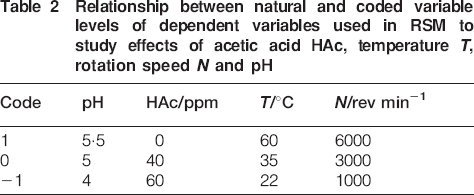
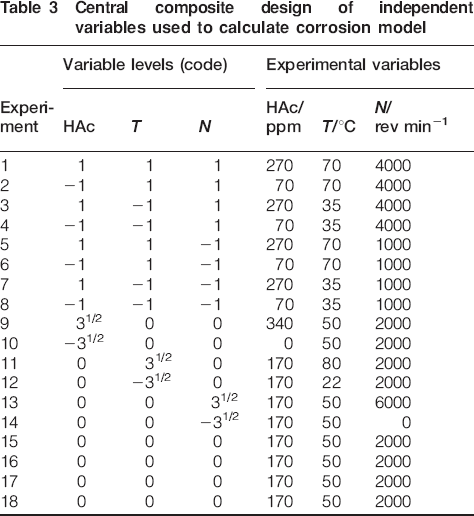
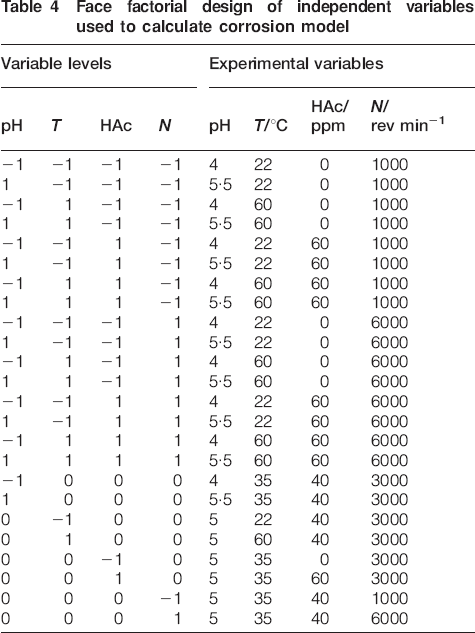
Table 3 shows a CCD experimental design to study the effects of the variables at pH 4 and 5·5 (i.e. the experiments at conditions 1 and 2) with three independent variables (coded and natural). Table 4 shows a face factorial design used to study the effects of pH as a variable (experiment 3). These matrices were used to find the response pattern and to determine the combined effects of all the variables. Four replicates were used to allow the estimation of a pure error sum of squares.
Central composite design of independent variables used to calculate corrosion model
Face factorial design of independent variables used to calculate corrosion model
Second order model regression
Based on the CO2 corrosion pattern calculated using equation (1), the best fit regression is in the form of the second order model. The minimum number of levels required for each factor to quantify that behaviour is therefore three. Furthermore, adding additional points with some repeated variants satisfies the requirement for error analysis. 14 14,15 Minitab program software16 was used for statistical analyses. The general second order model can be found in literature as provided by Reference 14 and 15.</citref>
Electrochemical set-up
A schematic three-electrode set-up was used in all the electrochemical experiments, as shown in Fig. 3. An RCE with a speed control unit was used as the working electrode. The glass cell was fitted with graphite electrodes as auxiliary electrode and Ag/AgCl as reference electrode. The experimental variable matrix is shown in Table 5.
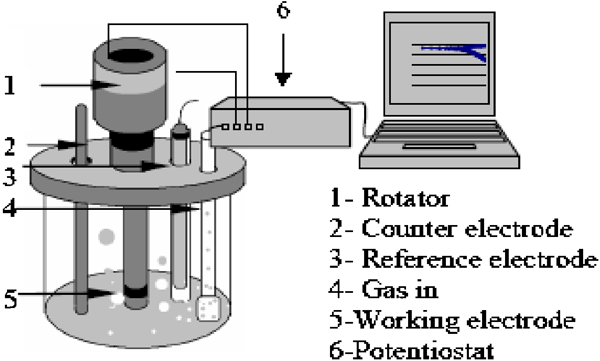
Experimental set-up for RCE test
Experimental parameters
Specimen preparation
The working electrodes were 080A15 carbon steel with a chemical composition of 0·14C–0·175Si–0·799Mn–0·01P–0·03S–0·06Cr–0·065Ni. The cylindrical specimens have diameter of 12 mm and length of 10 mm. Before immersion, the specimen surfaces were ground successively with 240, 400 and 600 grit SiC papers, rinsed with methanol and degreased using acetone. The experiments were repeated at least twice in order to ensure reasonable reproducibility.
Cell solutions
The experiments were performed in both stagnant and flowing conditions. The total pressure was atmospheric (1 bar), and the glass cell was filled with 1 L of distilled water and 3 wt-%NaCl and stirred with a magnetic stirrer. Carbon dioxide was bubbled through the cell (for at least 1 h before experiments) in order to saturate and deaerate the solution. The temperature was controlled using a hot plate. After the solution was prepared, the pH was adjusted using NaHCO3 buffer solutions. The simulation of flowrate was conducted using RCE with a cylindrical working electrode. The linear polarisation resistance (LPR) technique was used to measure the polarisation resistance R p and the corrosion rate using a sweep rate of 10 mV min−1. The procedure is similar to ASTM G-5-94 experimental test.17
Results and discussion
Mechanistic corrosion rate model trending
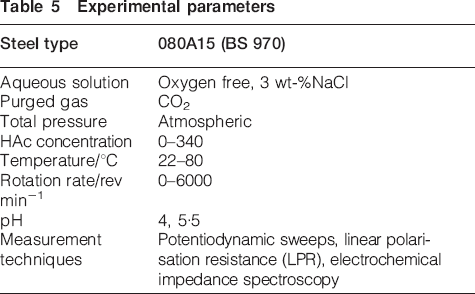
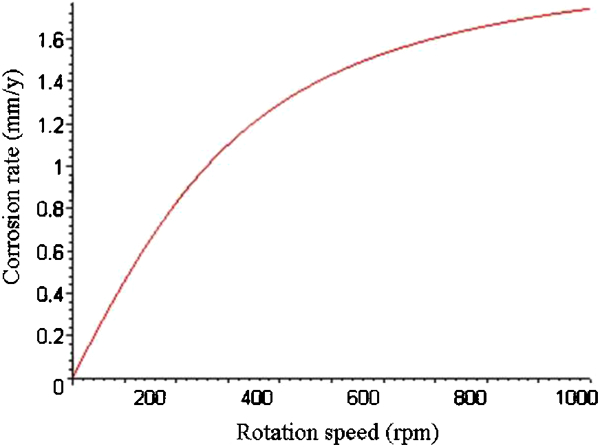
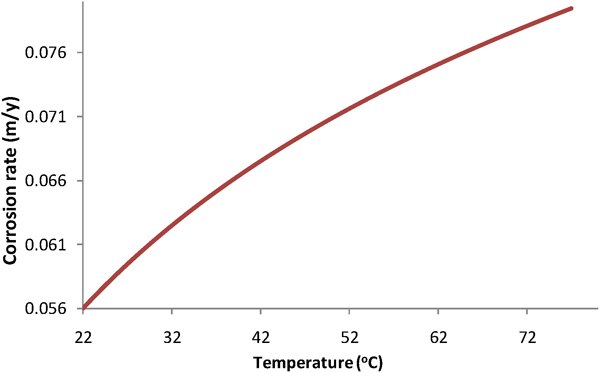
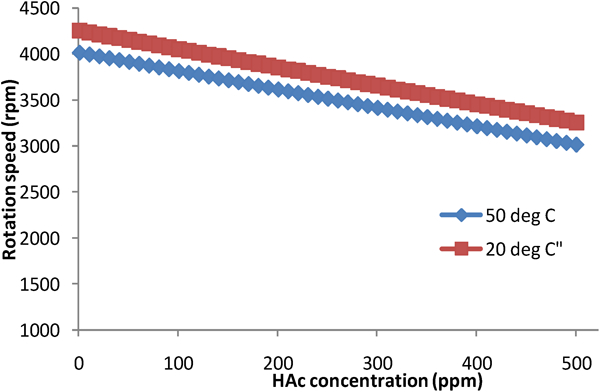
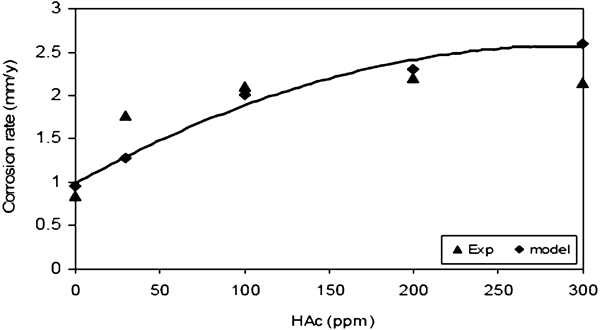
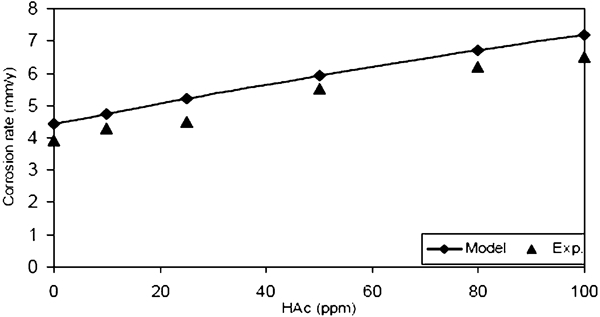
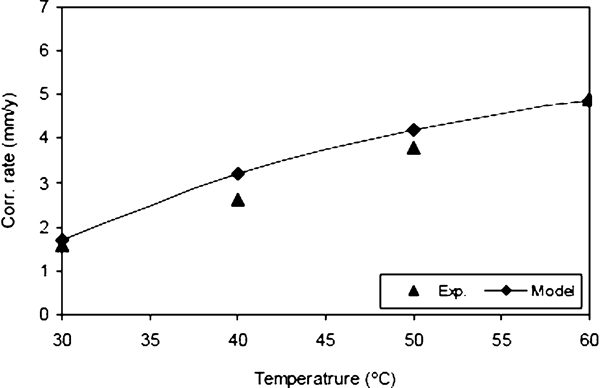
The mechanistic corrosion models as a function of rotation speed, temperature and acetic acid concentration are presented in Figure 4 Figure 5 Figs. 4-6 respectively. The graphs were calculated using mechanistic theory models developed by Wei.11
Simulated corrosion rate as function of rotation speed at conditions of P total = 1 bar
Simulated corrosion rate as function of temperature from 22 to 80°C at conditions of P total = 1 bar and static
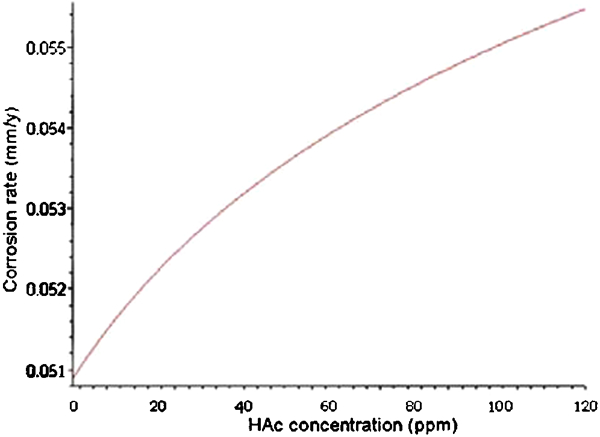
Simulated corrosion rate for a range of acetic acid HAc concentrations from blank to 120 ppm at conditions of P total = 1 bar and static
Based on the mechanistic models ( Figure 4 Figure 5 Figs. 4-6), the CO2 corrosion trend for the effect of acetic acid, temperature and flowrate follows the second order model (equation (1)). Thus, the model will be fitted using second order model regression.
Regression model
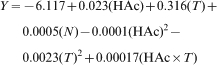
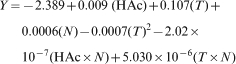
The model parameters derived using least square calculation from Table 6 Tables 6 and 7 are presented in equations (2)–(4) below:
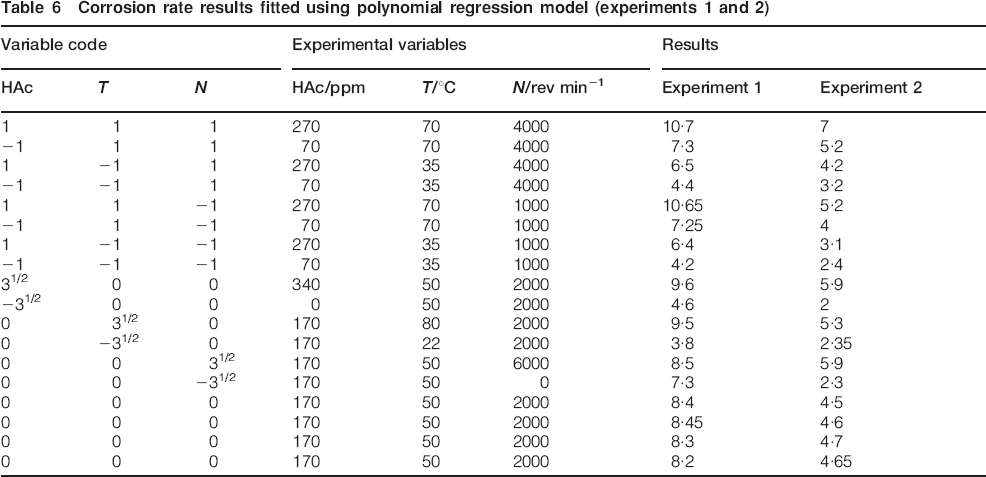
Corrosion rate results fitted using polynomial regression model (experiments 1 and 2)
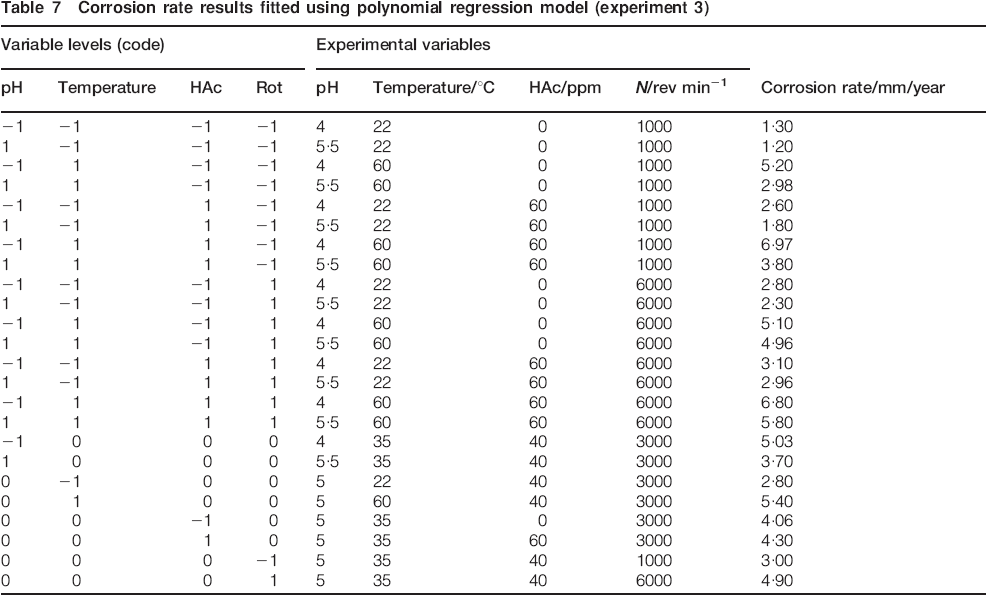
Corrosion rate results fitted using polynomial regression model (experiment 3)
experiment 1 (pH 4)
experiment 2 (pH 5·5)
experiment 3 (pH variables)
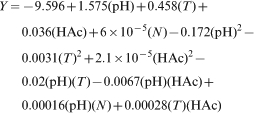
where Y is the corrosion rate (mm/year), HAc is the concentration of HAc (ppm), T is the temperature (°C) and N is the rotation speed (rev min−1).
Table 6 Tables 6 and 7 show the full experimental design and results calculated using LPR. The independent variables are presented in natural values.
Statistical analyses
Table 8 shows a summary of the significance for the corrosion data fitting under experimental conditions 1, 2 and 3. As can be seen, condition 1 was more significant for linear and square fits compared to experiments and 3. Experiment 1 showed that the coefficient of linear interactions and the square models show a significant value at α = 0·05. The linear effect was found to be significant at probability (p<0·05), while the interaction effect was found to be significant at p>0·05. The correlation coefficients for the models are 0·98 (experiment 1), 0·97 (experiment 2) and 0·97 (experiment 3).
Comparison of analysis of variance for fitted models*
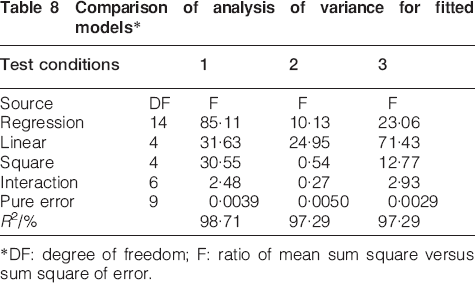
*DF: degree of freedom; F: ratio of mean sum square versus sum square of error.
Analysis and interpretation of response surface of CO2 corrosion
Effects of temperature and acetic acid concentration
The effects of temperature and acetic acid concentration on corrosion, as modelled by the RSM, in CO2 saturated solution are presented in Fig. 7 (pH 4), Fig. 8 (pH 5) and Fig. 9 (pH 5·5). As can be seen, the corrosion rate will increase as the concentration of acetic acid and the temperature increase. The increase in corrosion rate due to acetic acid is related to the role of acetic acid in providing protons and adding a new cathodic reaction via the direct reduction of undissociated acetic acid.18 The mechanism of dissolved acetic acid in CO2 corrosion can also be correlated to the concentration of undissociated acid present in the solution, as described by Nafday.19 Several researchers have confirmed that the presence of HAc in the range of 10-340 ppm caused a higher corrosion rate than in its absence. The increased corrosion as a function of temperature and acetic acid concentration was also observed by Ismail,20 Dougherty21 and Nesic.9
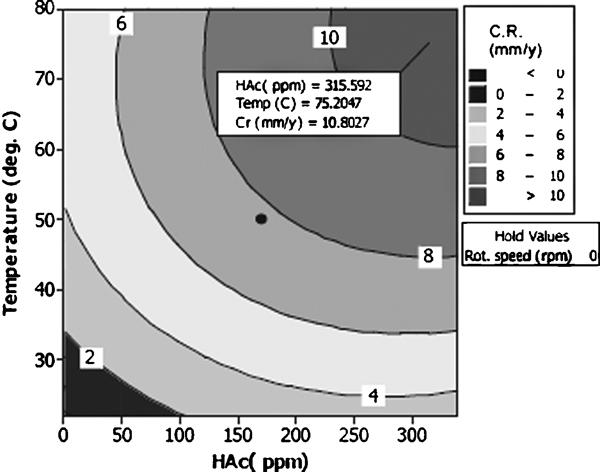
Response surface graphs for corrosion rate as function of temperature and acetic acid HAc concentration (in stagnant conditions and pH 4)
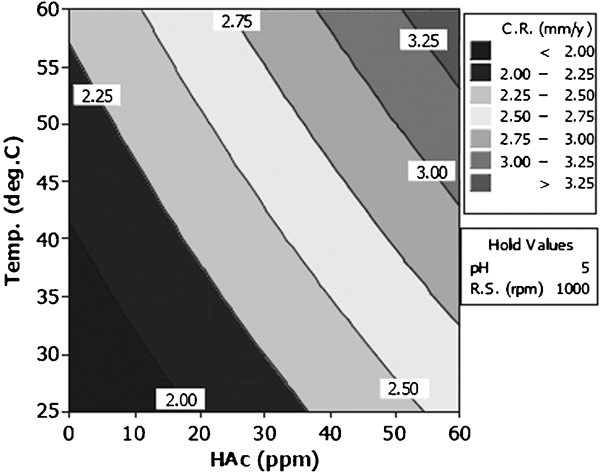
Response surface graphs for corrosion rate as function of temperature and acetic acid HAc concentration (at 1000 rev min−1 and pH 5)
Response surface graphs for corrosion rate as function of temperature and acetic acid HAc concentration (at stagnant condition and pH 5·5)
As investigated by the RSM model, the corrosion rate at pH 4 is higher than that at pH 5·5. The effect is proportional to the amount of acetic acid added. At pH 5·5, the corrosion rate also increases when the acetic acid concentration was increased. However, the average corrosion rate at pH 5·5 is lower than that at pH 4. These observations suggest that H+ ions are the predominant factor that contributes to corrosion rate.
Scaling temperature analyses
It has been recognised that the temperature strongly influences the corrosion rate. It can increase or decrease the corrosion rate depending on the film properties produced during corrosion reactions. As can be seen in Figure 7 Figure 8 Figs. 7-9, the corrosion rates are higher at lower temperatures (<60°C) compared to those at higher temperatures. An increase in the corrosion rate can be related to the degree of solubility of the species in solution. A higher solubility of FeCO3 slows down the formation of the protective film, as stated by Song et al.22 Song et al. also showed that, at temperatures below 60°C, hydrogen evolution took place as a rate determining step, and carbonate scale did not form well. The film was detached and porous, which gave little protection. In this condition, the kinetics of film formation was faster, and the corrosion rate was under charge transfer control. Above 60°C, the protectiveness of the iron carbonate layer increases with temperature as the solubility of iron carbonate decreases. Thus, the corrosion rate is reduced. However, at higher temperatures, there is a direct reaction between steel and water to produce dense and protective films.23 Therefore, in this condition, the corrosion rate may be governed by film formation. Based on Heuer's experiment,23 temperature has a different effect on the corrosion rate. The corrosion rate increases with temperature until it reaches maximum values called the scaling temperature. Beyond this temperature, the corrosion rate will decrease. Factors affecting the scaling temperature were pH, HAc and rotation speed. The RSM can be used to find this scaling temperature numerically.
The maximum temperature points are located in the condition where the first derivative of the response surface to temperature is equal to zero. Calculating first the derivative of temperature T in equation (2) results in


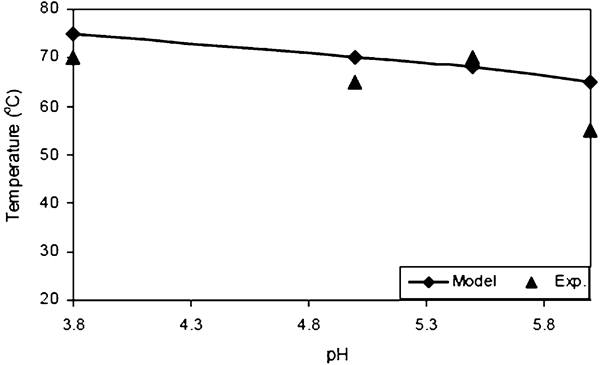
Effects of pH on scaling temperature as calculated by RSM at conditions (stagnant, blank solutions, total pressure of 1 bar and 3%NaCl in CO2 saturated solution): experimental data were taken from Refs. 17 and 23
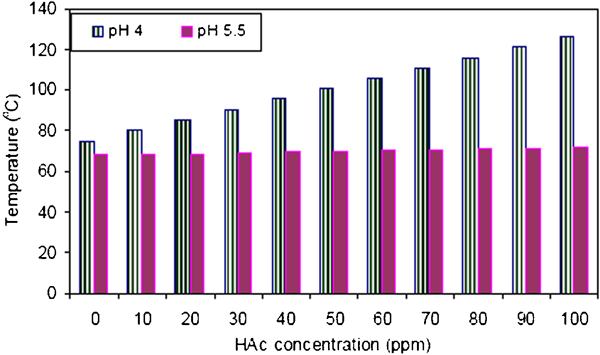
Effects of acetic acid on scaling temperature as calculated by RSM at conditions (stagnant, total pressure of 1 bar and 3%NaCl CO2 saturated solution)
From Fig. 10, it can be seen that the higher the pH, the lower the scaling temperature. This observation was supported by several researchers. 6 8 6,8,24 They all related these phenomena to the film formation where higher pH was favourable for film precipitation. It is also observed that, in the presence of acetic acid, the scaling temperature increases at the same pH (Fig. 11). This means that the effects of temperature on film formation were more dominant than those of acetic acid.
Effects of flowrate on corrosion rate and independent limiting current
The corrosion rate threshold as a function of rotation speed has been studied previously
25
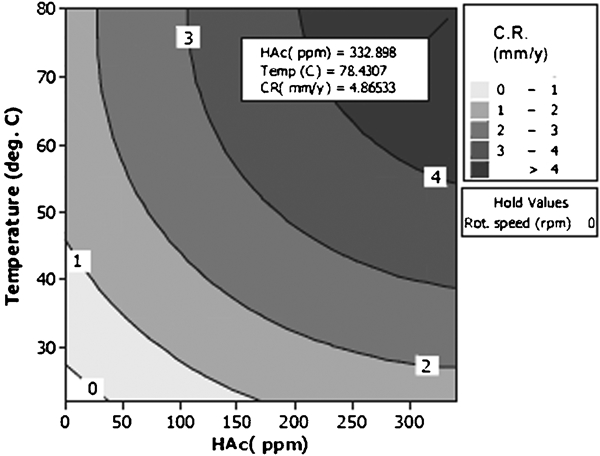
25,26 using cathodic scan polarisation. Through cathodic polarisation, it can be seen that at specific rotation values, the cathodic current behaviour will show diffusion behaviour (i.e. a limiting current density). In this case, Rothman and Mendza, as cited by Ismail,20 classified the effect of flowrate into two regions: a flowrate dependent limiting current and a flowrate independent limiting current. The flowrate dependent limiting current is correlated with the diffusion of the main electrochemical species of H+, H2CO3 and acetic acid. However, the flowrate independent limiting current is related to the chemical reaction product as an effect of the corrosion process. The RSM can discriminate the effects of temperature and acetic acid concentration on the rotation speed threshold, as presented in Fig. 12. Thus, the flowrate independent limiting current at several acetic acid concentrations and temperatures can be found by calculating first derivative of the corrosion rate model with respect to the rotation speed, as presented in equation (7) (at the condition of pH 4)


Variation in acetic acid HAc concentration on maximum rotation speed as calculated by RSM at conditions (stagnant, pH 4, total pressure of 1 bar and 3%NaCl CO2 saturated solution)
Verification with experimental data, corrosion prediction software and experiments results
The comparison effects of acetic acid on the corrosion rate calculated by the model with Ismail's20 and Hedges and McVeigh's1 experimental data are shown in Figure 13 Figs. 13 and 14 respectively. Both figures show good agreement between corrosion experimental data and calculation based on this corrosion prediction model. Comparing to Ismail's experiments at 22°C, the model has R 2 of 0·82, correlation of 90% and standard error estimation of 0·3. In comparison with Hedges and McVeigh's experiments, the model shows a relationship with R 2 of 0·94, correlation of 97% and standard error estimation of 0·28.
Corrosion rate at varying concentrations of acetic acid HAc: comparison between model and Ismail's experimental data20 (saturated CO2 solutions, 22°C, pH 5·5 and 1000 rev min−1)
Comparison between model and Hedges and McVeigh's experimental data1 (in bubbling CO2 solutions at 60°C, static condition)
The comparison effects of the temperature of the model with George and Nesic's data27 and ECE28 are presented in Figure 15 Figs. 15 and 16 respectively. With George and Nesic's data, the result shows R 2 of 0·9, correlation of 97% and standard error estimation of 0·5. Figure 15 shows a comparison with ECE that presents a good relationship with R 2 of 0·95, correlation of 97% and standard error estimation of 0·2.
Comparison between model and George and Nesic's electrochemical model27 (in 1 bar CO2, 100 ppm HAc and 2 m s−1 flowrate)
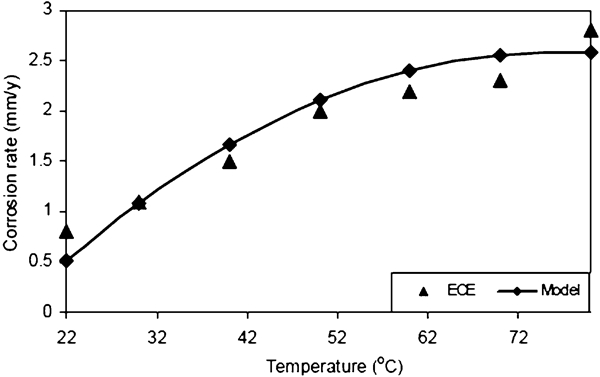
Corrosion rate at varying temperatures: comparison between model and ECE28 (saturated CO2 solutions, 20 ppm HAc, pH 5·5 and stagnant condition)
Conclusions
Based on experimental studies using the RSM, the following can be concluded.
Experimental design
A second order polynomial regression model is adequate to represent the data for all the responses obtained. The corrosion model, which includes the effects of temperature, acetic acid concentration and rotation speed, has a quadratic function and can be fitted well with the values from literature and those calculated by corrosion modelling.
The mathematical models obtained by the RSM can be used to calculate stationary values analytically. The stationary values are useful to determine mechanistic corrosion processes such as scaling temperature, flowrate independent limiting current and flowrate dependent limiting current.
The RSM combining with mechanistic theories is capable to design experiments for corrosion rate prediction in CO2 simultaneously among the variables tested effectively.
Curve relationships
A second order relationship has been found among acetic acid concentration, rotation speed and temperature on corrosion rate, while a linear relationship is found among pH, acetic acid concentration, rotation speed and temperature in lower conditions. As expected, all the dependent variables have a high positive correlation with corrosion rate. While pH and interaction between pH and acetic acid concentration shows a negative correlation. The curve describes that at high acetic acid concentration and temperature, the corrosion rate will go plateau or decrease.
Effects of acetic acid, temperature and rotation speed based on RSM model
At low rotation speed, the effect of temperature is more dominant as compared to that of acetic acid concentration. The dominant effect of temperature compared to rotation speed was also observed at low acetic acid concentration.
Comparing the effects of acetic acid concentration, rotation speed and temperature shows that temperature is dominant in contributing to corrosion rate rather than acetic acid concentration and rotation speed.
Corrosion product formation is an important parameter in defining corrosion model and predicting corrosion rates in systems containing CO2 with acetic acid.
Based on the RSM data and supported by the works of previous researches, rotation speed has less effect than acetic acid and temperature on the corrosion rate of carbon steel in CO2 environment.
Model limitation
The model is developed based on experimental data using the LPR method. Thus, the RSM model presented is suitable for uniform corrosion in activation control conditions. There will be a deviation in results for predicting corrosion in high pressure and high temperature conditions. The RSM model does not account for any precipitation of film formations, localised corrosion and transformation process occurring at the metal surface. The RSM model considers pH, temperature and rotation speed in combination with acetic acid concentration to predict corrosion rates. However, in field conditions, there are other variables such as oxygen, sodium chloride and other species that affect corrosion. Therefore, it is recommended that further study be conducted using the same technique considering other variables such as O2, inhibitor, NaCl and any other species.
Footnotes
Acknowledgements
The authors are thankful to the Universiti Teknologi Petronas for providing grant and facilities for the research.