
Abstract
The mechanical properties of CO2 corrosion scale formed on P110 tubing steel at different temperatures were investigated by nanoindentation, Vickers’ indentation and tensile test. The results showed that hardness, elastic modulus, fracture toughness and bonding strength of the CO2 corrosion scale initially decreased and then increased with increasing the film formation/exposure temperature with the minimum values all presented at 100°C. This trend runs inversely to that of the corrosion rate of P110 carbon steel with increasing the temperature. A scanning electron microscope was also utilised to analyse the morphology of corrosion scale. In addition, the relationship between the mechanical properties of CO2 corrosion scale and the corrosion rate of P110 tubing steel at the corresponding temperature is discussed.
Introduction
Carbon steels are extensively used in oil and gas industries and, for example, APIP110 carbon steel is widely used as tubular goods materials in oil and gas production. However, carbon steels easily suffer from corrosion attack due to the presence of formation waters containing CO2 gas, in which iron carbonate (FeCO3) will be precipitated on the steel surface once the product of the concentration of iron ions and of carbonate ions exceeds the value of the solubility product of iron carbonate (K sp), i.e. Under certain conditions, iron carbonate films are considered to be protective in many cases and to reduce the CR by limiting the transport of chemical species involved in the electrochemical reactions. However, various factors influence the corrosion rate and corrosion morphologies via changing the properties for corrosion scale under working circumstances. Thus, the corrosion behaviour of tubing steel is mainly determined by the properties for corrosion scale.
Previous research has focused mainly on the thermostability, microstructure and composition of such carbonate corrosion scales. Palumbo et al.1 found that siderite showed two relaxation processes and used this in its deposition. Gao et al.2 discussed the initiation and growth of protective corrosion product films such as carbonate scales. In addition, the morphology, cross-section, composition and electrochemical performances of carbonate corrosion scales have been investigated using X-ray photoelectron spectroscopy, X-ray diffraction, scanning electron microscopy and electrochemical impedance spectroscopy.2 – 4 As for mechanical properties, Lin et al.5 investigated the correlation between the structural characteristics and wear resistance of CO2 corrosion scales formed on N80 carbon steel, and Gao et al.6 evaluated the protective ability of CO2 corrosion scale to steel under flow conditions at different CO2 partial pressures. However, the necessary data of the mechanical properties of corrosion scale are still lacking, and some cases are contrary. For example, Yu et al.7 argued that the measured fracture toughness of CO2 corrosion scale grown on N80 tubing steel8 was too high and could not be therefore a fracture toughness value for the film.
The present work focuses on studying the microhardness, elastic modulus, membrane–matrix bonding strength and fracture toughness of CO2 corrosion scales formed at different temperatures and in determining the corresponding corrosion rates.
Experimental
Sample preparation
All specimens used in the present work were cut from a sheet of API P110 tubing carbon steel with a chemical composition of Fe–0·26C–0·19Si–1·37Mn–0·009P–0·004S–0·028Mo–0·028Ni–0·019Cu–0·011Ti (wt-%). The samples were machined with dimensions of 40×10×3 mm. Before each experiment, all the specimens were subsequently ground with 300, 600, 800 and 1200 grit silicon carbide paper and then polished with 3 and 1 μm alumina slurry to obtain a mirror-like surface. Final cleaning used distilled water and anhydrous ethanol; specimens were then weighed using a balance with a precision of ±0·1 mg.
A static autoclave (Cortest Co., USA) was utilised to produce corrosion scales at different temperatures. For each test, 12 samples were prepared in order to ensure the equivalence of corrosion scale growth. For each mechanical measurement (i.e. microhardness, elastic modulus, membrane–matrix bonding strength and fracture toughness), three replicate samples were used to obtain each of the specific properties the scale; another group of samples were used to determine the overall corrosion rate of the carbon steel. The test solution, simulating a formation water in an oil field, was made from deionised water (18 MΩ cm in resistivity) and analytical grade reagents with a concentration (g L−1): 24·1 NaCl, 37·4 KCl, 0·7 CaCl2, 2·6 Na2SO4 and 0·6 MgCl2.6H2O. Before tests, pure N2 was aerated into the solution and bubbled for 12 h in order to remove dissolved oxygen. The autoclave temperature was controlled to the set values of 50, 70, 100 and 130°C, the CO2 partial pressure was maintained at 4 MPa and the total pressure was 10 MPa, the exposure test was carried out for 168 h. After testing, the corroded samples were rinsed with deionised water, dried with anhydrous ethanol and divided into two groups: one group was kept in desiccators for mechanical testing and the other group was used to analyse scale morphology and calculate corrosion rate.
Mechanical properties test
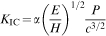
After any loose scale on the surface was removed by light abrasion, the hardness of scale was measured using a nanometer mechanics probe (Nano indenter II) produced by the MTS company with a load of 10 mN; the elastic modulus of CO2 corrosion scale can be obtained based on the load–displacement curve. The fracture toughness K IC was measured on polished cross-sections of corrosion scale by means of Vickers’ microhardness indentation tests, which was calculated according to equation (1)
9
9,10
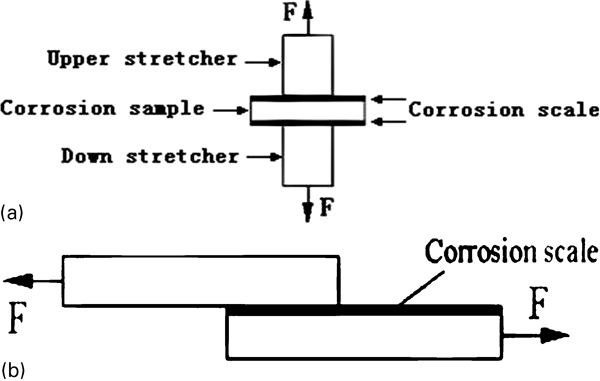
Schematic diagram of bonding strength test
Corrosion rate and morphology
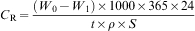
The products on the corroded samples were removed based on the chemical cleanup method according to GB/T 16545-1996 (idt ISO 8407:1991), the film removing liquid is composed of 1 L HCl (ρ = 1·19 g mL−1), 20 g Sb2O3 and 50 g SnCl2, in which the corroded samples were immersed for 10 min, then rinsed with deionised water and anhydrous ethanol, dried in air, and weighed again to calculate the corrosion rate. The corrosion rate C R was reported in mm/year according to the mass loss method via equation (3)
Results and discussion
Hardness and elastic modulus
Figure 2 shows the load–displacement curve of CO2 corrosion scale formed at 100°C, based on which the elastic modulus of the corrosion scale was obtained. The hardness and elastic modulus of the scales formed on P110 carbon steel at different temperatures are shown in Fig. 3, showing an initial decrease followed by an increase with increasing film formation temperature, and where the minimum values were found at 100°C. Generally speaking, the hardness depends on the structure of the CO2 corrosion scale such that the looser the structure, the lower the hardness. The elastic modulus is concerned both with the atomic structure of the scale, which is mainly composed of FeCO3, 3 3,4 and with its porosity. The elastic modulus was found to decrease with increasing the porosity of corrosion scale: the elastic modulus of single crystal FeCO3 was 185 GPa, which decreased to 80 GPa when the porosity of CO2 corrosion scale was 50%.12 In the present paper, the elastic modulus of the scale was found to lie in the range 101-160 GPa, which indicated that there was significant microporosity in the scale and was the reason why the matrix still suffered from corrosion though the protective product film (FeCO3) covered on steel surface.
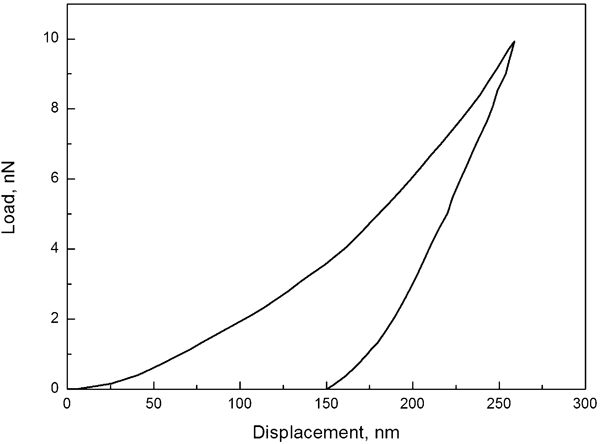
Load–displacement curve of CO2 corrosion scale formed at 100°C by nanohardness tester
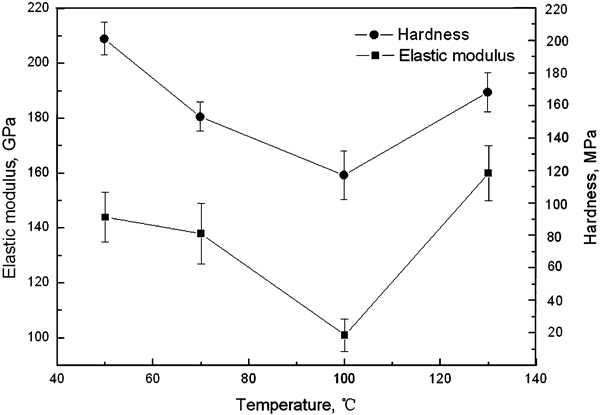
Elasticity modulus and hardness of CO2 corrosion scale formed at different temperatures
Fracture toughness
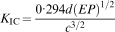
In order to avoid the roughness of the corrosion scale affecting the test results, the fracture toughness K IC was measured by means of Vicker's indentation tests on polished scale cross-sections and calculated based on equation (2). The fracture toughness values decreased to a minimum value and then increased with increasing the film formation temperature as shown in Fig. 4. Yu et al.7 thought that fracture toughness might depend on the grain size of the film, i.e. a bigger grain size could result in a decrease in fracture toughness. At the same time, the thickness of the film also affects fracture toughness; because CO2 corrosion scale is brittle, it is easier to initiate a crack on the top of indentation. A thicker scale would limit the growth of the perpendicular crack and then might promote the propagation of a horizontal crack. Yamashita et al.13 found that CO2 corrosion scales formed at 100°C were thicker and looser. So the fracture toughness of corrosion scale formed at 100°C was the least.
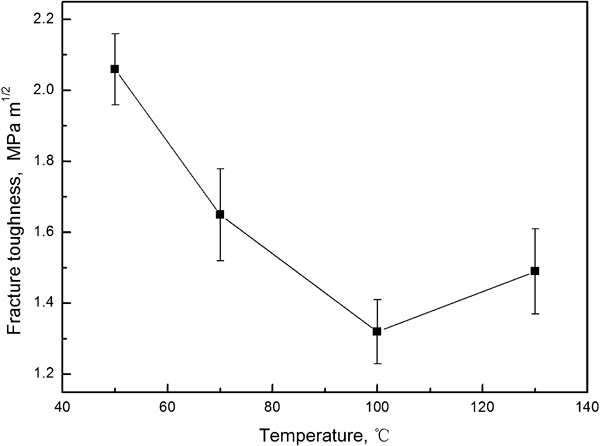
Fracture toughness of CO2 corrosion scale formed at different temperatures
Bonding strength
The bonding strength between the corrosion scale and the matrix is shown in Fig. 5 and presented a similar trend to the other mechanical properties mentioned above. The morphology of the scale after the bonding strength test is shown in Fig. 6. When the film suffered from shear, the fracture surface of the film was relatively orderly showing brittle cleavage fracture as shown in Fig. 6a. While there were some cavities evident on the surface of the film as shown in Fig. 6b after testing in shear, this might be due to an uneven interface. However, under a tensile force, it was easier for corrosion products to be taken pulled out from low pits, resulting in the formation of cavities.
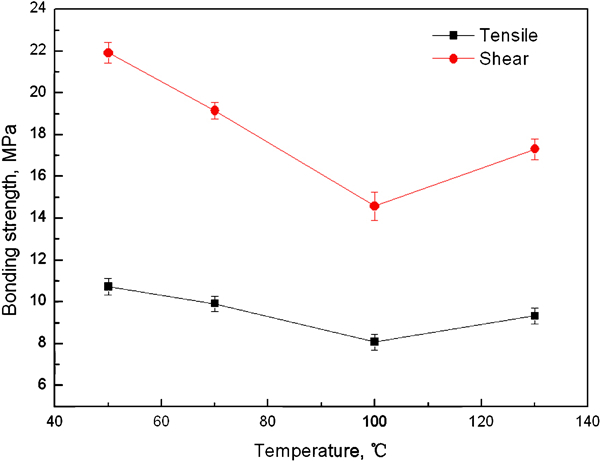
Bonding strength of CO2 corrosion scale formed at different temperatures
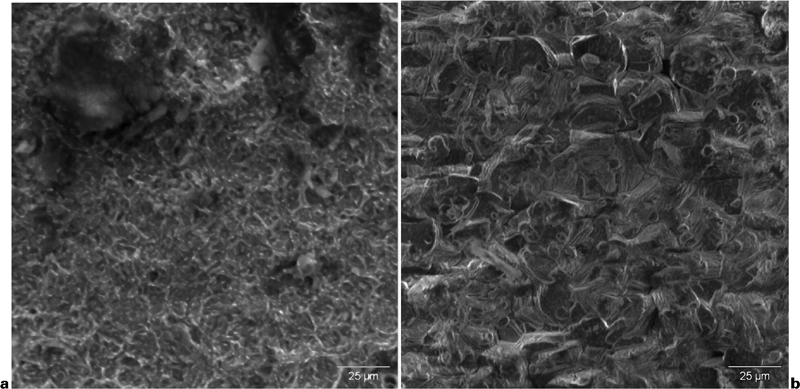
Morphology of CO2 corrosion scale formed at 100°C after bonding strength testing
Corrosion rate and morphology
The corrosion rate of P110 tubing steel increased to a maximum value and then decreased with increasing the temperature. The maximum value lay at 100°C as shown in Fig. 7, which is in line with previous research,14 and the variation in corrosion rate is inverse to that of the mechanical properties of corrosion scale with increasing the temperature. Figure 8a shows the morphology of CO2 corrosion scale formed at 100°C; the structure was looser and more porous than that formed at other temperatures. The cross-section micrographs of corrosion scale formed at 100°C as shown in Fig. 8b also showed this effect with the scale being thicker (∼200 μm) and composed of two layers, with the outer layer covered by looser deposits with a thickness of 40 μm. This structural characteristic of the corrosion scale determined the variation trend of mechanical properties. It is interesting that P110 tubing steel suffered from uniform corrosion based on the even interface between corrosion scale and the matrix.
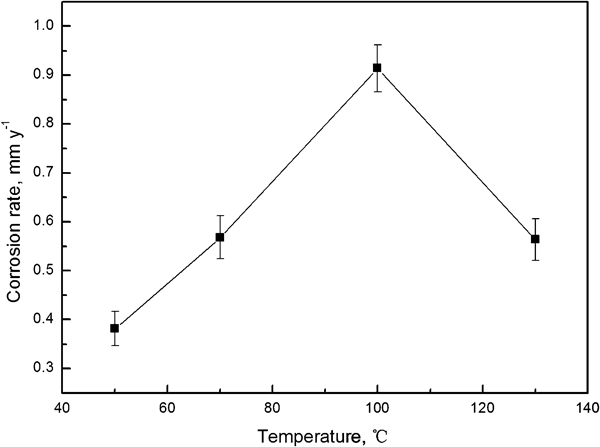
Corrosion rate of P110 tubing steel at different temperatures
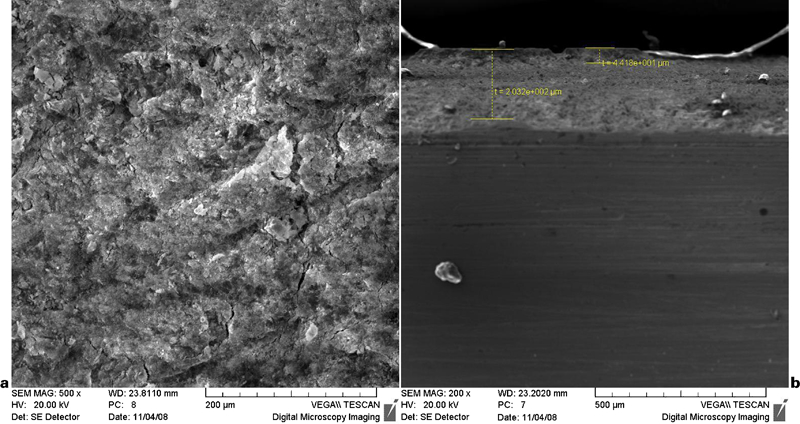
Morphology of CO2 corrosion scale formed at 100°C
Relationship of mechanical properties and corrosion rate
As is well known, when a material is covered with a protective corrosion scale, generally the more compact the structure of the scale the smaller the corrosion rate. The hardness of CO2 corrosion scale shows the resistance to deformation or fracture caused by the extraneous pressure and reflects the cohesive bonding strength among atoms or molecules in the film layer. The adhesive bonding strength between film and matrix refers to the blocking property at the interface and also reflects the bonding strength between atoms or molecules of the film layer and iron atoms of the matrix. Since tube steel suffers from mechanical influences under the operating condition, such as the shear stress of different fluid states, load and the internal stress, etc., the mechanical properties of corrosion scale determines the extent of damage and reflects the protective degree for the substrate. Thus, reduced mechanical properties of the CO2 corrosion scale can more easily lead to cohesive (internal) scale rupture and also adhesive failure away from the matrix. In this condition, a greater superficial area of the matrix will be exposed to the corrosive medium, which promotes the increase in corrosion rate. The relationship between corrosion rate of P110 carbon and hardness of corrosion scale formed at different temperatures as shown in Fig. 9.
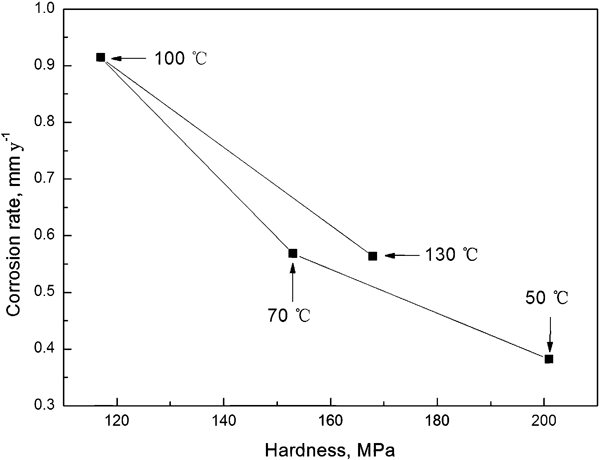
Relationship between corrosion rate of P110 carbon steel and hardness of corrosion scale formed at different temperatures
Conclusions
The mechanical properties of carbonate corrosion scale initially decreased and then increased with increasing the film formation temperature, with the minimum values for these properties being at 100°C. The variation of mechanical properties in the corrosion scale was inverse to the corrosion rate of P110 tubing steel with increasing the temperature. Scale thickness, microstructure, porosity and composition of the corrosion scale were the key factors affecting its mechanical properties that, in turn, influenced the corrosion rate of P110 carbon steel.
Footnotes
Acknowledgements
Doctoral Candidate Innovation Research Support Program by Science and Technology Review (KJDB201001-4) and Key Laboratory Opening Fund for Corrosion and Protection of Tubular Goods Research Institute of China National Petroleum Corporation are gratefully acknowledged.