
Abstract
Anisotropy in stress corrosion cracking of lean grade UNS S32101 and standard grade UNS S32205 hot rolled duplex stainless steels was evaluated in this study. Microstructures were characterised with stereology methods in three orthogonal orientations to quantify anisotropy in phase distribution. Constant extension rate tests were conducted in an autoclave at 2×10⁻⁶ s−1 in chloride containing alkaline sulphide solution at 170°C. The maximum crack lengths and average crack densities were measured for the rolling longitudinal and transverse longitudinal orientations after stress corrosion cracking tests. Results indicate that stress corrosion crack initiation and growth are a strong function of the microstructure in each orientation. Maximum crack length and average crack density were maximum for the rolling longitudinal orientation. Crack initiation and growth were favoured along the transverse direction. Chlorides enhanced anisotropy in crack growth behaviour by facilitating crack initiation and crack coalescence along phase boundaries, which lead to more severe stress corrosion cracking in the alkaline sulphide environments that were studied.
Introduction
Hot or cold deformation to produce wrought duplex stainless steels (DSSs) leads to alignment of grains along the deformation direction. Furthermore, deformation induces microstructural fibering, producing elongated grains or bands in the microstructure. Owing to pronounced microstructural anisotropy, mechanical anisotropy is seen in these materials. A large number of mechanical and physical properties describing the macroscopic behaviour of DSSs, such as uniaxial yield and ultimate strength, fatigue resistance, fracture toughness and stress corrosion cracking (SCC) behaviour, are influenced by anisotropy. Directionality effects have been shown in UNS S32205 (DSS 2205) by both Hutchinson et al.1 and ul-Haq et al. 2 2,3 These effects were shown to be more significant in the cold rolled case as compared to that in the hot rolled steel case, with greater anisotropy for decreasing plate thickness (i.e. increasing rolling reduction).
DSSs, which contain 20-29%Cr, 1-7%Ni and 0·15-0·25%N, obtain a balanced microstructure of primarily face centred cubic austenite (γ) and body centred cubic (bcc) ferrite (α) phase through hot and/or cold rolling followed by suitable annealing and quenching. Careful selection of the processing parameters ensures favourable mechanical properties as well as corrosion resistance. DSSs offer benefits of both fully austenitic and ferritic stainless steels. As a consequence of their favourable properties in corrosive environments,4 – 6 DSSs are often selected for the pulp and paper, chemical, petrochemical, offshore and power industries.
The implication of microstructural anisotropy on SCC of DSSs remains unclear from the published literature. Former laboratory efforts to study the corrosion and SCC behaviour of DSSs in hot alkaline sulphide solution have shown that the austenitic phase is selectively attacked.7 – 9 Other studies in hot chloride solutions 10 10,11 have shown that the ferrite phase is more susceptible. The susceptibility of individual phases will be a function of alloy composition, microstructural anisotropy and mechanical anisotropy. The present study was planned to quantify the SCC susceptibility in terms of maximum crack lengths and crack densities for different microstructure orientations of two DSSs tested in a hot alkaline sulphide solution, where SCC had been observed previously. 8 8,9
Experimental
The materials under study were standard DSS grade, UNS S32205 (Fe–22·5Cr–5·5Ni–3Mo–0·25N) and lean grade UNS S32101 (DSS 2101) (Fe–21·5Cr–1·5Ni–0·5Mo–0·20N). Round tensile samples were machined from the as received material, which was provided as 9·5 mm thick, hot rolled and coil processed DSS plate with a no. 1 finish in accordance with ASTM A480. These samples were tested for their SCC susceptibility by the constant extension rate test method. The microstructure is anisotropic for these alloys as shown in Fig. 1. Orientations in Fig. 1 are described as follows: transverse direction (TD), rolling direction (RD), normal direction (ND), rolling longitudinal (RL), transverse longitudinal (TL) and transverse short (TS).
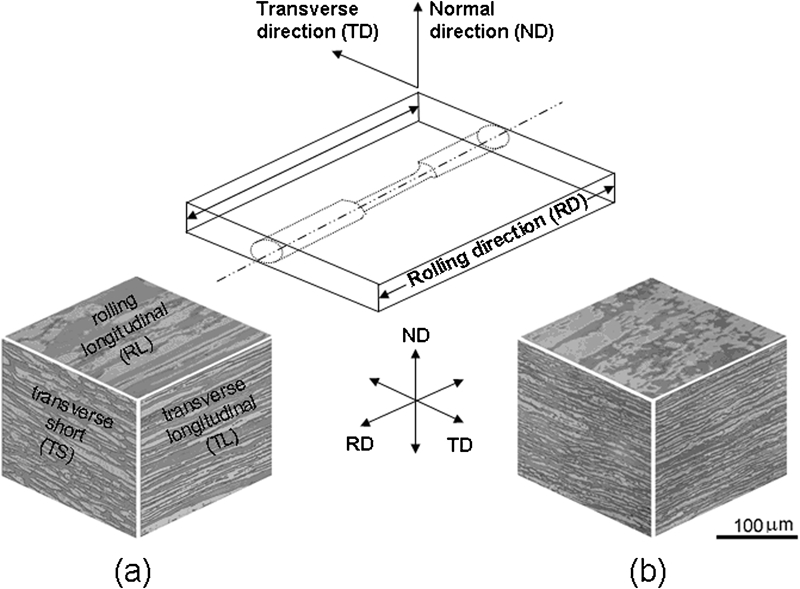
Three-dimensional micrographs (×200) of duplex stainless steels (electrolytic etch: 40%NaOH, 3·5 V for 5 s)
Table 1 provides a summary of quantitative stereology conducted to characterise the microstructure. Two fields of view (quadrants) from each orthogonal orientation were photographed with optical microscopy at ×200 magnification. A grid was intentionally placed parallel to the elongated bands of austenite. Quantification of the austenite phase (light etching regions in Fig. 1) in the ferrite matrix was undertaken using the method of point counting12 to determine the average area fraction of austenite Aγ, number of point interceptions per test length N L and lineal fraction L L for the RL and TL orientations. Crack growth was primarily along the TD or ND as the load was applied normal to these directions. The mean intercept length was calculated based on L L/N L. A higher mean intercept length is indicative of a longer continuous austenite phase in a given orientation, providing higher probability of preferential stress corrosion crack growth in that direction. The results indicate that the highest mean intercept length corresponded to the RL orientation in both materials under study.
Quantitative stereology parameters for austenite phase (light etching phase)
Vickers microhardness (HV25) was measured for austenite and ferrite phases in the different orientations as shown in Table 2. Ten measurements were made in the two phases for each orientation of the materials. The results show that the austenite and ferrite phases had similar hardness in the DSS 2205 material. Moreover, there was a relatively small difference in hardness for the different orientations. However, a different trend was observed in the DSS 2101 where the austenite phase was appreciably harder than the ferrite phase. This behaviour has previously been attributed to solid solution strengthening from nitrogen.13 Strain hardening effects during quenching may also influence the hardness values. The hardness of the austenite phase was greatest in the TL orientation for DSS 2101.
Vickers microhardness (HV25) of as received UNS S32205 and UNS S32101
Test solutions were composed of 150 g L−1 NaOH and 50 g L−1 Na2S with various amounts (0-100 g L−1) of NaCl. Previous laboratory studies 8 8,9 have used solutions containing only 150 g L−1 NaOH and 50 g L−1 Na2S to simulate kraft digesting environments used in the pulp and paper industry and showed that DSS 2205 is susceptible to SCC. Recent field experience14 also suggests that DSS 2205 is susceptible to SCC in pulping liquors containing high concentrations of chlorides. Chlorides were thus added to the environments in the current study.
CERT were conducted in an autoclave at 170°C to evaluate the effect of microstructural anisotropy on the SCC behaviour of DSSs. Samples were tested at an initial strain rate of 2×10⁻⁶ s−1, and the load was applied along the RD. Tests on control specimens were conducted in sand at 170°C for comparison. Fractured tensile specimens were mounted and polished using standard laboratory practices. The maximum crack length (μm) and average crack density (mm−1) in the plastically deformed (necking) region of the samples were measured in order to quantify the severity of SCC for the RL and TL orientations. Select samples were characterised with scanning electron microscopy (SEM) equipped with an energy dispersive X-ray spectrometer.
Results and discussion
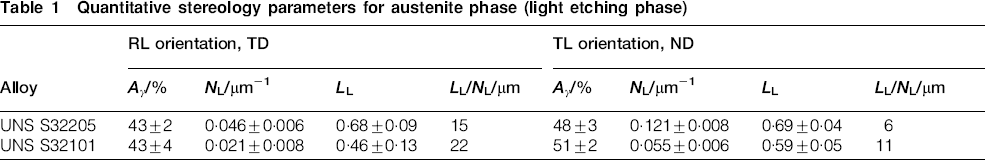
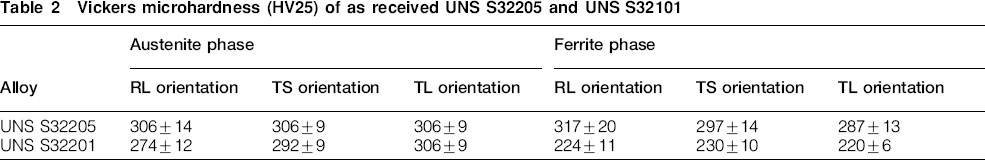
Transgranular stress corrosion cracks (TGSCCs) were found to initiate and propagate predominantly in the austenite phase (light etching phase in optical images of Fig. 1) and along phase interfaces as shown in Fig. 2. While crack growth was primarily normal to the RD, deep cracks grew at phase interfaces along the RD as shown in the cross-sectioned samples of Fig. 2. Selective corrosion of phase interfaces, which facilitated crack propagation, became more pronounced in the presence of chloride as shown in Fig. 3. Slip steps can be observed on the austenite phase (dark phase in SEM images in Fig. 3b and d) in both materials. Cracking was often found in the surface affected layers of both materials; however, cracks in the surface affected layers did not continue into the base material, indicating that selective corrosion of the base material preceded crack propagation. The surface films generally became more defective and less adherent with increasing chloride content for both DSS 2205 and DSS 2101 in the solutions as evident by Fig. 4. Energy dispersive X-ray spectroscopy of the surface affected layers indicated that the films were enriched in Cr and Ni and depleted in Fe, Mn and Mo relative to the nominal base material compositions. Sulphur was detected in all films. Enrichment of Cr and Ni were enhanced by the presence of chloride.
Optical micrographs showing transgranular stress corrosion cracking of a, b UNS S32205 and c, d UNS S32101 tested in 100 g L−1 NaOH+55 g L−1 Na2S at 170°C
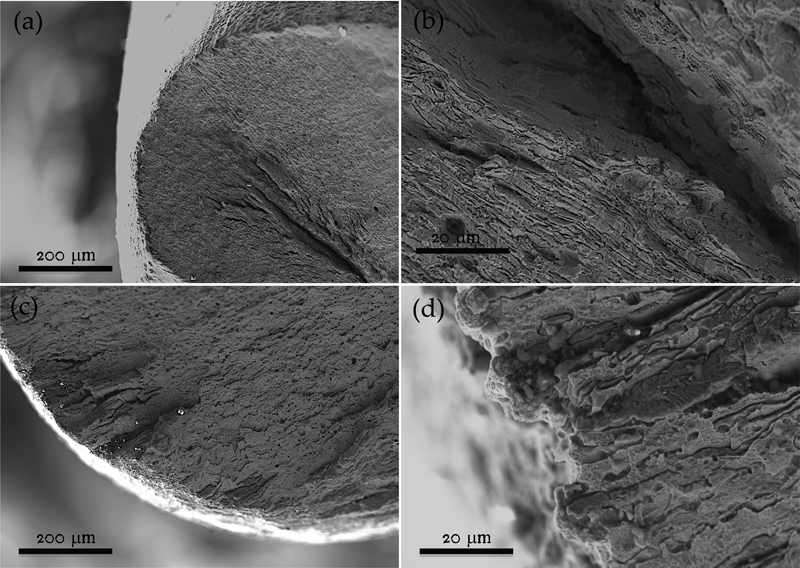
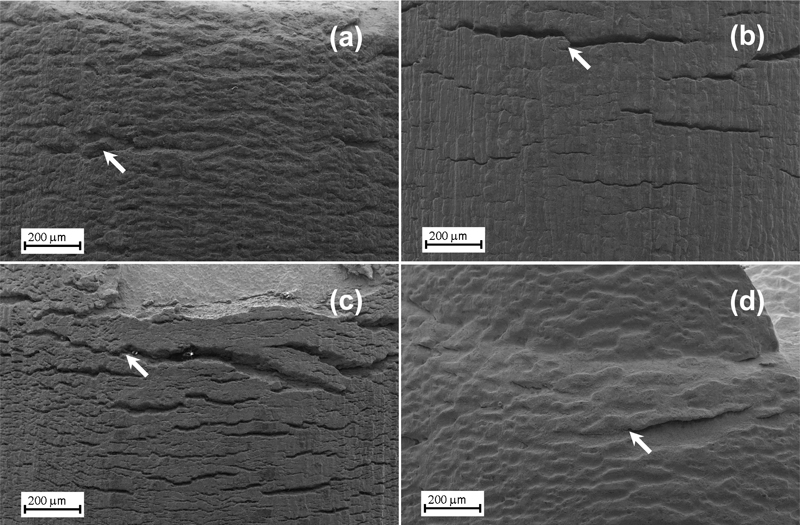
Scanning electron micrographs of fractured surfaces of a, b UNS S32205 and c, d UNS S32101 tested in 150 g L−1 NaOH+50 g L−1 Na2S+10 g L−1 NaCl at 170°C: micrographs in b and d are higher magnification regions of a and c
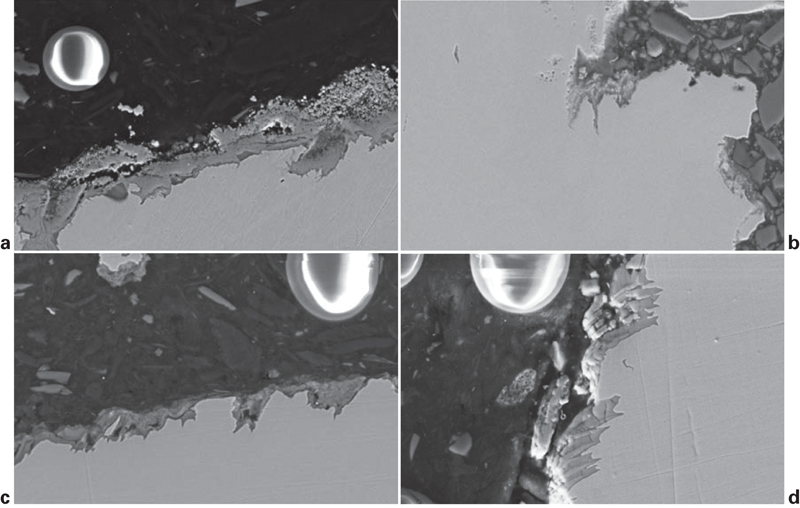
Scanning electron micrographs showing surface film at crack tip on a, b UNS S32101 and c, d UNS S32205 tested in 150 g L−1 NaOH+50 g L−1 Na2S with a, c 0 g L−1 NaCl and b, d with 10 g L−1 NaCl at 170°C
Owing to anisotropy in the material microstructures, elliptical fracture surfaces were observed in the fracture surfaces as shown for DSS 2205 in Fig. 5. Similar behaviour was found for DSS 2101. Severe SCC cracks were apparent along the TD, particularly with 2-10 g L−1 of NaCl for UNS S32205 and 10-100 g L−1 of NaCl for DSS 2101. It is worth mentioning that cracks along the TD were observed in the RL orientation, and cracks in the ND were observed in the TL orientation. Significant differences in the maximum crack length and crack density were found for the RL orientation and TL orientation of the DSS 2205 and DSS 2101 samples, as shown in Figure 6 Figs. 6 and 7 respectively. Maximum crack length was taken as the linear distance from the crack tip of the longest crack, normal to the surface in the mounted samples. The only measured crack growth was normal to the RD or the applied load. Crack density is defined as the number of cracks per millimetre of the gage section. Higher crack density indicates a greater number of nucleation sites for crack initiation. The differences in crack density and maximum crack length between the two orientations indicate that crack initiation and crack propagation were favoured in the TD along phase interfaces. This behaviour occurred more readily in DSS 2101 than in DSS 2205 inthe highest concentrations of chloride (10-100 g L−1); however, DSS 2205 became more susceptible to TGSCC in lower concentrations of chloride (0-10 g L−1) where selective corrosion of the austenite phase had occurred. While the relative crack densities for the two materials were similar, the maximum crack lengths varied depending on the chloride concentration. Most cracks were found in the necked region in this material–environment system, indicating that the stresses required for crack initiation were close to the ultimate tensile strength of these materials.
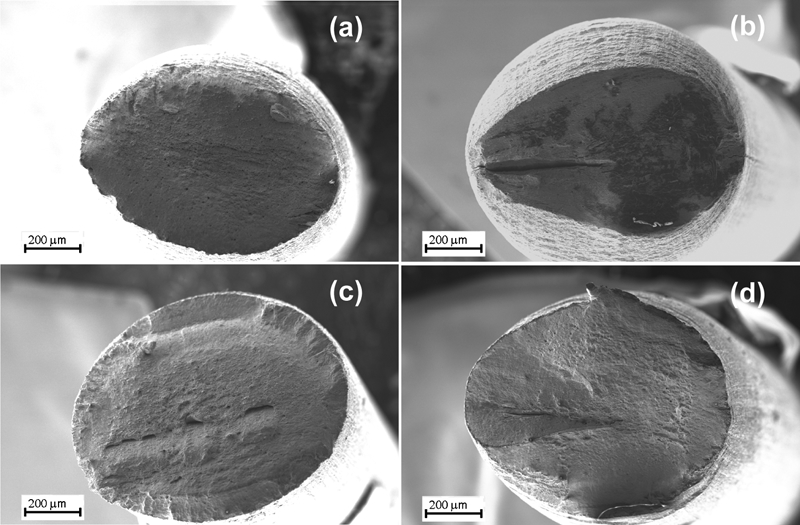
Scanning electron micrographs of fractured surfaces of UNS S32205 tested at 170°C in alkaline sulphide solution (150 g L−1 NaOH+50 g L−1 Na2S) containing a 0·5 g L−1 NaCl, b 2 g L−1 NaCl, c 5 g L−1 NaCl and d 10 g L−1 NaCl
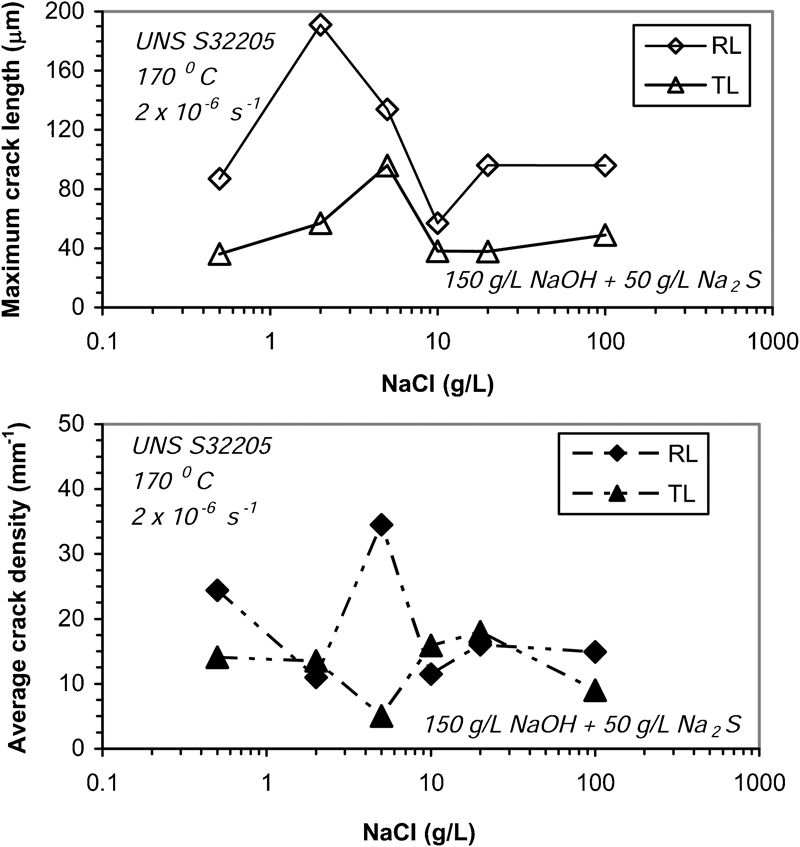
Comparison of maximum crack length (μm) and crack density (mm−1) for the RL and TL orientations of UNS S32205 samples tested at 170°C in alkaline sulphide solution (150 g L−1 NaOH+50 g L−1 Na2S) containing various amounts of chlorides
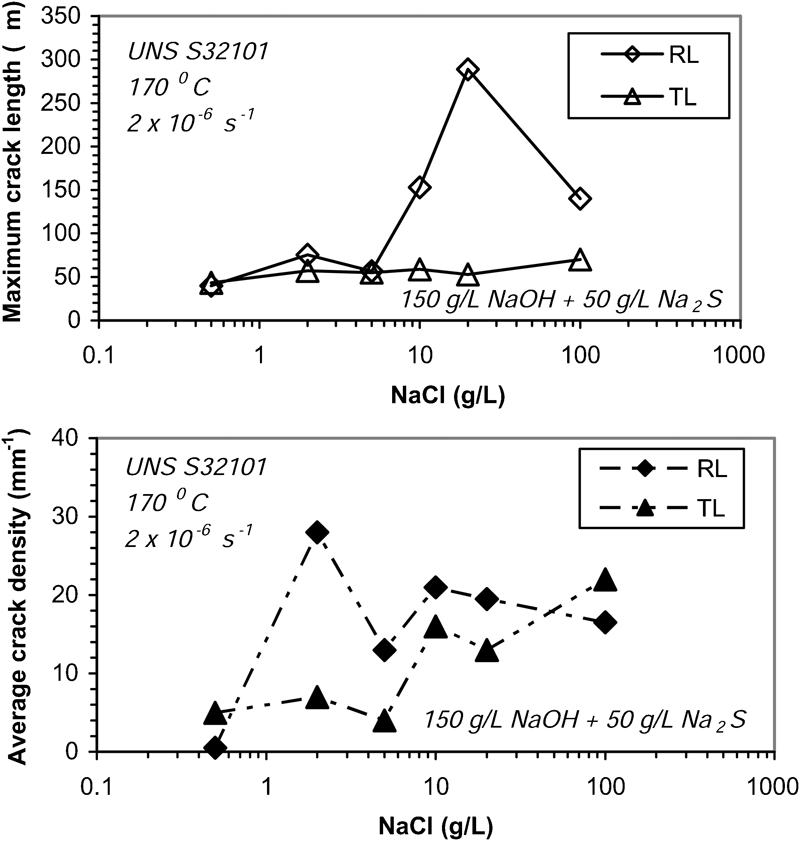
Comparison of maximum crack length (μm) and crack density (mm−1) for RL and TL of UNS S32101 samples tested at 170°C in alkaline sulphide solution (150 g L−1 NaOH+50 g L−1 Na2S) containing various amounts of chlorides
It has been shown previously1 – 3 that hot rolled DSS plates can have unusually large anisotropy of strength due to texture hardening. Furthermore, others14 – 16 measured the microstresses in the austenite and ferrite phases during loading. The austenite phase has been reported to be under residual tension, while the ferrite phase is under residual compression due to a coefficient of thermal expansion mismatch. The microhardness values measured in Table 2 indicated that the austenite was as hard as the ferrite phase in DSS 2205 and harder in DSS 2101. Therefore, the tensile strength of the austenite phase must be equal to or higher than the ferritic phase.14
The susceptibility of a material to SCC in a given environment strongly depends on the propensity for crack nucleation and crack propagation. Crack initiation in both tested DSSs was found to be in the austenite phase or at the austenite–ferrite phase boundaries, which is similar to previously reported observations in alkaline sulphide solution.7 – 9 Solution composition was found to strongly influence the crack initiation process, whereby cracks initiate where dissolution rates are the highest (i.e. the austenite phase due to lower chromium content).
Anisotropic microstructures of DSS in different directions influence the initiation and growth of stress corrosion cracks. Data in Table 1 indicate that the RL orientation had the highest mean intercept length in both DSSs 2205 and 2101. The austenite phase is more susceptible in alkaline solution, so the distribution of austenite phase at the surface affects the crack initiation, while the crack growth depends on the continuation of susceptible phase in a particular direction. This observation is also reflected by the crack density and growth differences in RL and TL directions for DSS 2205 and 2101 in Figure 2 Figs. 2 and 3 respectively. The numbers of crack initiation sites as indicated by the average crack densities and the maximum crack lengths are greater for the RL orientation in both DSS alloys tested in this study.
When multiple cracks initiate at the surface, crack coalescence can influence the overall crack growth rate and failure.17 An increase in crack density and crack length will favour crack coalescence or the tendency of neighbouring cracks to coalesce to form longer cracks. Owing to anisotropy and differences in the crack densities in different orientation, the probability of crack coalescence is also affected. Images (SEM) showed a greater number of crack coalescences for the RL orientation as compared to the TL orientation. Images (SEM) in Fig. 8 also show an increase in crack density and therefore the number of crack coalescences with increasing chloride content from 0·5 to 10 g L−1 NaCl, followed by a decrease in coalescence with increasing chloride due to more dissolution of Fe, Mn and Mo based on the composition of the surface films.
Scanning electron micrographs showing stress corrosion crack coalescence on RL orientation of UNS S32205 samples tested at 170°C in alkaline sulphide solution (150 g L−1 NaOH+50 g L−1 Na2S) containing a 0·5 g L−1 NaCl, b 5 g L−1 NaCl, c 10 g L−1 NaCl and d 100 g L−1 NaCl: solid arrows indicate large coalesced surface cracks
Microhardness data in Table 2 showed that the austenite phase in the TL orientation was harder than the RL orientation for DSS 2101, while no difference was found for DSS 2205. The difference in crack nucleation may also be attributed to texture arising from hot rolling,1 – 3 but no attempt was made to characterise texture in these materials. Texture in rolled grade 2205 DSS is well documented, and the results have shown texture of primarily components (100)[011]α in the ferrite phase and (110)[−112]γ and (110)[1-1–2]γ in the austenite phase. Anisotropy influences the tendency for cracks to nucleate and grow at regions of high stress.14 – 16 The anisotropic behaviour observed for the as received material indicates that texture effects will also strongly influence the crack growth behaviour in SCC.
Conclusions
The results indicate that microstructural anisotropy has an effect on the stress corrosion crack growth behaviour for hot rolled DSSs tested in an alkaline sulphide solution containing chlorides. Large differences in the maximum crack length and average crack density were found between the RL and TL orientations in both UNS S32205 and UNS S32101. The differences are due to the differences in the phase distribution in different directions in the as received DSS material. This anisotropy influences the SCC susceptibility by favouring crack nucleation in the austenite phase and at phase interfaces. The subsequent crack growth and coalescence of neighbouring cracks are influenced as a result. These cracks combine to form larger cracks, particularly in the presence of chlorides. Crack growth along the TD is favoured in the as received materials. Sample orientation is important when characterising SCC, particularly for round specimens machined from hot rolled plate.
Footnotes
Acknowledgements
This work was supported by TIP3 (State of Georgia) and the member companies of the Institute of Paper Science and Technology, Georgia Tech. The author (K. Chasse) would also like to thank IPST at Georgia Tech for the Otto Kress Paper Science and Engineering graduate student fellowship. Outokumpu Stainless Ltd donated material for this research.