
Abstract
AlMgSi0·5–C35 friction welds were exposed to marine climate in Helgoland for 2 years. The corrosion products formed on the samples were investigated in view of their electrochemical reactivity, morphology as well as chemical and phase compositions. Various types of corrosion attack (atmospheric corrosion, bimetallic corrosion and pitting corrosion) were verified. Generally, the corrosion attack of C35 is stronger than that of aluminium. Aluminium serves as a sacrificial electrode only close to the welding plane. The rust scale formed on the steel side of the friction weld mainly consists of γ-FeOOH and α-FeOOH. Despite the significant chloride concentration inside the rust layer, no β-FeOOH was found. As it is well known, only the γ-FeOOH phase is electrochemically highly reactive and can be reduced to Fe3O4, depending on the polarisation potential. The reduction of γ-FeOOH is associated with an increase of oxygen reduction.
Introduction
Aluminium–steel friction welds (FWs) have been successfully applied in the automotive industry for ∼35 years.1 The technology of friction welding is also applied in the aircraft manufacturing industry and naval architecture.2 – 4 A great advantage of FW is the chance to join dissimilar materials with varying properties, e.g. with strongly different melting points such as aluminium and steel. This advantage for design engineering can be a disadvantage from the viewpoint of corrosion protection. Therefore, usage of aluminium–steel FWs as structural component in products of the aforementioned manufacturers requires knowledge of the corrosion behaviour under atmospheric conditions. Especially in view of naval architecture, but also in aircraft and automotive manufacturing, the corrosion behaviour of aluminium–steel FW in marine climate is of great interest. Thereby, it has to be stressed that in addition to the marine atmospheric corrosion load, the bimetallic corrosion influences the behaviour of both dissimilar materials due to the FW joint.
The atmospheric corrosion load, in general, is characterised by the change between wet and dry periods. The so called dry–wet–dry (dwd) cycle is a very important feature of atmospheric corrosion.5 In consequence, a sequential growth of corrosion products caused by the repetitive change of environmental conditions during the dwd cycles is observed.5 According to the fundamental research of Stratmann and co-workers (see e.g. Refs. 6−14) about the electrochemical behaviour of iron oxides and the atmospheric corrosion of iron and low alloyed steel, the reactivity of the rust layer depends on its phase composition and morphology. Therein, γ-FeOOH plays a key role. As Stratmann and co-workers show, the dwd cycle is associated with a potential change from approximately 300 to −300 mV(SHE) back and forth.9,10 This negative potential shift results in a reduction of γ-FeOOH and leads to an increase of the electron conductivity inside the rust layer and above all to an increase of the oxygen reduction, especially in the period of drying after wetting. Consequently, the corrosion rate significantly increases.11,13
The atmospheric exposure in marine climate is a stress test for materials and frequently used as worst case scenario for corrosion prediction. The climate is characterised by a marine aerosol with high concentration of chlorides associated with a high relative humidity and frequent intervals of wetting. These specific conditions influence the chemical and structural compositions of the generated rust scale. A number of publications,15 – 19 but not all (see e.g. Refs. 20 and 21), report the formation of β-FeOOH in rust scales weathered in marine atmosphere. In these publications, β-FeOOH is also described as an active phase that accelerates the corrosion rate.18
On the aluminium part of the FW, the oxide scale generally consists of a very thin film of amorphous Al2O3 covered by a gel-like Al[Ox(OH)y(H2O)z] film. The gel-like alumina can transform to AlOOH and further on to Al(OH)3 over time (see e.g. Refs. 22-24). Usually, the oxide scale is a proper protection against corrosion, but not under marine conditions. In the presence of chloride ions, various chloro-aluminates {e.g. Al[Ox(OH)y−1Cl(H2O)z]; AlOCl or AlClx(OH)3−x} can be formed, which weaken the passive behaviour of aluminium oxide films and lead to dangerous pitting corrosion.24,25 However, in contrast to the iron oxide layer, the aluminium oxide layer is not reducible, and the valence of Al ions is always +3. Therefore, the electron conductivity can be negligible in this case.
The brief discussion above clearly shows the relevance of the phase composition of the rust scale. The properties and behaviour of the formed corrosion products are the result of a complex interplay of ever changing corrosion conditions. Structure, morphology and phase composition are mainly responsible for the reactivity, solubility and by association the electrochemical behaviour and further corrosion susceptibility. In case of the C35–AlMgSi0·5 FW, the corrosion process leads to oxide layer growth on two dissimilar materials. As would be expected, the outdoor weathering of FWs leads to more or less severe corrosion attack of the samples and the formation of thick and closed layers of corrosion products. As aforementioned, the FW of dissimilar materials represents a bimetallic contact that exacerbated the susceptibility to corrosion. In addition, it has to be attended that the bimetallic corrosion influences the development of corrosion product layers, depending on the distance of the welding plane.
Hence, we investigated the corrosion products on the samples as well as the electrochemical behaviour with high lateral resolution. As we have recently shown, the microcapillary technique is suitable to describe the electrochemical behaviour of oxide layers on AlMgSi0·5–C35 FW.26 Additionally, the corrosion products were investigated by scanning electron microscopy (SEM) and Raman spectroscopy to determine the morphology and composition of the rust scale.
Experimental
Sample preparation and exposure in marine atmosphere
The FW samples consist of cylindrical rods (diameter: 13·7 mm) of unalloyed steel C35 on the one side and AlMgSi0·5 on the other side. The samples were produced at HAW Hamburg on an FW machine (KUKA RS4). The welding conditions are shown in Table 1.
Parameters of FW process
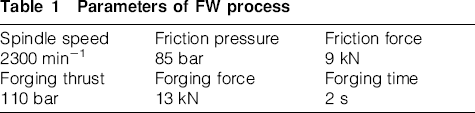
The HAW Hamburg (B. Arnold) operates a test site located in North Sea in the island Helgoland (Fig. 1). According to the classification of the International Standard Organization, the corrosion load in the Helgoland test site is rated in category C5-M.27 The FWs were atmospherically exposed under these conditions over a period of 24 months. The composition of the marine aerosol can strongly fluctuate. Measurements showed a chloride concentration between 500 and 8000 ng m−3.28
Friction weld samples on natural test site in Helgoland
Electrochemical experiments and material investigations
The FW samples were used for electrochemical investigation as delivered after weathering in Helgoland. The electrochemical measurements were carried out with a microcapillary cell. The cell design has recently been described in Refs. 26 and 29. An Ag/AgCl reference electrode (World Precision Instruments; Ag/AgCl/3M KCl (SSE), φ = 207 mV(SHE) is incorporated into the cell body. The capillary tip is positioned on the surface of the sample, whereby a polarisation microscope (Fa. Mitutoyo) allows the exact localisation of the investigated points. The capillary diameter was ∼120 μm, which results in an area of the working electrode of A≈1·15×10−4 cm−2. A gold wire placed into the glass capillary works as a counter electrode. As an electrolyte, an acetate buffer solution (pH 5·9) consisting of 0·05 mol L−1 CH3COOH and 0·9 mol L−1 CH3COONa was used. The potentiostat applied for the measurements is a Reference 600 (Gamry).
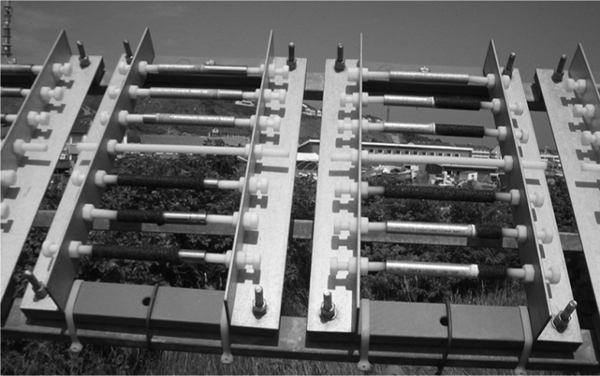
The electrochemical measurements were carried out on several sites on the sample axis perpendicular to the FW. The open circuit potential (ocp) measurements were performed for 5 min or until the potential stabilised. The spots for cathodic polarisation experiments are marked with circles in Fig. 2a. In these experiments, the sample was potentiostatically polarised in the potential range of φ = 0·2 to −0·6 V(SSE)≈0·41 to −0·39 V(SHE) with a stepwise potential decrease of 100 mV per step. The duration of each step was 5 min.
Chronoamperometric measurements on various sites of AlMgSi0·5–C35 FW sample in acetate buffer solution
The Raman spectroscopy was performed with a portable device (i-Raman, BWTek). It includes a 785±0·03 nm wavelength laser (CleanLaze) and a thermoelectrically cooled 2048 pixel charge coupled device detector with a spectral resolution of 5 cm−1. The spectra were recorded with laser power in the range of 30-120 mW and integration time between 60 and 120 s. In case of in situ Raman spectroscopy, the whole C35 side of the FW sample was polarised in a conventional three-electrode cell set-up with gold as counter electrode and Ag/AgCl reference electrode using acetate buffer solution. Potentiostatic potentials were decreased in 100 mV steps from φ = −0·1 to −0·6 V(SSE). Every potential was applied for 12 min. During this time, six Raman spectra per potential step were recorded.
The surface morphology investigation and the energy dispersive X-ray (EDX) measurement were carried out with a field emission SEM (Leo 982 Gemini) coupled with an EDX analyser (Oxford Instruments).
Results and discussion
Electrochemical measurements
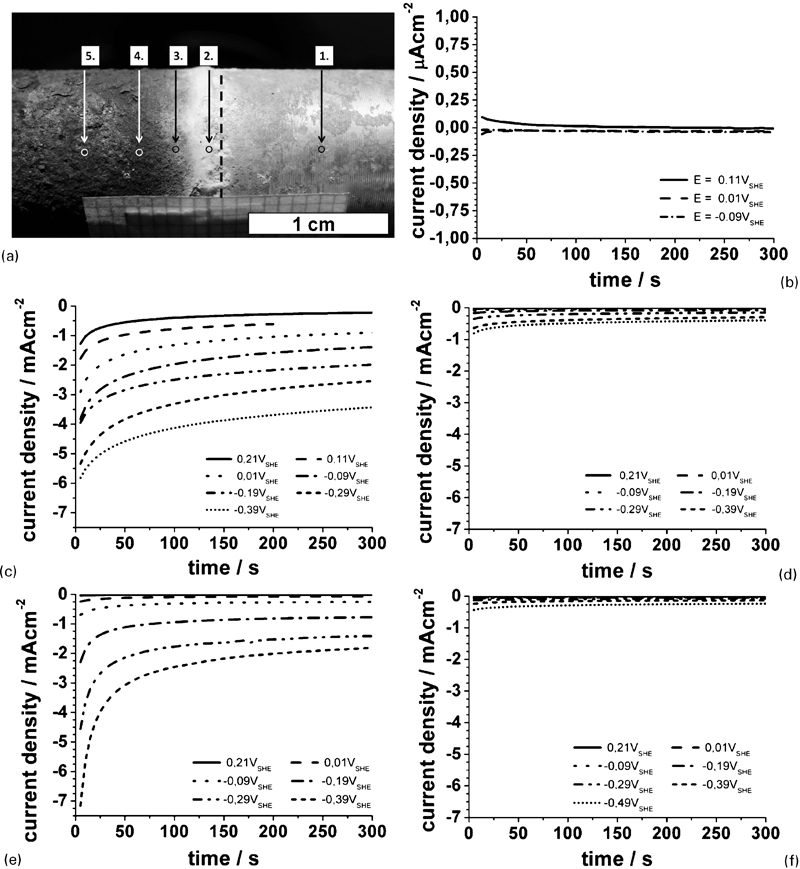
Figure 3 gives an overview of the surface situation of the FW sample after natural weathering in marine climate. On the left side of the sample, C35 shows a rust layer that obviously has an inhomogeneous morphology. On the right side, the AlMgSi0·5 alloy even shows an inhomogeneous surface morphology partially covered by a thick oxide film beside thinly covered areas and, of course, pits. The layer morphology and structure will be discussed in detail later on. The electrochemical measurements are focused in the range −10 mm<x<10 mm from the welding plane (x = 0). In contrast to conventional fusion welds, the reaction zone (RZ) and the mechanical heat affected zone (MHAZ) of an FW are very small (in summary <0·5 mm).26 This means that the investigated surface range comprises the RZ, the MHAZ and both parent metals.
Light microscopic image of FW sample after exposure in marine climate over 2 years: overlaid diagram shows measured ocp in NaAc/HAc, depending on distance of welding plane (broken line)
The overlaid diagram (Fig. 3) shows the ocp measured along a longitudinal sample axis perpendicular to the welding plane. The scales have been adjusted, so the distance x = 0 mm in the diagram (broken line) is identical with the welding plane of the sample. Starting at the steel side, where the ocp is approximately φ≈0·2-0·4 V(SSE)≈0·4-0·6 V(SHE), the potential decreases near the welding plane and drops down immediately behind the welding plane on the aluminium site to approximately φ≈−0·2 V(SSE)≈−0·01 V(SHE). This ocp is measured up to a distance of x = 8 mm from the welding plane. Figure 4 shows the diameter d of the sample covered corrosion products. The original diameter of 13·7 mm is almost unchanged on the aluminium side (x⩾2 mm). The visible oxide film seems to be very thin, and in a few places, the tracks of the mechanical treatment before exposure are recognisable. However, on the steel side (x⩾−2 mm), the sample diameter increases by Δd = 0·2 mm owing to the rust formation. Close to the welding plane, the oxide growth likewise leads to an increase of the sample diameter. However, the oxide layer thickness is asymmetric. On the steel side (x = −1 mm), it amounts to Δd = 0·3 mm, and on the aluminium side (x = 1 mm), Δd = 0·1 mm.
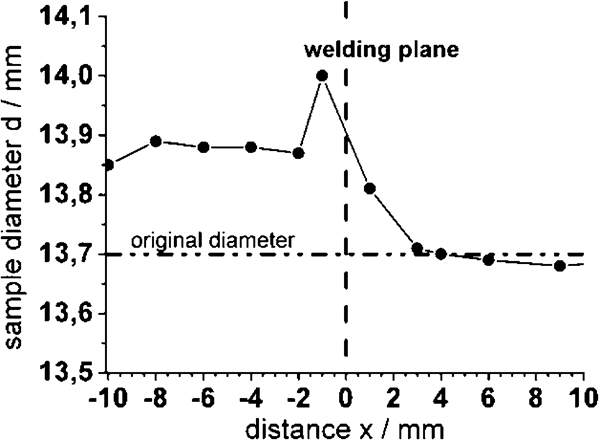
Diameter of FW sample after exposure in marine climate over 2 years: thickness measurements were carried out with micrometre caliper
Figure 2 shows the results of chronoamperometric measurements carried out with a microcapillary cell on various sites (Fig. 2b–f) of the oxide covered surface across the welding plane. The respective positions of the micro capillary are shown in Fig. 2a. It has to be stressed that the diameter of the capillary was smaller than the diameter of the displayed circles. The Arabian numerals allow the allocation of diagrams shown in Fig. 2b–f. For a clearer understanding, only selected curves are shown.
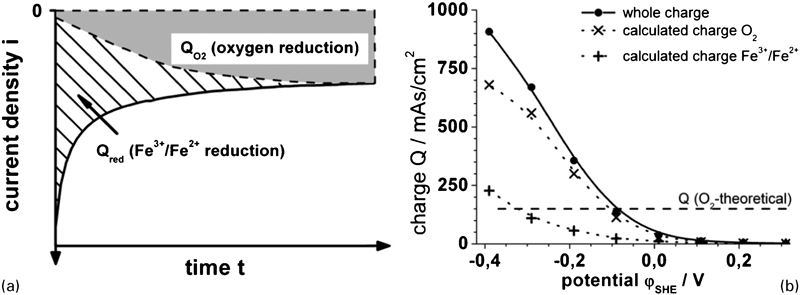
Figure 2b shows polarisation curves on the AlMgSi0·5 side. The current density is very low and in steady state slightly negative. The modulus of the current density is in the order of <0·05 μA cm−2. The current density at the chosen potentials is caused by oxygen reduction according to equation (1)

 is the diffusion coefficient of oxygen (≈10−5 cm2 s−1), δ is the thickness of the Nernst layer (10−2 cm⩾δ⩾10−3 cm) and
  (0·2×10−6 mol cm
−
3) is the concentration of dissolved oxygen. Consequently, the expected current density amounts in the order of −0·5 mA cm−2. Indeed, Kaesche reports a value of ∼0·3 μA cm−2 in the sodium chloride solution and explains this fact with the isolation of the aluminium surface by the oxide layer.30 In the present work, the measured current density is about one order lower in comparison to Kaesche. This can easily be explained by the used chloride free electrolyte. The aluminium oxide film is very protective under this condition, and the cathodic active area is very small. Furthermore, our result is in good agreement to the investigation of Kaesche performed in sodium sulphate solution.30
(0·2×10−6 mol cm
−
3) is the concentration of dissolved oxygen. Consequently, the expected current density amounts in the order of −0·5 mA cm−2. Indeed, Kaesche reports a value of ∼0·3 μA cm−2 in the sodium chloride solution and explains this fact with the isolation of the aluminium surface by the oxide layer.30 In the present work, the measured current density is about one order lower in comparison to Kaesche. This can easily be explained by the used chloride free electrolyte. The aluminium oxide film is very protective under this condition, and the cathodic active area is very small. Furthermore, our result is in good agreement to the investigation of Kaesche performed in sodium sulphate solution.30
The current densities measured on the steel side are several orders of magnitude higher in comparison with the current density measured on the aluminium side (Fig. 2c–f). Additionally, the current response varies significantly from site to site (Fig. 2c–f). Figure 2c shows the current time transients measured in site no. 2. Site no. 2 represents a special case because it is located very close to the welding plane. At this location, the properties and behaviour of the corrosion product layer are most affected by the interaction of the bimetallic contact of aluminium and steel. On this site, the steady state current density is the highest of all the investigated sites. This is an attribute for the good electronic conductivity of the oxide layer. This might be caused by the formation of Fe–Al(Mg) mixed oxide or Mg2+ doped iron oxides. First of all, we assume that the steady state current density is determined by the oxygen reduction also in this case. However, the value of the current density exceeds the calculated diffusion limited current density of the oxygen reduction (equations (1) and (2)) significantly. This means that the real interface oxide/electrolyte has to be significantly higher than the geometric surface. The other investigated sites on the steel side are relatively far from the welding plane and hardly influenced by the bimetallic corrosion. Nevertheless, the electrochemical behaviour varies distinctly from site to site. The current transients measured on site nos. 3 and 5 show only very slight slopes and steady state current densities of <−1 mA cm−2. The rust scale on site no. 4 (Fig. 2e) shows a higher electrochemical activity. The steady state current density is up to −2 mA cm−2. Moreover, in contrast to the measurements on site nos. 3 and 5, the current responses show distinctive transients, depending on the polarisation potentials.
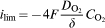
According to Stratmann and co-workers, 6 9 6,9,11 the reduction current density in the chosen potential range can be a sum of current densities of the oxygen reduction and the rust reduction (see Fig. 5a). As shown in Fig. 5a, the steady state current density is determined by the oxygen reduction. The transient range is caused by the reduction of the γ-FeOOH. The reduction process can be distinguished by two steps9:
a scheme of superposition of partial current densities generated by oxygen reduction and rust reduction and b charge density calculated from potentiostatic measurements on site no. 4 shown in Fig. 2e
below φ≈0 V(SHE), the partial reduction of Fe3+ states to Fe2+ states take place within the crystallographic lattice of γ-FeOOH, resulting in a doped n type semiconductor
at about φ≈−0·4 V(SHE), the γ-FeOOH phase of the rust scale can be transformed into Fe3O4 (see inter alia11,13). Fe3O4 is a very good electron conductor.
The oxygen reduction can only take place on the reduced phases. The rate of oxygen reduction strongly depends on the electronic properties of these oxides.31,32 If the electron conductivity is high enough (e.g. for Fe3O4), the oxygen reduction is only limited by the diffusion of oxygen into the porous rust scale to the reduced iron oxide sites.
Figure 5b shows the charge density Q calculated from the current responses shown in Fig. 2e, schematically described in Fig. 6a and according to equation (3)
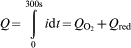
 and Q red is non-stationary not exactly to calculate from our experiments. Therefore, for a rough approximation, we interpolate the steady state current densities in Fig. 2e to the start time (t = 0) and calculated
  .
.

Morphology investigation of corrosion product layer on FW sample after weathering in marine climate
If we assume that the geometric sample surface is equal to the real interface electron conductive oxide/electrolyte, the broken line in Fig. 5b represents the theoretical charge density of oxygen reduction under diffusion limitation according to the chosen experimental conditions (Fig. 2). Actually, the course of the whole charge density differs completely from the theoretical diffusion limited oxygen reduction charge. Between φ≈0·3 and 0 V(SHE), the whole charge is very small and identical with the oxygen reduction charge density. In this potential range, the kinetic of the oxygen reduction is determined by the charge transfer on a low electron conductive interface.
Between φ≈0 and −0·3 V(SHE), the charge density increases because the reduction of γ-FeOOH occurs according step (i). Depending on the rust scale thickness, the morphology and the part of the reduced iron oxide within the oxide scale, the cathodic active area can be extremely enlarged.9 As reported in the literature,9 the current density of the rust reduction during potentiostatic polarisation at −0·3 V(SHE) is in the order of 10−1 to 10−2 mA cm−2 after ∼100 s. In our case, the current density is ∼2 mA cm−2, which is clearly higher then reported in Ref. 9. However, in the cited literature, the rust scale thickness amounts to 70 μm. In the present work, the oxide scale thickness on the steel side is estimated to be 150 μm. Close to the welding plane, it amounts to ∼300 μm (see also Fig. 4). This might explain the higher current density of some micro amps per square centimeter.
At φ≈−0·4 V(SHE), Q red is the highest, and we assume the reduction of γ-FeOOH according step (ii). As aforementioned, the magnetite phase is a good electron conductor, and the oxygen reduction kinetic is now diffusion controlled.
Oxide layer morphology
As expected, due to the visible inspection of the surface, the morphology varies along the longitudinal axis of the sample. In Fig. 6a, the white rectangular frames marked with Roman numerals represent areas investigated by SEM. Obviously, the oxide layer on the AlMgSi0·5 side is very thin, as already concluded from Fig. 4. Partly the surface exhibits tracks of mechanical machining before weathering. On sites of AlMgSi0·5, which are covered by a thicker oxide film (e.g. area no. I), this oxide film is very compact and barely structured, as shown in Fig. 6b. It can be assumed that the oxide is amorphous. The oxide film is partially characterised by a network of flaws and fissures. They are caused by the drying process either during the drying periods of weathering or after the exposition. In any case, the impression suggests good corrosion protection of this oxide film. This confirms the electrochemical results discussed in the section on ‘Electrochemical measurements’.
Figure 6c shows the morphology of the oxide layer on C35 close to the welding plane (area no. II). The oxide layer is crossed by a network of crevices and big fissures. In the upper section of the image, a corrosion pit is visible. As already shown, the oxide layer on this site is highly reactive, and the oxide layer thickness amounts the highest value.
Figure 6d–f shows the oxide morphologies on the C35 side. The oxide in area no. III shows a cauliflower-like morphology. The oxide seems to be very dense, and only a small number of fissures are visible. A higher magnification (in the right upper corner of Fig. 6d) shows that the fissures are not very deep, and the layer consists of very fine oxide crystals.
The morphologies depicted in Fig. 6e and f (area nos. IV and V) are just slightly different. The oxide scale is crossed by a network of crevices and shows platelets that are partly broken up. A highly magnified section of the area shows that the crevices are deep trenches and the fine crystalline oxide seems to be slightly porous.
Such stronger disturbed oxide morphology could explain the higher activity that was measured on site no. 4. It can be summarised that solely the morphology of the rust scale cannot explain the various electrochemical activities on the different sites. Nevertheless, the morphology is an additional indicator to evaluate the corrosion activity of oxide scales.
Raman and EDX spectroscopy of oxide layer
Material analysis complements the electrochemical and microscopic investigations of the weathered FW sample for deeper understanding of the corrosion process. Raman spectroscopy is an established method to investigate aluminium oxide and iron oxide films (see e.g. Refs. 33 and 34). Dünnwald and Otto34 investigated the phase transition in artificial rust layers by Raman spectroscopy 25 years ago. In the present work, the authors want to identify the oxide scale composition in relation to the electrochemical investigation on various sites of the FW sample.
The investigated spots are not exactly the same as for the electrochemical measurements. Therefore, the spectra shown in Fig. 7 are arranged according to the distance to the welding plane (see Fig. 3). On the aluminium side (x = +8 mm), the spectra do not show any significant band. This is in good agreement to the expectation of an amorphous Al2O3.3H2O. According to Graedel,35 the aluminium oxide can be partly substituted by chloro-aluminates, e.g. Al(OH)3−xClx, depending on the pollution in the marine climate. The presence of chlorides is not only plausible owing to the weathering in marine climates but also evidenced by the existence of pits, as shown in Fig. 6a and c. Additionally, aluminium sulphate or carbonate hydrates cannot be excluded but should play a minor role.
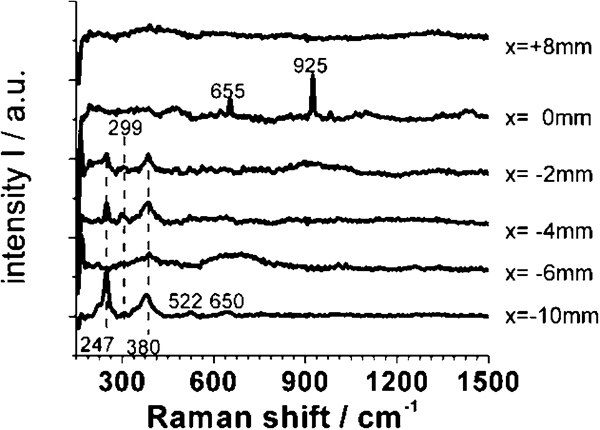
Raman spectra recorded on different sites on FW sample: distance x is given related to welding plane
The Raman spectra recorded close to the welding plane (x = 0 mm) could not be explained reasonably. According to the EDX spectra shown in Fig. 8, we have to expect an aluminium rich oxide probably doped with iron and a significant content of chloride. Indeed, we found two sharp bands at 655 and 925 cm−1, but it was not possible to assign them to any crystalline phase with such an element composition. Unfortunately, we could not find reference spectra in the literature, and hence, a clear identification is impossible. Nevertheless, it is surprising that the aluminium rich oxide covers the steel side of the sample up to a distance of a few millimetres (Fig. 8). This can be explained only by sacrifice of the AlMgSi0·5 close to the welding plane due to bimetallic corrosion. The gel-like Al2O3⋅3H2O is voluminous and overlaid the RZ and MHAZ of the FW.
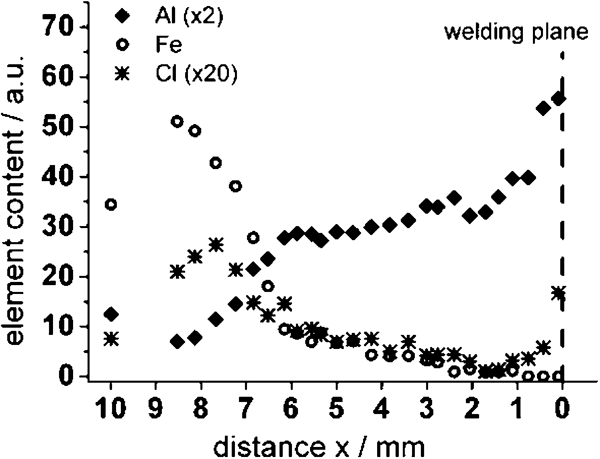
Energy dispersive X-ray spectra measured on steel side of FW sample along line perpendicular to welding plane
The Raman spectra recorded on the steel side of the FW sample (x = −2 to −10 mm) represent the rust scale. Two crystalline phases are clearly identified. According to Table 1, we identified α-FeOOH and γ-FeOOH. Although a quantitative evaluation of the spectra is not possible, several conclusions can be drawn:
the crystallinity of the rust scale on the steel side seems to vary from site to site
the various intensities of the Raman bands suggest that the relation between γ-FeOOH (lepidocrocite) and α-FeOOH (goethite) is neither constant nor strongly dependent on the distance from the welding plane
surprisingly, akageneite (β-FeOOH) was not identified in any of the spectra. As mentioned in the section on ‘Introduction’ the appearance of akageneite is associated to a significant concentration of chloride. However, though we measured a significant chloride ion concentration within the rust scale as shown by EDX measurement (Fig. 8), the concentration of chloride ions varies locally. It might be possible that akageneite only exists in some areas on the sample
moreover, magnetite or maghemite was not detected in the rust scale by Raman spectroscopy carried out on the sample in dry and fully oxidised state.
Even more interesting are in situ Raman spectroscopy measurements during the polarisation of the rust scale on the C35 side in acetate buffer. Figure 9 shows the Raman spectra recorded on the steel side of the FW during potentiostatic polarisation at various potentials. The development of the relative intensity of typical Raman bands for γ-FeOOH (250 and 378 cm−1) and Fe3O4 (224, 296 and 418 cm−1) is shown in Fig. 9. It is noticeable that the relative intensity of the Raman bands of lepidocrocite continuously decreases over time and is clearer, depending on the polarisation potential in the range between 0·1 and −0·3 V(SHE). This can be explained with a partial reduction of Fe3+ to Fe2+ ions within the crystal lattice of γ-FeOOH, which is associated with an increasing electron conductivity of the phase. The intensity of Raman bands depends on the penetration depth δ of the laser beam, which again is inversely proportional to the electron conductivity σ of the material according to equation (4)36

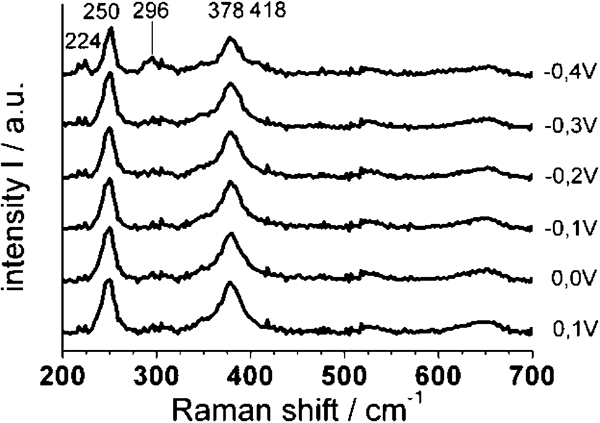
Raman spectra recorded on steel side on FW sample in situ during potentiostatic polarisation in sodium acetate buffer solution at various potentials
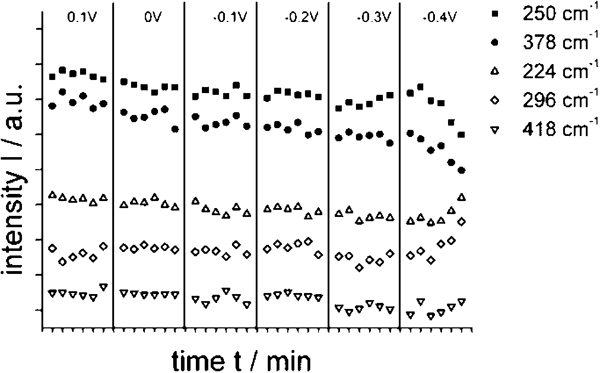
Relative intensity of chosen Raman bands of γ-FeOOH (full marks) and Fe3O4 (open marks): polarisation time amounts to 12 min
Summary
The corrosion products formed during two years of weathering under marine atmosphere (Helgoland) were investigated by local electrochemical methods and localised material analytics. Initially, we have found different types of corrosion dependent on the local conditions on the sample.
The bimetallic corrosion preferentially affects the RZ and the MHAZ close to the welding plane. In this range, the aluminium alloy is stronger dissolved, and the aluminium based oxides overlay the RZ and MHAZ on both sides of the welding plane. The C35 is cathodically protected. However, the cathodic protection has only a small range of influence. The high corrosion rate close to the RZ and MHAZ labels this range as predetermined breaking point, and therefore, it should be carefully monitored
The aluminium oxide on AlMgSi0·5 is quite stable with high corrosion protection. Only the specific attack of chloride ions leads to pitting corrosion, preferred immediately behind the RZ and MHAZ of the FW.
On the parent materials far from the welding plane, the intrinsic corrosion of C35 is stronger than of AlMgSi0·5. This is already shown by the oxide film thickness.
The rust composition of the C35 side is very heterogeneous. It varies between amorphous iron oxide hydrates and highly crystalline ranges that consist of lepidocrocite and goethite in different ratios. Despite the significant chloride concentration in parts of the rust scale, no akageneite was found.
The electrochemical activity of the rust scale is strongly related to the phase composition. The high active areas are:
The rust close to the welding plane, which probably consists of mixed oxide of Al, Mg and Fe
The γ-FeOOH rich parts of the rust scale, which can be easily reduced by cathodic polarisation and allows the oxygen reduction process.
The schematic drawing shown in Fig. 11 summarised our idea of the oxide layer on the AlMgSi0·5–C35 FW.
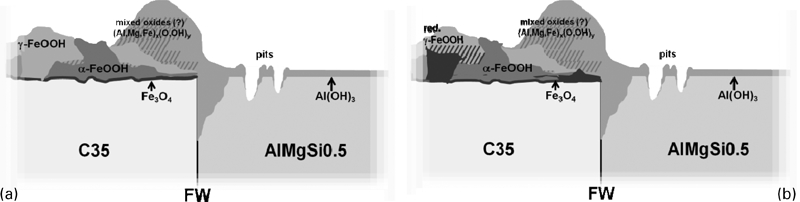
Schematic drawing of oxide layer on AlMgSi0·5–C35 FW