
Abstract
Graphite, stainless steel and brass were selected as electrode materials in the chloride migration test. The diffusion coefficients were calculated from the steady state of chloride flux by the Nernst–Planck equation. X-ray diffraction was used to characterise the corrosion products in the chloride migration tests. The results show that the types of electrodes have significant effects on the diffusion coefficient calculated from the migration test. The diffusion coefficient may trend closely to the real value when graphite electrodes are used. Graphite is a suitable electrode material used in the chloride migration test.
Introduction
Corrosion of reinforcing steel in concrete continues to be a serious problem worldwide. Chloride ions may penetrate concrete cover and induce the corrosion of reinforcing steel in concrete, which is of great concern to the durability and service life of reinforced concrete structure.1 – 4 Several steady state migration tests are developed to accelerate chloride ions through concrete because the natural diffusion experiments are time consuming.5 – 8 Caré9 examined the influence of aggregates on the chloride diffusion coefficient of mortar. He found that the diffusion coefficient varied with the volume content of the interfacial transition zone. McGrath and Hooton10 calculated the apparent and effective diffusion coefficients from the chloride breakthrough time and the steady state chloride flux at each potential. The diffusion coefficients were reasonably constant over the voltage range tested for the non-steady state migration case but increased with the increase in voltage for the steady state case. Chindaprasirt et al.11 reported that the carbonation significantly decreased the chloride penetration resistance of mortar containing pozzolans. This decrease was related to the replacement level of pozzolans. Hisada et al.12 examined the effect of fly ash, silica fume and ground granulated blast furnace slag on the chloride migration properties through the mortar.
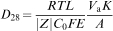
During the migration tests, the steady state of the chloride concentrations in the downstream cell can be used to calculate the diffusion coefficient. The Nernst–Planck equation (see equation (1)) is the most common technique to determine the diffusion coefficients in the migration tests5,7,8,10,13
The Nernst–Planck equation can describe the transport properties of chloride ions according to the following assumptions for the steady state:14
the activity coefficients do not change with ionic strength because its effect on the concentration profiles is negligible15
the material is a saturated and homogeneous substance. Therefore, the convection and the electrical double layer are not considered
the electroneutrality in the sample and compartments of the migration cell is assumed valid according to Newman and Thomas-Alyea16
the movement of ions is only affected by the voltage differences because the migration is dominant in the chloride migration test.
However, it has been reported that these experimental procedures usually differ from the cell geometry, the electrical voltage applied and the types of electrolytes in the solutions.6,10,17,18 The electrodes used in the migration tests are different. ASTM C1202-1019 and the accelerated chloride migration test20,21 called for brass electrodes. Tang and Nilsson6 and McGrath and Hooton10 used stainless steel electrodes in the chloride migration test. Prince and Gagn17 selected graphite electrodes to reduce the risk of oxidation and corrosion. However, different electrode materials will affect the diffusion coefficients calculated from the migration test, and there is little information about this. The aim of this work is to study the effect of graphite, stainless steel and brass on the diffusion coefficients.
Materials and methods
Materials and specimens
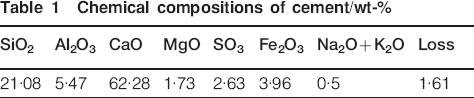
Graphite, stainless steel and brass were selected as electrode materials respectively. Ordinary Portland cement (CEM II 42·5) with a density of 3170 kg m−3 and a specific area surface of 335 m2 kg−1 was used in the test. Table 1 shows the chemical compositions of cement.
Chemical compositions of cement/wt-%
Cement specimens (Φ95×3 mm) with a water/binder ratio of 0·35 were prepared. The thickness of the cement specimen was 3 mm, which ensured the collection of usable data within a reasonable period. After demoulding (24 h after mixing), the specimens were cured at 20±2°C and in an alkaline solution until 28 days. The alkaline solution saturated the specimens and avoided leaching.14 In this paper, three cement disks for each electrode material were used to determine the diffusion coefficients, and the mean values were reported. The lateral surface of specimens was covered with epoxy resin to ensure unidirectional transfer.
Migration test equipment
Figure 1 shows the equipment of the chloride migration test. The upstream chamber contains 1·5 L solution of 0·5 mol L−1 NaCl and 0·3 mol L−1 NaOH. The upstream chamber is large enough to prevent the build-up of hydroxyl ions and the depletion of chloride ions. The experiment creates a near constant concentration of migrating anions at concentrations somewhat representative of real cement pore solution. The downstream chamber contains 0·6 L solution of 0·3 mol L−1 NaOH dissolved with distilled water. The alkaline solution is to prevent chlorine gas occurrence because of the decrease of pH.12 The small volume of the downstream chamber is to allow early detection of chloride breakthrough from the specimen but still large enough to avoid significant electrolyte concentration changes. A 12 V voltage is controlled between two sides of the specimen during testing, which does not change solutions to be high temperature.10 A PClS-10 chlorine meter with a measuring range of 5·0×10−5∼1·0 mol L−1 is used to measure the chloride concentration.
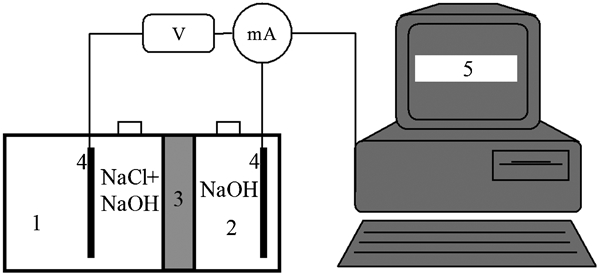
Equipment of chloride migration test: (1) upstream chamber, (2) downstream chamber, (3) specimen, (4) electrode and (5) pick devices
Results
Chloride migration test
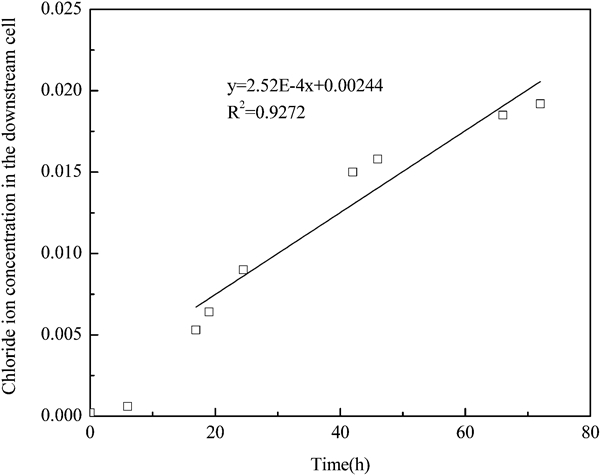
Figures 2 4 show the results of the chloride migration test. The concentration of chloride migrated through concrete shows an approximate linear relationship and increases with the testing time after a different stage. The linear relationship between the chloride ion concentrations in the downstream and the test time can be described as a fitting equation.
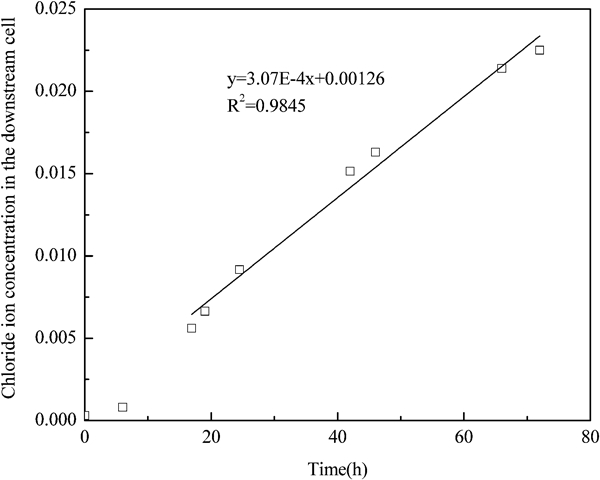
Chloride migration test for graphite electrodes
Chloride migration test for stainless steel electrodes
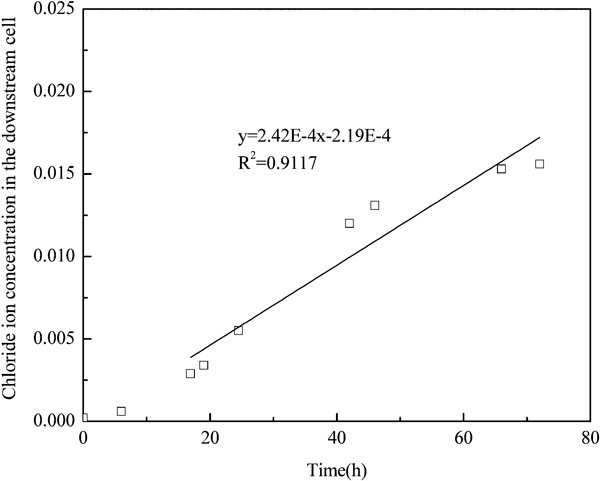
Chloride migration test for brass electrodes
Calculated diffusion coefficients
The information of chloride concentration at steady state can be used to calculate the diffusion coefficients. The steady state migration coefficients (D 28) for all specimens are calculated by equation (1). In this work, V a is 6·0×10−4 m3. A is 6·36×10−3 m2. Z is −1. F is 96 500 C mol−1. E is 12 V. R is 8·31 J mol−1 K−1. T is 293 K. C 0 is 0·5 mol L−1. L is 3·0×10−3 m. K is 3·07×10−4, 2·52×10−4 and 2·42×10−4 for graphite, stainless steel and brass electrodes respectively. Table 2 summarises these results for three electrodes used in this work.
Diffusion coefficients calculated from migration test

Table 2 indicates that the electrode materials have significant effects on the diffusion coefficients. The diffusion coefficient of the specimen is greatest when the graphite electrodes are used in the chloride migration test. The diffusion coefficients are close when stainless steel and brass electrodes are used.
Discussion
Surface changes of electrodes
Figure 5 shows the surface changes of electrodes after the chloride migration test. It can be seen that many corrosion pits are observed on the surfaces of the brass and stainless steel electrodes. However, there is no significant change on the graphite electrode. The corrosion products of the brass electrode and the stainless steel electrode are blue green and dark brown respectively.
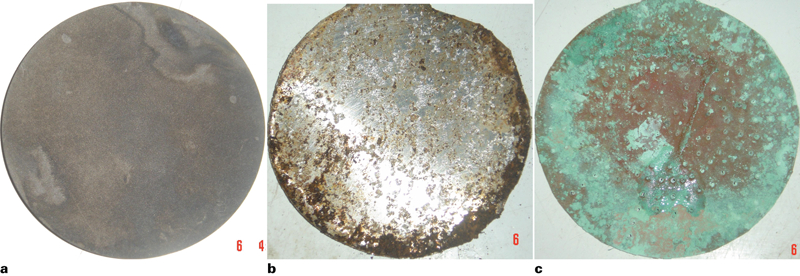
Surface changes of electrodes
Corrosion products of electrodes
X-ray diffraction (XRD) was performed to ensure the compositions of the corrosion products. Figure 6 shows the X-ray diffractograms for the corrosion products.
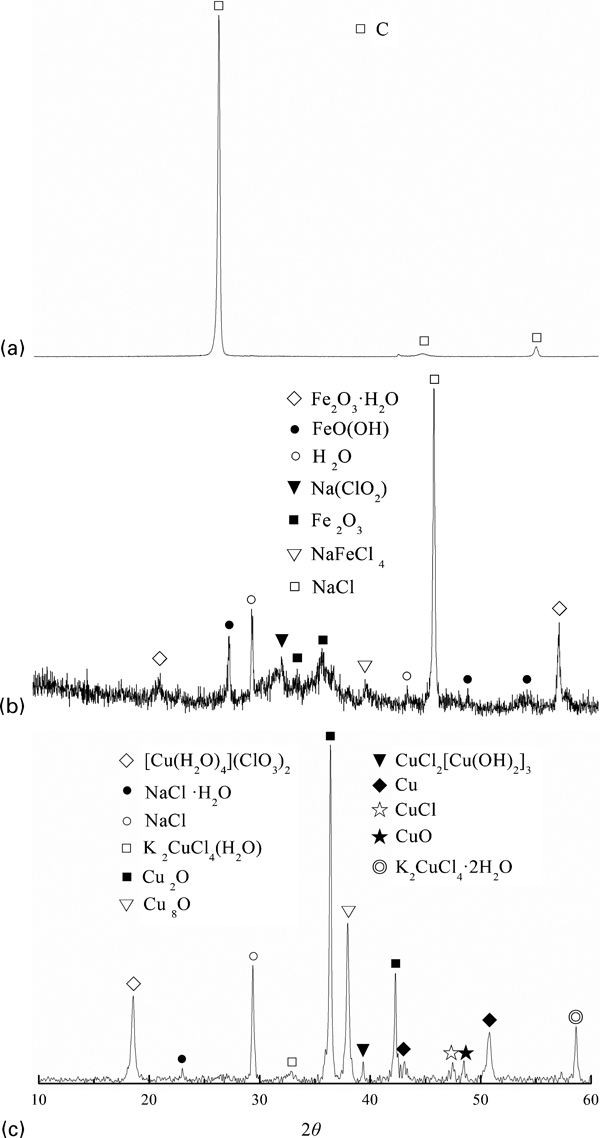
X-ray diffraction patterns for a graphite electrode, b stainless steel electrode and c brass electrode
Figure 6a shows the XRD pattern for the surface material of the graphite electrode. The surface material is graphite, and no corrosion product is found. The main reaction may be the electrolysis of water,2,22 as shown in reaction (2)


Figure 6c shows the XRD pattern for the surface material of the brass electrodes; the main compositions of the corrosion products are Cu2O, Cu8O and CuO. The following reactions may take place according to the final corrosion products of the copper electrode in this work, as expressed by reactions (7)–(9)
24
24,25


Sodium chloride and double chloride salts are found in the corrosion products of brass and stainless steel electrodes. It indicates that the corrosion products absorb partial chloride in the downstream solution. The corrosion products are dried to a constant weight at 40°C and dissolved in 100 mL 1∶1 HNO3 solution. The chloride concentration in HNO3 solution is measured by the PClS-10 chlorine meter. The contents of chloride in the corrosion products are 0·3915 and 0·4266 mg g−1 for the brass and stainless steel electrodes respectively. The diffusion coefficients of the specimens decrease when the stainless steel or brass electrodes replace the graphite electrodes. Because the chloride ions absorbed by the corrosion products cannot be measured by the PClS-10 chlorine meter.
Conclusions
Based on the experimental study, the following conclusions are drawn:
The types of electrodes have significant effects on the diffusion coefficient calculated by the Nernst–Planck equation. The brass and stainless steel electrodes are greatly corroded during the chloride migration test. Some free chlorides are absorbed by the corrosion products, which decreases the diffusion coefficients.
The diffusion coefficient calculated by the Nernst–Planck equation trends closely to the real value when graphite electrodes are used. Graphite is a suitable electrode material used in the chloride migration test.
Footnotes
Acknowledgements
This research was supported by the National Natural Science Foundation of China (grant no. 50808045), the Beijing Natural Science Foundation (grant no. 2112024), the Fundamental Research Funds for the Central Universities (grant no. YWF-11-03-Q-057) and an open foundation of state key laboratory of coastal and offshore engineering, Dalian University of Technology (grant no. LP1013).