
Abstract
Recently, it has become evident that additional industry action is warranted regarding the performance of buried piping systems within nuclear installations. One of the challenges of this application is to achieve large coverage while keeping the costs at a reasonable level. This can be achieved using guided wave (GW) monitoring. Guided wave testing has been successfully used in the petrochemical industry and has recently been applied to piping in nuclear systems for the monitoring of buried components. In this article, the capabilities and limitations of GW monitoring are highlighted, and some examples of GW monitoring are discussed.
Introduction
The increased safety and maintenance requirements for nuclear installations have focused awareness of the current capabilities for non-destructive testing (NDT) and inspired a number of research programmes with the goal of enhancing the performance of existing NDT tools and methods. Concurrently, health and safety organizations worldwide have concentrated their effort into evaluating the cost/benefit of two different types of inspection approach, namely, risk based inspection 1 and direct assessment. 2 Both approaches utilise several inspection methods [including guided waves (GWs)] for the final objective of verifying the fitness for purpose of the inspected component. The screening of pipes using the GW method is routinely applied in several inspection situations (for example, screening of bare pipes, road crossings and buried pipes). In many applications where the GW testing method is applied, a large percentage of the total cost of screening is due to gaining access to the test location. In these cases, an attractive option is to use gPIMS (GW permanently installed monitoring system), where only one time access is needed, and the transduction system is permanently attached to the pipe.
In monitoring mode, the transducer is permanently attached to the pipe and must be protected from degradation, for example, caused by environment and/or operational conditions. As reported in the remainder of this paper, the performance both in terms of range and sensitivity of the gPIMS is generally superior to the performance achieved using the conventional GW screening approach, where the transducer ring is clamped to the pipe only for the duration of the test.
Guided wave screening and monitoring
Guided waves propagate along a pipe and enable the coverage of a large area from a single test position (see Fig. 1).
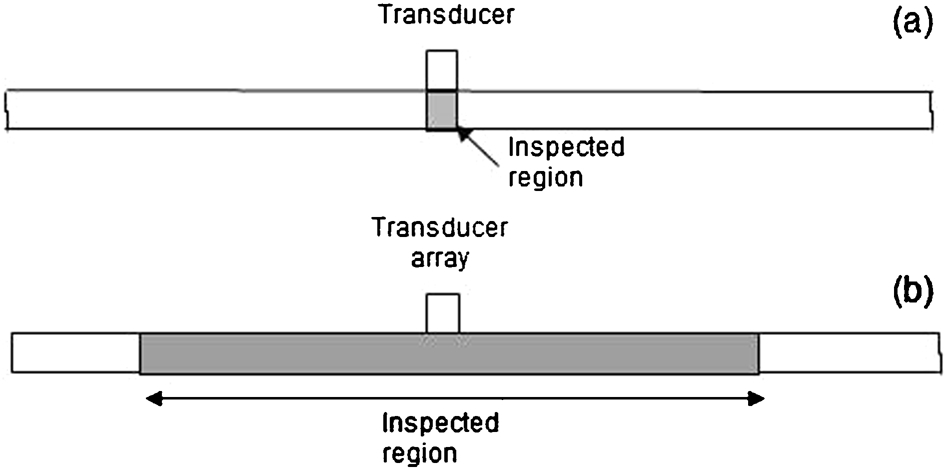
Difference between a traditional NDT methods and b GW method
The generation of these waves is obtained using a special transducer array. 3 The contact between the pipe and the transducers is dry, and a mechanically or pneumatically applied force is used to ensure efficient transfer of GW into the pipe. After the transducer ring is positioned around the pipe, the operator starts a rapid test that automatically sweeps several frequencies, simultaneously collecting data from both sides of the ring. The propagation of GW depends on the conditions of the pipe under test. A range of several tens of metres in either direction from the transducer ring position can be obtained when the pipe is in generally good condition and there is a low density of features (for example, change of directions, drains, vents, valves and welds). The range decreases when the pipe is heavily corroded or covered with attenuative coating (e.g. coal tar, PE). The Wavemaker G3 Pipe screening system 4 has been designed to detect defects that remove ∼5% of the pipe cross-sectional area, although defects well below 5% cross-sectional area can be identified in pipes with isolated defects.
Owing to the large area screened from a single inspection point, GW screening can increase the probability of detection of defects in a pipeline compared to other NDT approaches that rely on point measurements. 5 Guided wave monitoring can offer further improvement of the probability of detection due to the high sensitivity to changes when in monitoring mode. 6
GUL gPIMS transduction system
The gPIMS has been developed to utilise all of the software features available for GW screening, including the frequency animation and C scan tools. 4
Transducer
The transducer is produced as a low profile flexible array that is bonded and clamped in place on the pipe surface. The transducer is sealed in a polyurethane jacket that provides complete environmental protection. The sealed unit height is ∼10 mm over the majority of the circumference, giving a wide range of possible install locations (see Fig. 2a). Transducers have been made to fit pipes from 2 in. diameter up to 48 in., although larger sizes can be produced.
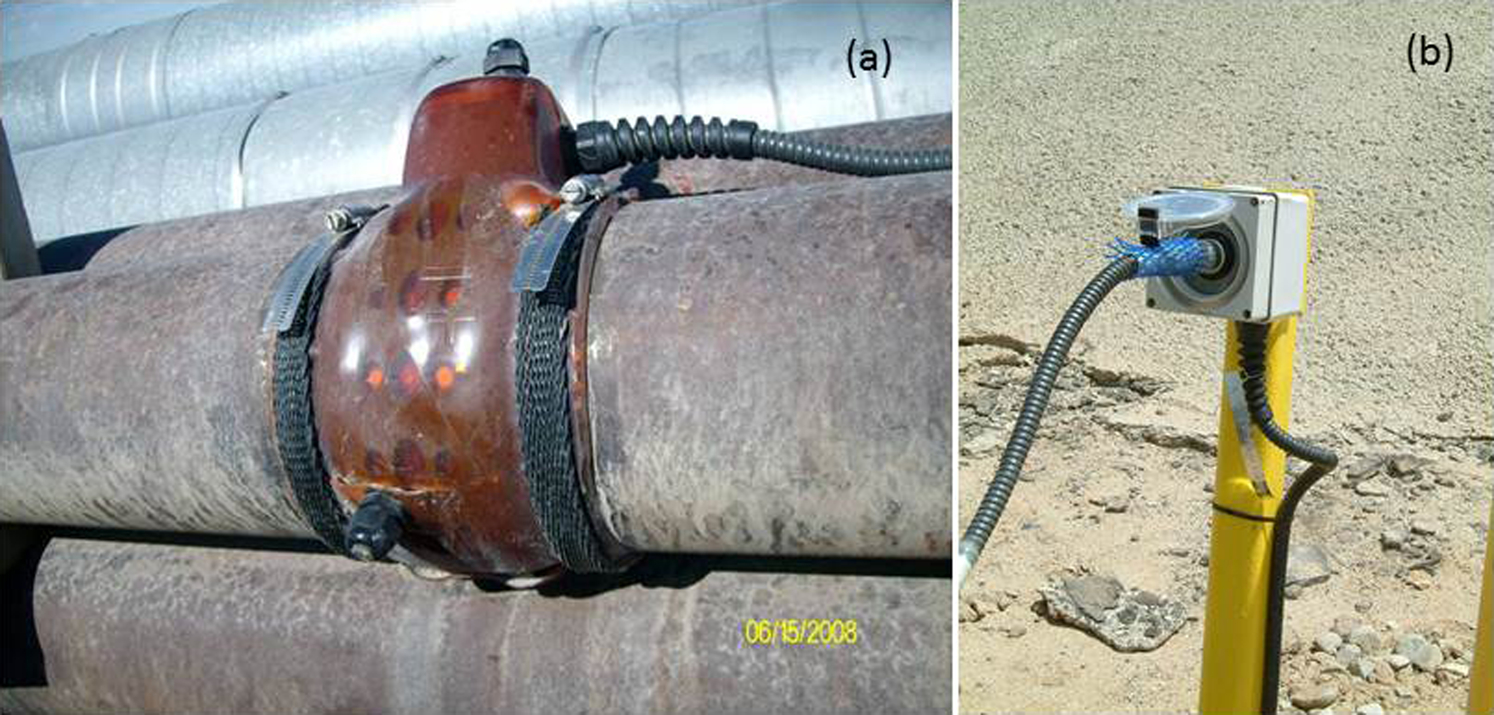
a gPIMS transducer and b connection box
Connection box
The connector is housed within a sealed weatherproof box (see Fig. 2b). This stores the test parameters such as pipe size, orientation and identification of the reference file that should be used to compare the most recent data with. This allows the software to select all of the appropriate collection parameters without the need for any operator input, which ensures that the same data set is collected regardless of the operator.
GUL gPIMS stability of results
The stability of results is a basic requirement for any monitoring technology. Stability of results can be achieved by reducing the possibility of changes in the performance of the transduction system. Figure 3 shows an example of monitoring results on a gPIMS ring exposed to weather changes. As in standard GW screening, the ‘A scan’ display has a horizontal axis that shows the distance of any reflector from the transducer and a vertical axis that shows their amplitude, on a linear scale in this case. The horizontal axis shows both negative and positive directions corresponding to the two directions of propagation along the pipe from the transducer location. The vertical green band at zero distance indicates the ‘dead zone’ at the transducer ring, within which no interpretation can be performed.
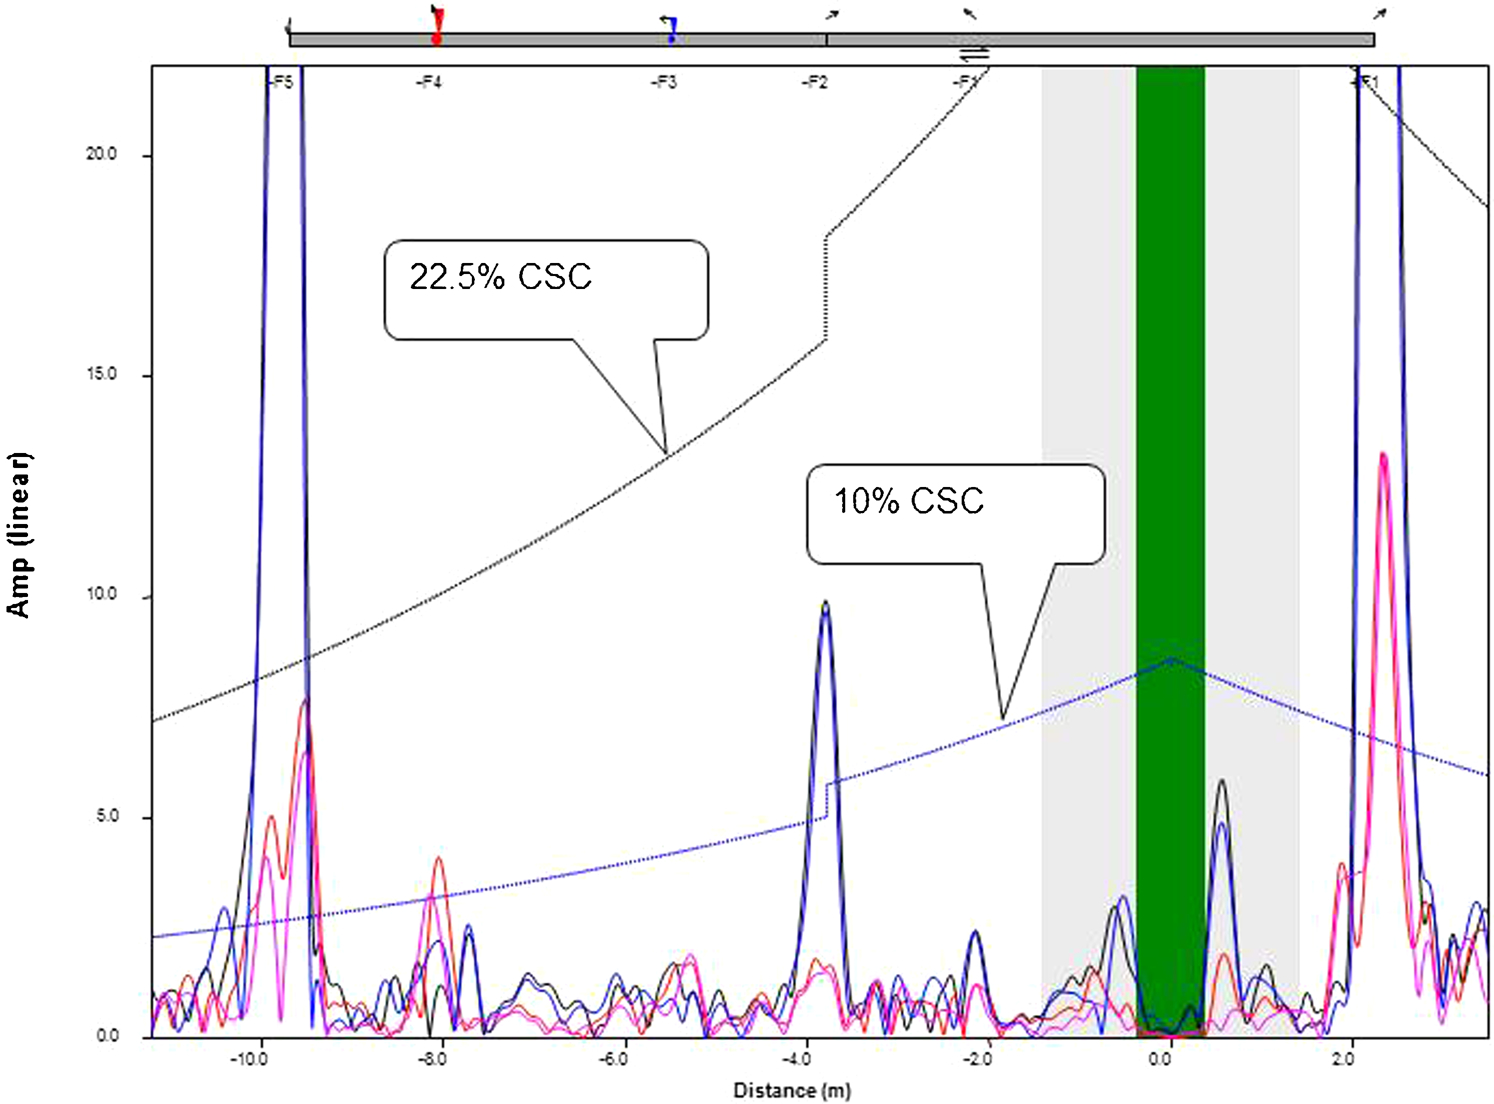
gPIMS stability of results. Black and red traces are torsional and flexural waves respectively at time zero, and blue and pink traces are torsional and flexural waves after 12 months. Black dotted line represents 22·5% cross-section change (CSC), and blue dotted line represents 10% CSC (this is valid for all other test results in this article) (Colour version available online)
The black and red traces are the torsional and flexural waves respectively at time zero, and the blue and pink traces are the torsional and flexural waves after 12 months.
In this case, the readings were made at ambient temperature, and the variations of the recorded trace with time are well below 0·5% of the CSC. This essentially demonstrates very good stability of the gPIMS performance, and assuming that the pipe had no changes (which is unlikely), the gPIMS stability is 0·5% or less. More sophisticated processing algorithms are being developed to improve the sensitivity in monitoring mode. 6
GUL gPIMS sensitivity
To demonstrate the sensitivity that can be obtained from the gPIMS, a trial was carried out on a 16 in. diameter test pipe. This had a gPIMS transducer installed towards one end of the 6 m sample, and a reference data collection was performed. After this, a defect was machined into the sample 3·5 m from the transducer. The size of the initial defect was 0·5% change in pipe cross-section. This defect was then increased in size to 0·7% and then 0·9%. The results from this trial can be seen in Fig. 4. This shows that both the initial defect and the incremental changes are clearly identifiable. The result shown has traces taken from the initial data collection and three subsequent sets of data for different defect sizes. The section of trace between 1 and 3 m shows how repeatable the gPIMS results are when there are no changes to the cross-section of the pipe.
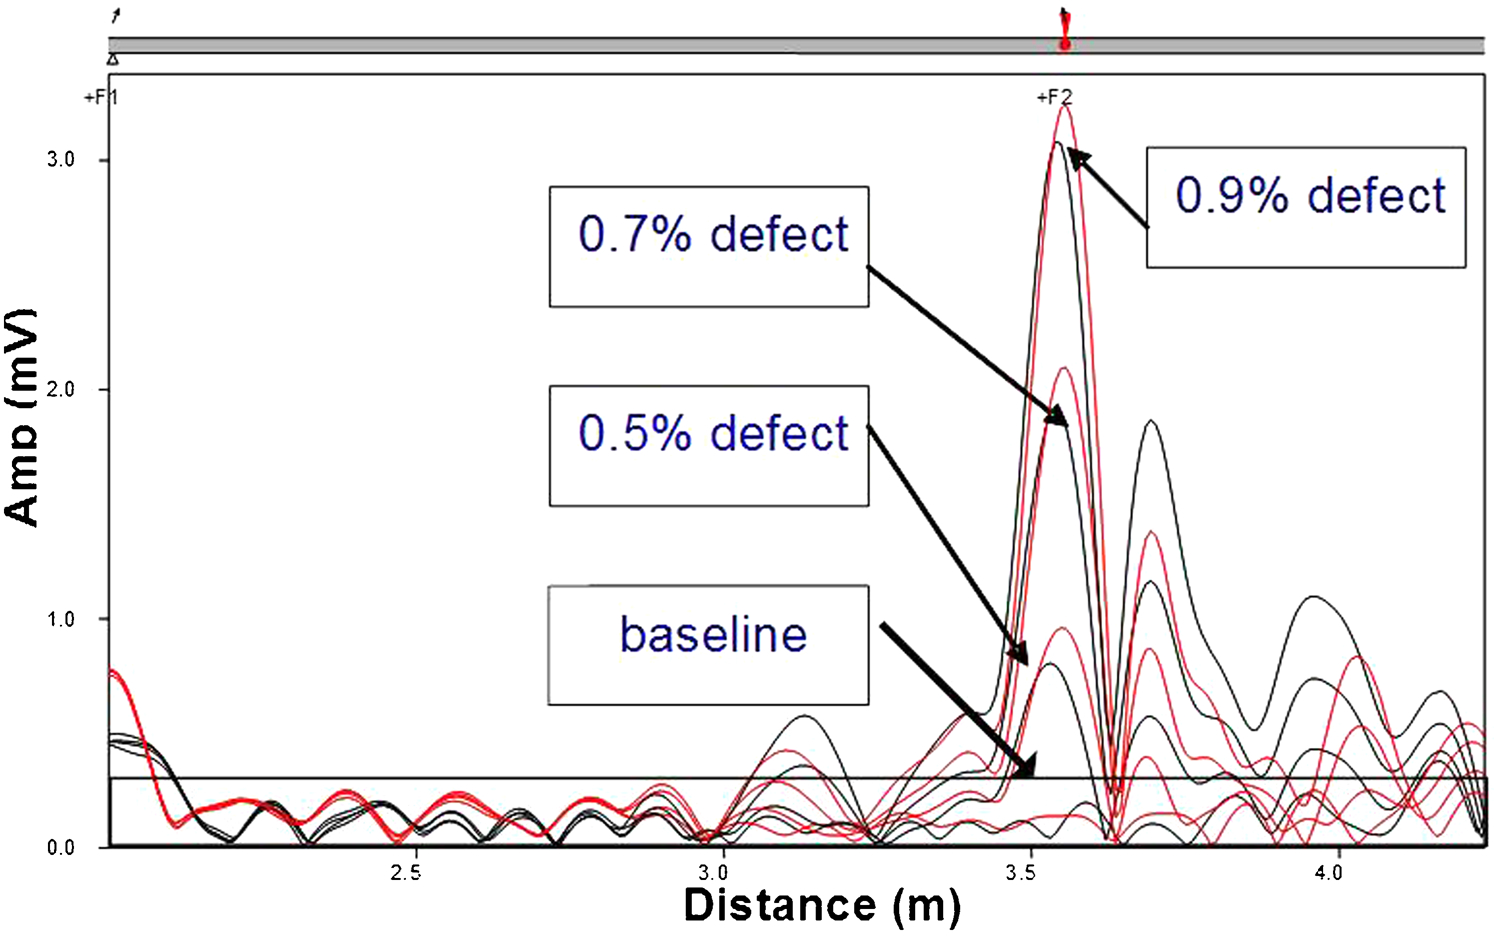
gPIMS sensitivity performance
Please note that the results are shown here for a specific frequency value, whereas a range of frequencies and bandwidths collected within a single test sequence are available to the operator comparing the data.
GUL gPIMS buried pipes case study
The monitoring of buried pipes is an excellent application for gPIMS. However, the test range in buried pipes can be dramatically reduced due to the presence of attenuative coatings and the earth surrounding the pipe. Different types of coatings and surrounding earth cause different levels of attenuation. The results of the case study are shown here as a conventional GWT result. Examples of more complex analysis tools are discussed in other publications. 6
Buried pipe 1
In this case study, a buried pipe within a tank farm (see Fig. 5) is considered. The pipe was covered with some thin tape wrap and buried in gravel. On the negative side of the test, the propagation was limited by the presence of two bends close to the ring position (labelled −F2 and −F3). On the positive side of the test, two welds are clearly visible (labelled +F2 and +F3). The test range on the positive side was again limited by the presence of two bends (labelled +F4 and +F5). The pipe did not show presence of areas of concern above 1% of the cross-section.
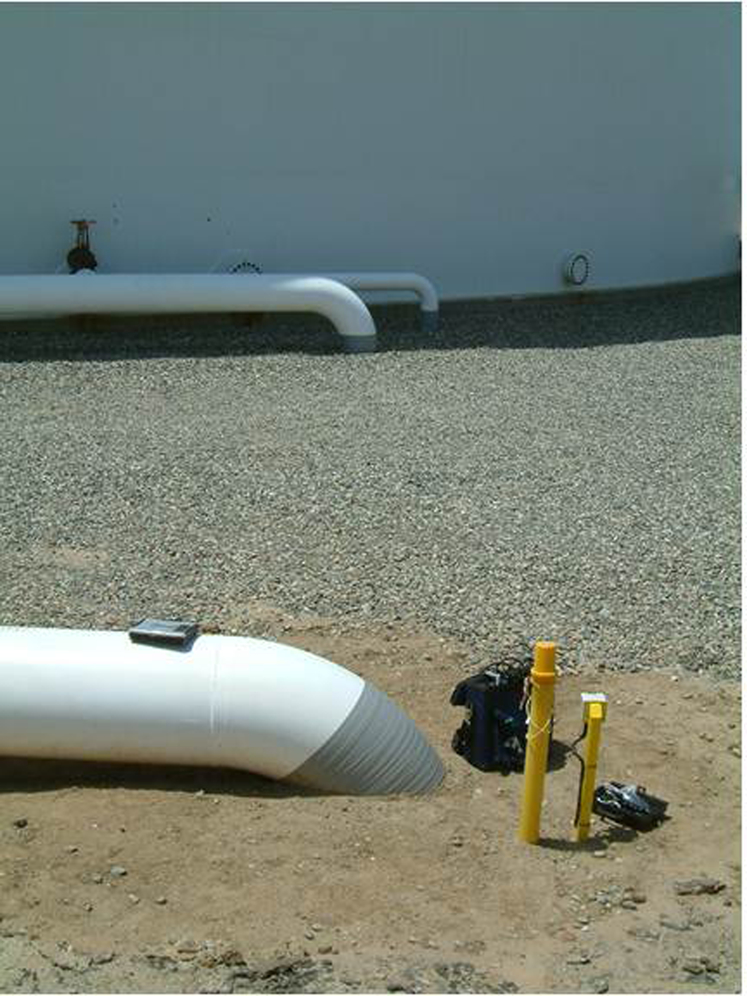
gPIMS installed on line almost directly below instrument: connection box on rightmost yellow post
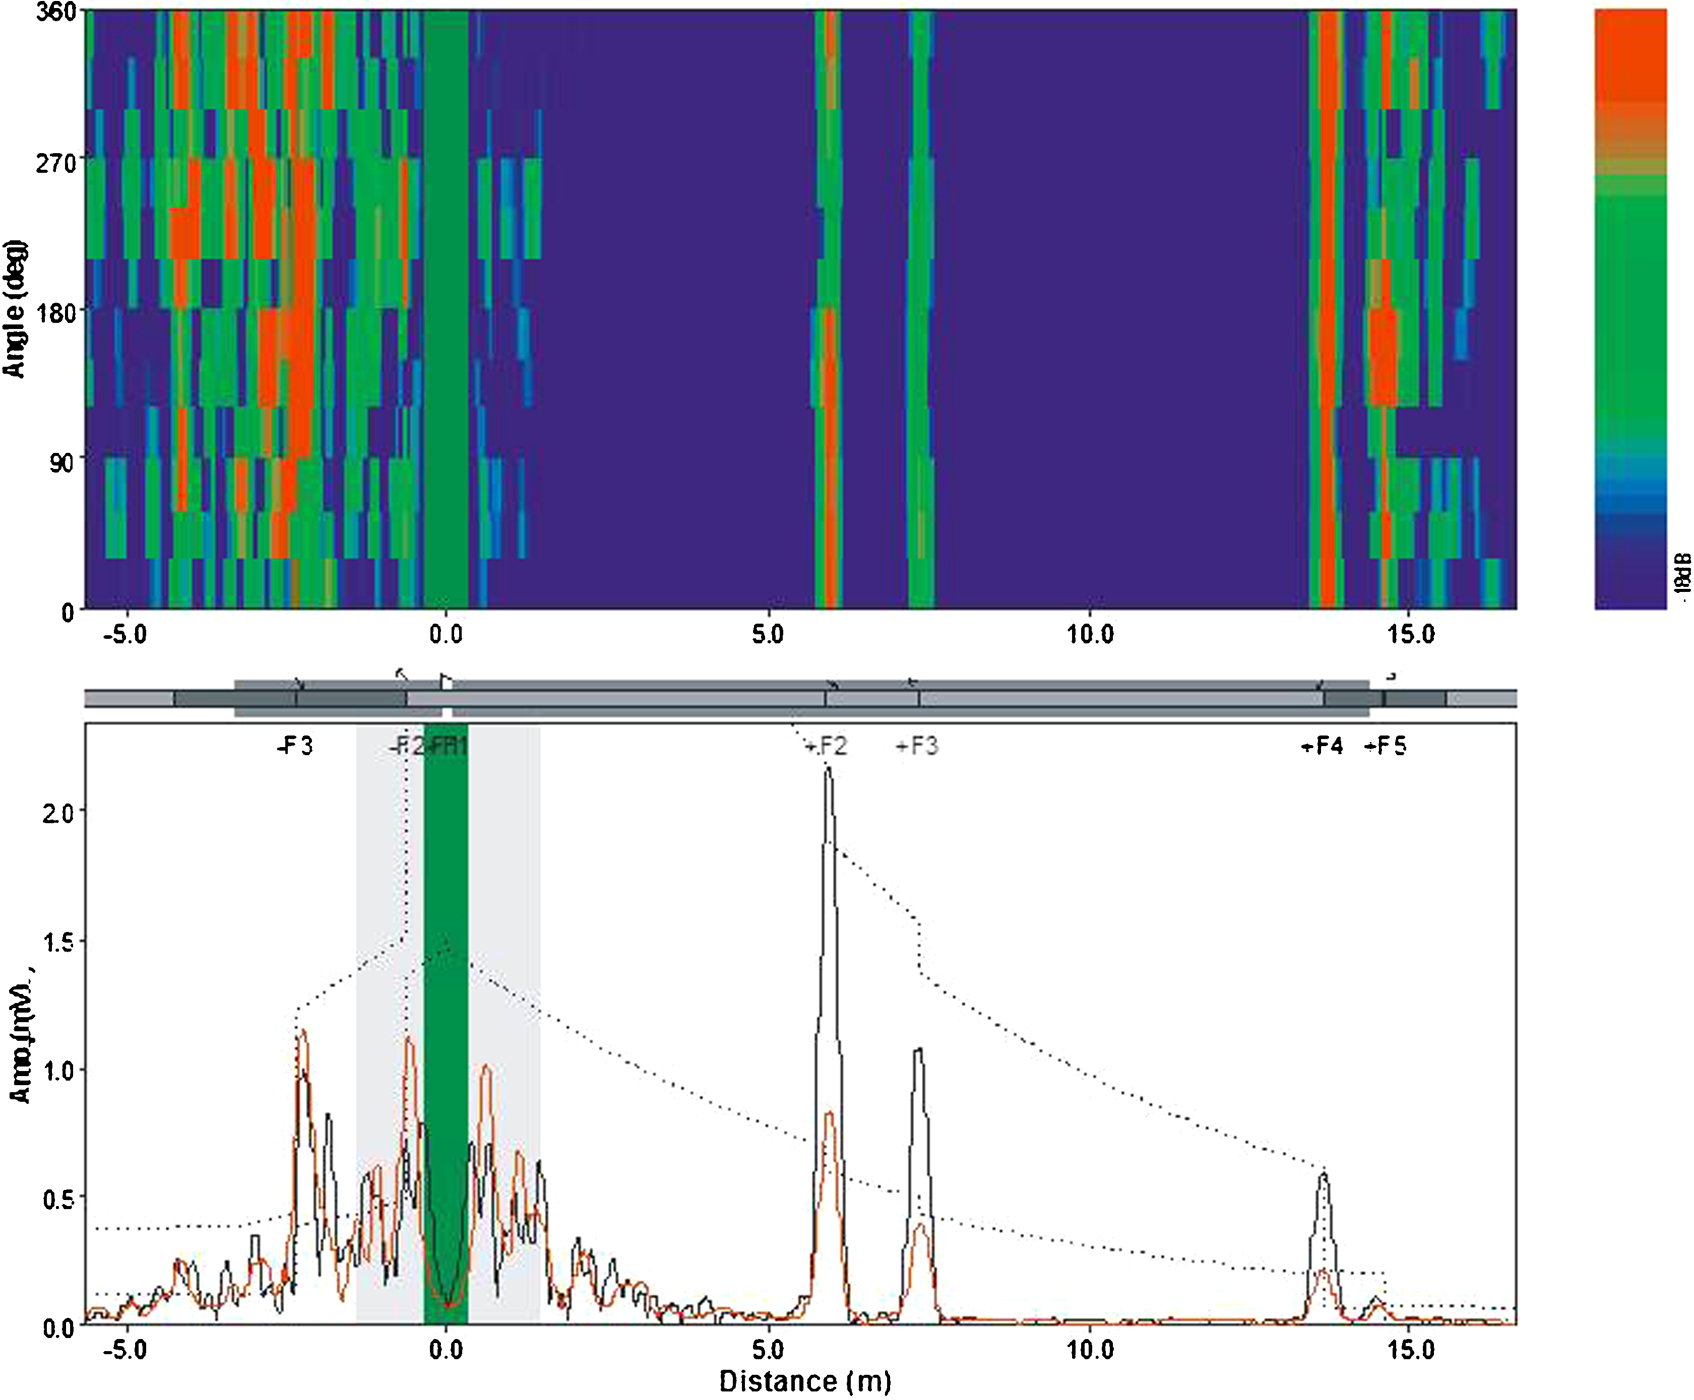
Result from installation shown in Fig. 5. The black trace is the torsional mode and the red trace is the flexural mode (in this case weld reflection show red component due to weld misalignment) (Colour version available online)
Buried pipe 2
This case study presents the results from a buried water pipe that is part of the essential service water piping system in a nuclear power plant. Figure 7 shows a picture of three installed gPIMS before backfilling the buried area.
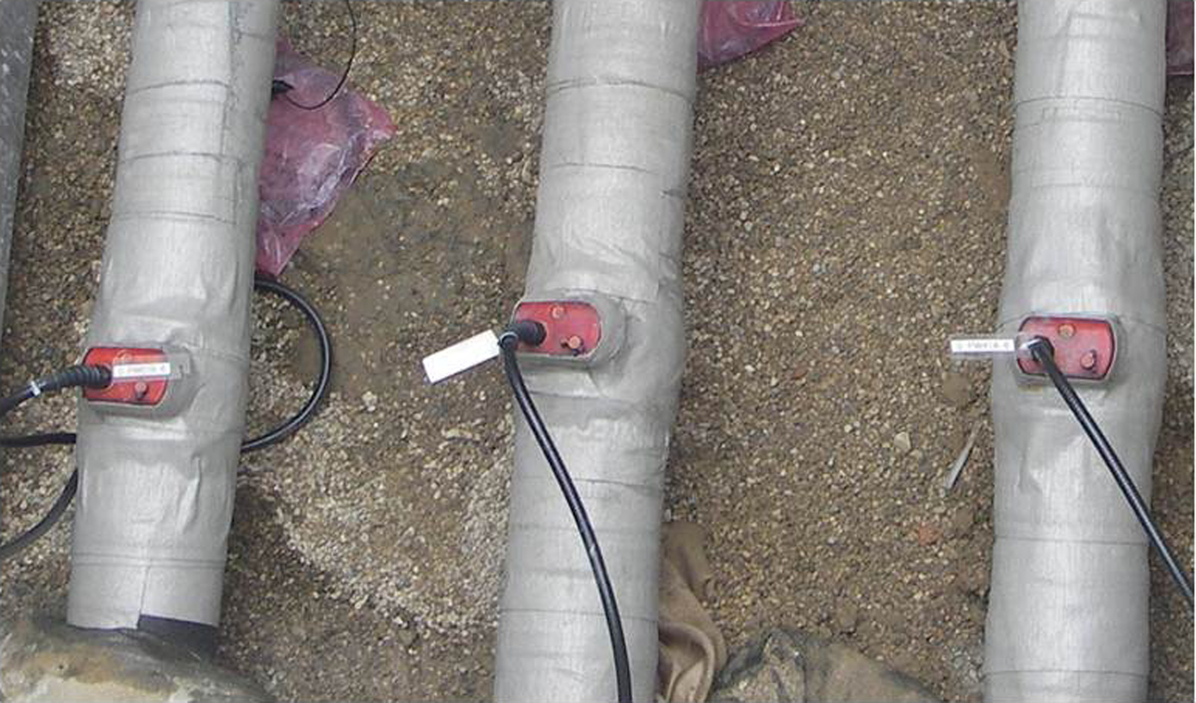
gPIMS installed on Essential Water Service (EWS) line in nuclear power plant. Picture taken after reinsulating and before backfilling
The pipe was covered with a thick bitumen coating and buried in clay type of soil. In the negative direction in Fig. 8, a weld is clearly visible (labelled −F3). The thick bitumastic coating and the clay soil in which the pipe is buried have caused a dramatic increase in attenuation, which has resulted in a much reduced test range of ∼6 m in each direction. The pipe did not show the presence of areas of concern above 3% of the cross-section within the diagnostic range.
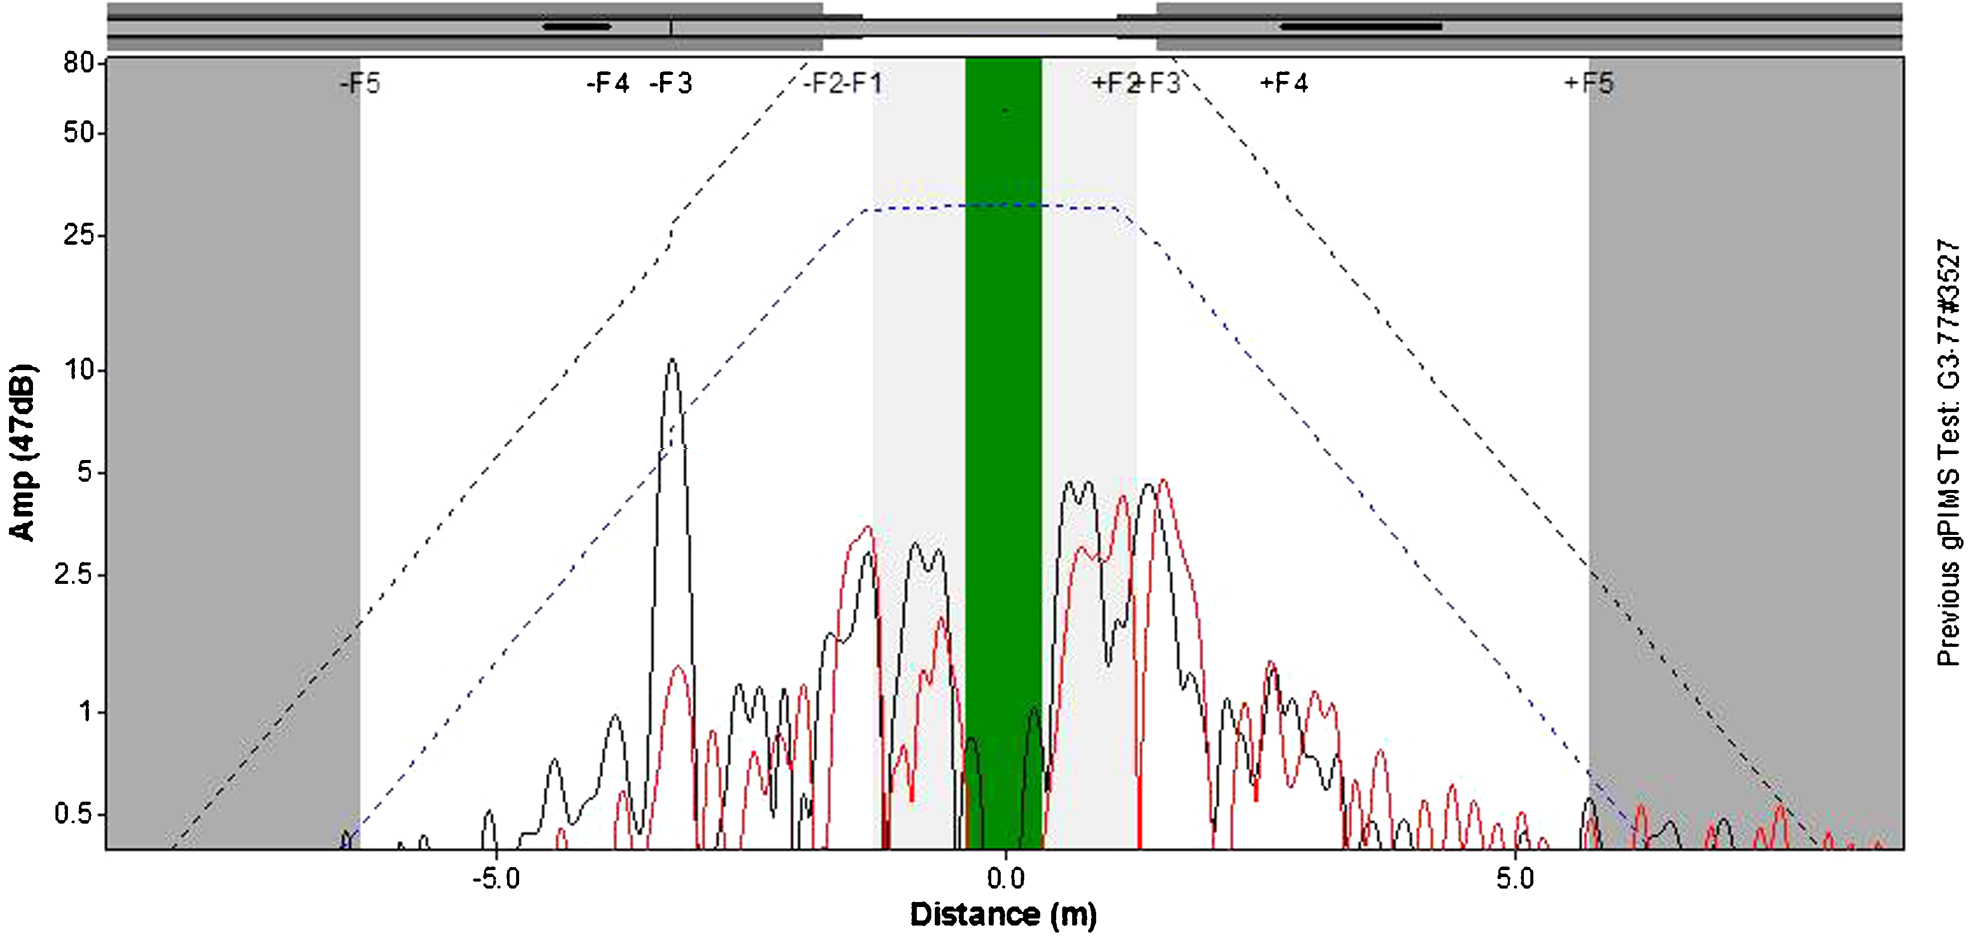
Example result of EWS buried line inspection
Conclusions
The stability and sensitivity of the gPIMS reported in this article demonstrate the general reliability of the transduction system. The capabilities of the Wavemaker G3 pipe screening system to detect circumferential distribution of wall loss and the operation over a wide frequency range enable good accuracy of the calls and the reduction in false calls that hugely increase the total price of the inspection (including verification) in pipes that are difficult to access. The performance in terms of range is linked to the pipe geometry and coating/earth type and condition. The experience with gPIMS when working in relatively difficult operational environments (buried pipes) demonstrates the robustness and durability of gPIMS in applications where a monitoring approach provides a good solution in terms of cost/benefit.