
Abstract
The thermal expansion mismatch between a metallic substrate and its external oxide scale generates a strain on cooling that is the primary cause of spallation of protective oxide scales. This study investigates the thermal stability, by means of thermal expansion and oxidation behaviour, of the nanostructured FeCr alloy prepared by different consolidation techniques by means of the spark plasma sintering (SPS) method and to compare with conventional sintering technique by means of hot pressing (HP). This has potential application as interconnect in solid oxide fuel cell. Commercially available ferritic steel is chosen as a comparison of another high Cr ferritic model alloy. The beneficial effect of the reactive element by means of lanthanum onto the alloy surface that is introduced using ion implantation is also explored. The specific aspects studied were the effects of nanocrystalline structure, influenced by sintering method and surface treatment through La ion implantation of chromia forming alloys, which may improve their high thermal stability. Oxidation testing was conducted at 900-1100°C for 100 h in laboratory air. Characterisations using X-ray diffraction, scanning electron microscopy and energy dispersive X-ray spectroscopy were carried out before and after each route or process to investigate the microstructure, phase change and formation of the oxide layer. The results revealed that the FeCr alloy prepared by SPS were more effective to retain nanocrystalline and better properties than those prepared by HP and the commercially available ferritic alloy. For all types of specimens, the presence of La had no detectable effect on thermal expansion but a major effect on scale adherence. The coefficients of thermal expansion for the alloy prepared by SPS were lower than those prepared by HP, and the scale adherence to the La implanted alloy was generally superior. The results consistently showed that a better reduction in oxidation resistance corresponds to excellent nanostructured alloy and La implantation.
Introduction
The solid oxide fuel cell (SOFC) is a multilayered structure and consists of ceramic and metallic materials. Many industrial applications require hundreds of volts, and to generate this using SOFC, hundreds of cells and interconnects are assembled in series to form a fuel cell stack. Interconnects are an important part of SOFC for long term safe operation. 1 Interconnects in SOFC link the anode of a cell to the cathode of the next cell in the battery, distribute the gases in the anode and cathode and also transport electric current between the cells and in the external circuit. The material used as interconnect is expected to satisfy a variety of requirements, such as high density, high electrical and thermal conductivity and high creep resistance. 2
Over the years, a number of metals and ceramic materials have been considered and tested for use as interconnects of planar SOFC, such as Cr based or Fe–Cr binary alloys and Fe–Ni–Cr ternary system. However, no satisfactory solution has been found. Recently, doped LaCrO3 based ceramic interconnects were used in fuel cells. 1 These ceramics were difficult to shape, and the costs involved in manufacturing dense interconnects were very high. In recent years, the use of metallic interconnects has been gaining ground due to the availability of a variety of manufacturing techniques, low shaping costs and adequate thermal conductivity. The SOFC generally operates at ∼1000°C. A number of studies are being carried out to reduce the operating temperatures of SOFC, and the lower temperatures allow metallic interconnects to be considered. Introducing metallic interconnects to the cell material set, however, presents new challenges that must be overcome. Conventional alloys still cannot endure a high temperature for a long time. The thickness of the oxide scale increases with increasing time, resulting in high electrical resistance and poor cell performance.
Therefore, the availability of a suitable material for the interconnects is of key importance for SOFC development. In this study, two approach methods are adapted to improve the thermal stability of an alloy, e.g. develop new alloys and conduct surface treatment. In order to develop new alloys, the strength and oxidation resistance of the alloy can be improved by crystallite size refinement, especially to nanometric scale. 3 However, eliminating grain growth at high temperature is still a challenge, and many investigations are being performed to address this issue.
The use of surface treatments such as ion implantation is a viable alternative to reduce the oxidation rate and extend the useful life of potential alloys as SOFC interconnects. Chromium dioxide forming iron based alloys have been studied as potential materials for interconnects. 2 Nevertheless, the surfaces of the alloys require modification to improve the electrical conductivity of chromium dioxide. 4 The addition of reactive elements such as yttrium, zirconium or cerium to these alloys improves the protective properties of surface oxides even more.5–9 Rare earth oxides in the form of dispersions have also been added to these alloys to form protective surface oxides. 10 Implantations of lanthanum have been reported to increase the adhesion of the chromium dioxide layer, reduce its growth rate and increase conductivity. 11
Owing to the substantial nanostructured alloy development, sintering is one of the significant step processes for producing a product of powder from ‘green’ specimen to a solid specimen. Different powder metallurgy consolidation technologies have been proposed, such as (i) pressureless sintering after unidirectional compacting or hydrostatic compacting (CIP), (ii) hot pressing (HP) and (iii) spark plasma sintering (SPS). Full density compacts that retain nanometric grain size are of essential significance in interconnect SOFC application, which can produce better properties of alloys, specifically in reducing the kinetics of oxidation; however, this is not easy to achieve. Numerous experimental and theoretical investigations into the process suggest the ability of SPS to produce highly density compacts, which suppress grain coarsening.12–16 Therefore, in this work, the mechanical alloyed Fe–Cr powder had been introduced using the most novel and increasing method SPS technique to produce bulk FeCr alloy specimens.
The key issue of the chromia forming Fe–Cr alloy application that must be overcome is its good corrosion resistance, its coefficient of thermal expansion (CTE) that is close to that of solid electrolytes and the ability to work efficiency in air or gas mixture atmosphere due to the high oxidation resistance of the thermally grown chromia scale.17–22 In the present work, the investigation of the efficiency of two consolidation techniques by means of SPS method and to compare with conventional sintering technique by means of the HP that allows obtaining fully dense nanostructured Fe–Cr alloy and surface treatment through La ion implantation are focussing on these issues, which correspond to the SOFC environment operating conditions. Commercially available ferritic steel is also chosen as a comparison of another high Cr ferritic model alloy.
Experimental
Preparation of materials
The as mechanically alloyed Fe–Cr in the form of powder 23 with nominal weight composition of iron/Fe and chromium/Cr close to 80∶20 wt-% was consolidated via two different sintering methods: SPS and HP. In the SPS process, the as mechanically alloyed Fe–Cr powders were poured into graphite die with an inner diameter of 20 and 5 mm in thickness and sintered in a vacuum using SPS model 10-3 apparatus (Thermal Technology LLC, USA) at a loading pressure of 120 MPa. In order to promote the consolidation, the resulting compacts were sintered at lower sintering temperature and compared to HP with two different sintering temperatures of 800 and 900°C at the very fast heating rate of 400°C min−1 with significant short holding time of 5 min. In the HP process, the mechanically alloyed Fe–Cr powders were poured into a cylindrical shape and pressed at 25 MPa with a diameter of 33 mm and thickness of 4 mm using vacuum hot press machine (High Vac. Co., Korea) and sintered in the temperature of 1000°C at heating rate of 20°C min−1 with the holding time of 45 min. For comparison, the commercially available ferritic alloy, containing 14·5 wt-%Cr, 1·07 wt-%Si and 0·51 wt-%Mn as main alloying elements, was selected for this study because of its low cost, ready availability and suitable chromium content. The densities of the sintered specimens and the available alloy were determined according to Archimedes’ method. The density value will also be considered as a basis for comparing the results of two different sintering processes. Then, the samples sintered in the hot press at 1000°C are labelled as HP1000, and the samples sintered in the SPS at 800 and 900°C as SPS800 and SPS900 respectively.
Ion implantation
Before ion implantation, all the studied samples with the size of surface area of ∼8 cm2 were ground using up to #1000 grit SiC abrasive paper and polished to 0·05 μm alumina solution according to standard metallographic. The polished specimens were then ultrasonically cleaned in ethanol for 30 min, rinsed with deionised water and dried. In this work, the dosage of lanthanum ion was fixed at the nominal dose of ∼1×10¹⁷ ions/cm2. The implantation was carried out using an ion implanter of Cockroft–Walton type. The ion beam energy was maintained at 100 keV with beam current density of 10 μA cm−2 and 200 kV extraction voltages.
Thermal expansion
The CTE measurement was conducted using a Linseis D-8672SELB dilatometer. The dilatometer was of horizontal configuration type with precision push rods and sample holder constructed of high density alumina. The alumina rod with a length of 10 mm was used as the standard reference material. For dilatometric studies, the measurements were performed between room temperature (27°C) and 900°C in air atmosphere for heating and cooling rates from 1 to 2°C min−1 with 1 h of holding time at a maximum temperature to guarantee uniform temperature distribution to the samples. The test was conducted according to ASTM E228. The slow ramp rate through 280-350°C was necessary to minimise obscuring the micrometre measurement. A push rod, which rests on the sample, can transmit the differential changes in length of the sample to the length measure system: the linear variable differential transformer. The linear variable differential transformer was housed in an enclosure maintained at 40°C by means of water circulated from a constant temperature bath and has an accuracy of ±0·15 μm. The temperature of the sample was monitored with a Pt–Pt10%Rh type S thermocouple placed beside the sample.
High temperature oxidation
High temperature oxidation experiments were carried out in a box furnace under laboratory atmosphere at 900-1100°C for 100 h. The heating and cooling rates were maintained at 5°C min−1. The weight of the samples was measured each 20 h interval by an electronic microbalance with the sensitivity of 0·01 mg for calculating the mass gain upon oxidation and to evaluate the oxidation resistance of the studied alloy.
Microstructure characterisation
The microstructures of the studied samples, both implanted and unimplanted, and as oxidised samples were examined using a JEOL JSM-6380LA scanning electron microscopy (SEM) equipped with energy dispersive X-ray spectroscopy (EDS). The phase formations of samples were determined using a Bruker model D8 Advance X-ray diffractometer (XRD) (Cu Kα radiation beam, λ = 0·15406 nm) from Braggs angle (2θ) in the range of 30-90° at a scan rate of 0·02° min−1 to provide adequate sampling of the peak height (full width at half maximum, FWHM). For phase identification, the software package International Centre for Diffraction Data (ICDD) and the powder diffraction file database of the standard reference materials were used. Samples for cross-sectional investigation were hot mounted in resin, ground and polished (last step 1 μm diamond). Microstructure investigations were also performed using SEM. Meanwhile, line chemical analysis was performed using EDS.
In this work, characterisation using XRD was also used to determine the crystallite size of the alloy. The crystallite size of the alloys was determined from the X-ray peak broadening technique using the Voigt function, after eliminating the instrumental and lattice strain contributions to peak broadening. The most intense peaks that have no superposition with the other peaks were then selected to calculate the average crystallite size. The crystallite size is determined according to FWHM of the corresponding XRD line using the Williamson–Hall method. 24
Results and discussion
The primary focus of the work is to study the feasibility of ferritic based alloy as SOFC interconnects. Several stage processes, nanostructured alloy (through the HP and SPS consolidation process) and ion implantations were evaluated to study their effect on the thermal expansion and long term stability of the oxide layer. The purpose of the surface treatment (ion implantation) is to achieve a dense oxide scale of uniform thickness. In the SOFC application, the oxide scale is part of the electrical circuit; therefore, its stability and conductivity are important. The effectiveness of nanostructure, on the crystallite size of specimens calculated using the Williamson–Hall method, on material performance was also evaluated.
FeCr powder and sintered samples
The powder morphology observed by SEM image is given in Fig. 1 with ×200 and ×1000 magnifications. Based on the images, the as received FeCr powders show the typical particle morphology that consists of irregular spherical shapes or round type with a relative uniform distribution of particles. In the images with higher magnification, particles with sizes in the range between 0·5 and 4 μm are observed. The SEM images also show that the as received FeCr powders are agglomerated to some extent, but the level of agglomeration is very minor. The agglomeration usually occurs when the particles overlap each other, and this will cause inhomogeneous size and shape of the powders. As the particle should be sintered, according to Tokita, 25 the spherical shape morphology is beneficial due to the particle solidification process to achieve full interparticle bonding.
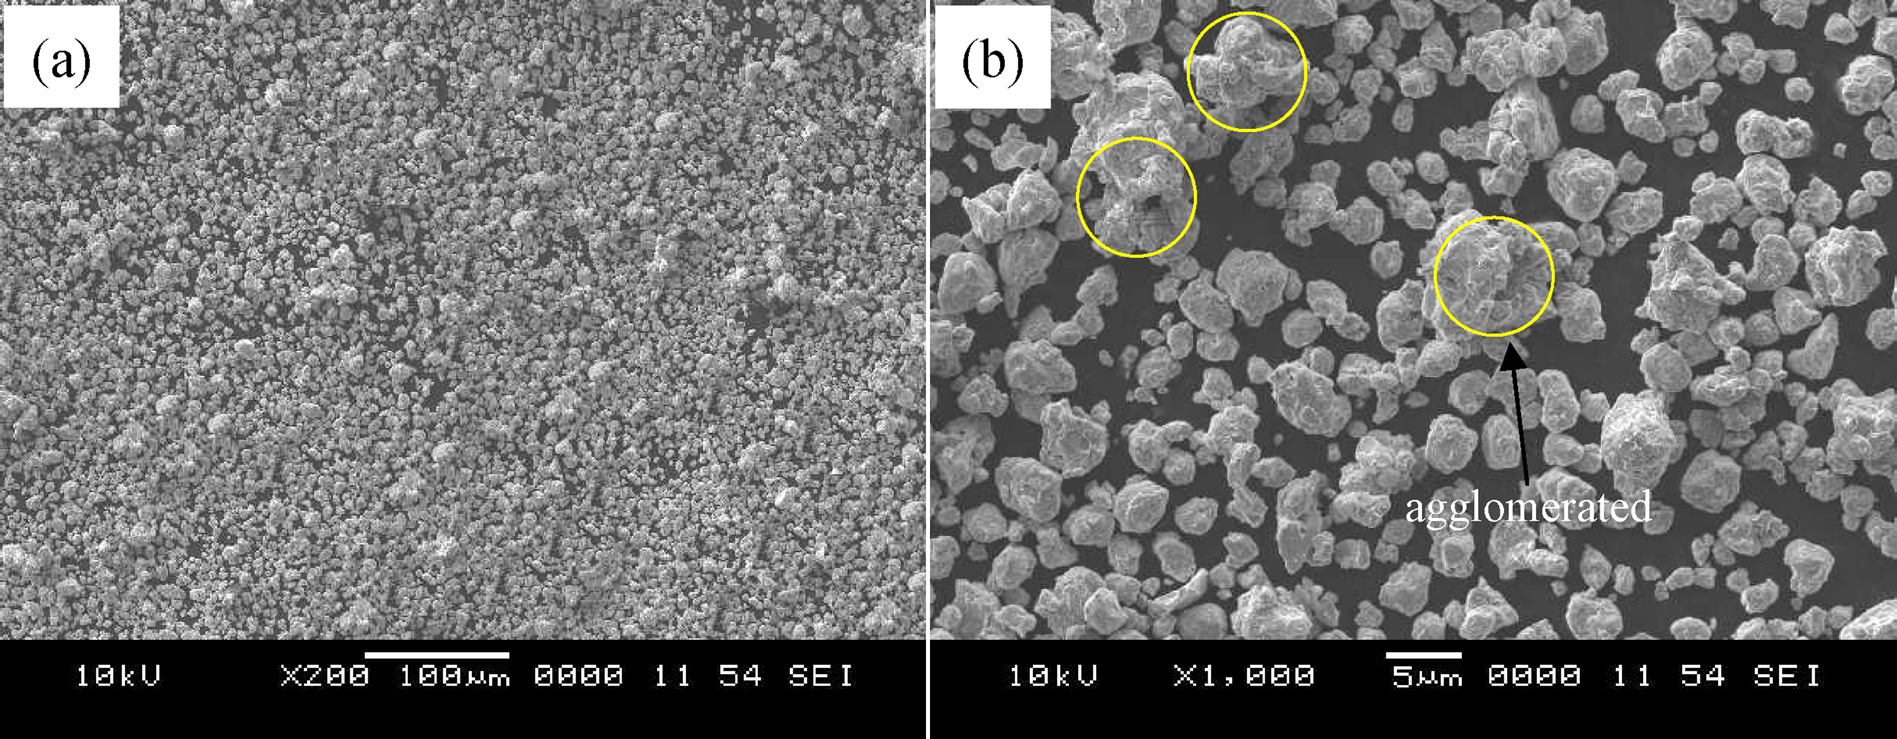
a ×200 magnification; b ×1000 magnification
The EDS spectrum produced from the analysis is shown in Fig. 2. The analysis indicated that the surface region of particles had a higher concentration of iron and chromium. Based on the height of powder peaks, the overall compositions are estimated to be 77·72 wt-%Fe and 22·28 wt-%Cr. This indicates that the sample of the as milled powder with composition of Fe–20 wt-%Cr is confirmed as FeCr phase, and it also shows the relative closer to the targeted powder composition.
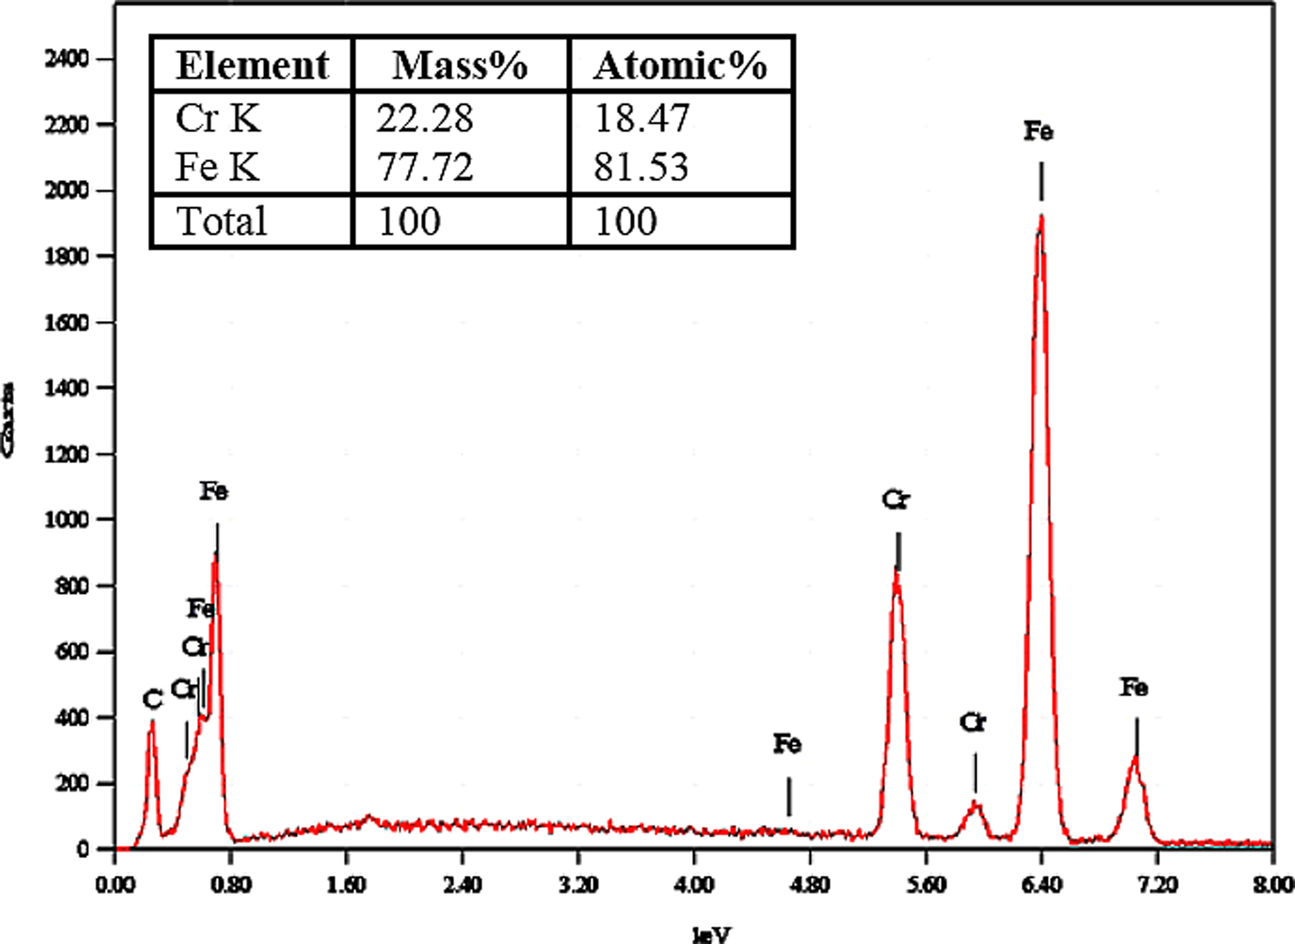
Energy dispersive X-ray spectroscopy results of as received mechanically alloyed Fe–20 wt-%Cr powder
The XRD full scans for the as milled FeCr powder are shown in Fig. 3. The XRD pattern of the powder shows three strong line peaks at the scattering angles of 44·581, 64·881 and 82·140°, which can be assigned to reflections from the (110), (200) and (211) planes. Consequently, line profile (110), (200) and (211) peaks were used for the Williamson–Hall analysis to estimate the crystallite size of the samples. The ICDD data suggested that the phase detected in the powder can be identified as FeCr (ICDD card no. 34-0396). All the diffraction peaks appear relatively broad for the reason that the grains of the powders have a nanometric size due to the mechanical deformation introduced into the powder. Particle crystallite refinement occurs, and the lattice strain increases. These two effects lead to broadening of the XRD peaks and a consequent decrease in the peak heights.
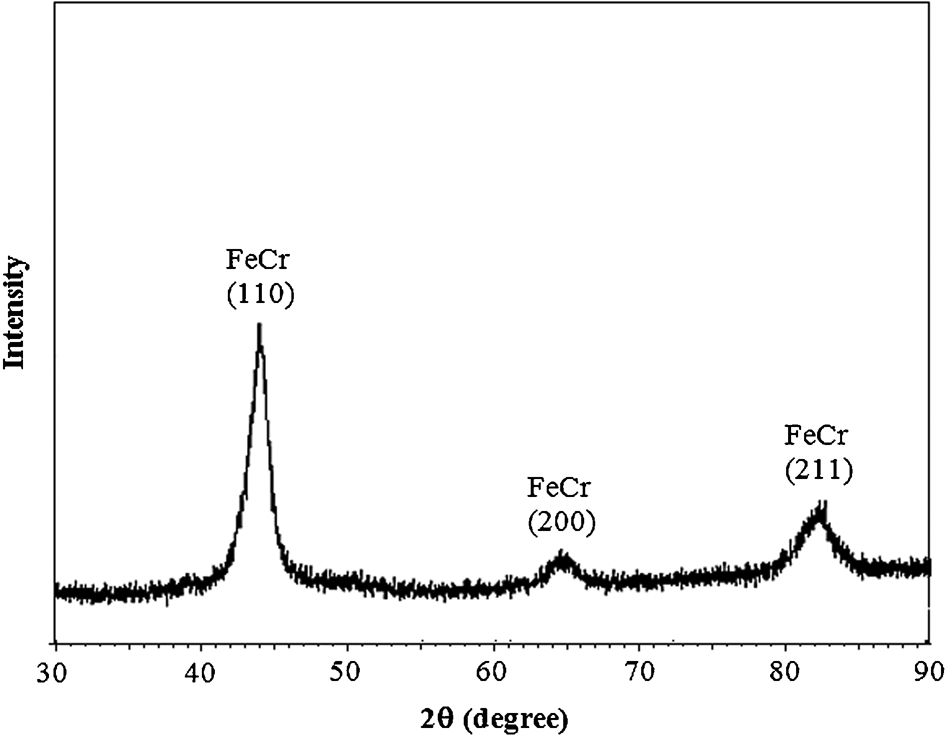
X-ray diffraction results of as received mechanically alloyed Fe–20 wt-%Cr powder
Figure 4 shows the surface microstructure of the as consolidated samples (by SPS and HP) and the as received commercial alloy. The microstructures of the spark plasma sintered samples show a more homogenous consolidation compared to the hot pressed sample. The voids still existed in the spark plasma sintered FeCr, however, less than the hot pressed FeCr. The voids that existed in the spark plasma sintered and hot compacted samples are homogeneously distributed throughout the samples. There were only few voids found in the commercial alloy; however, large voids existed in the sample and inhomogeneous distributed. It is very important to eliminate or minimise the void formation at the oxide/substrate interface since it can decrease the adherence, which leads to failure.
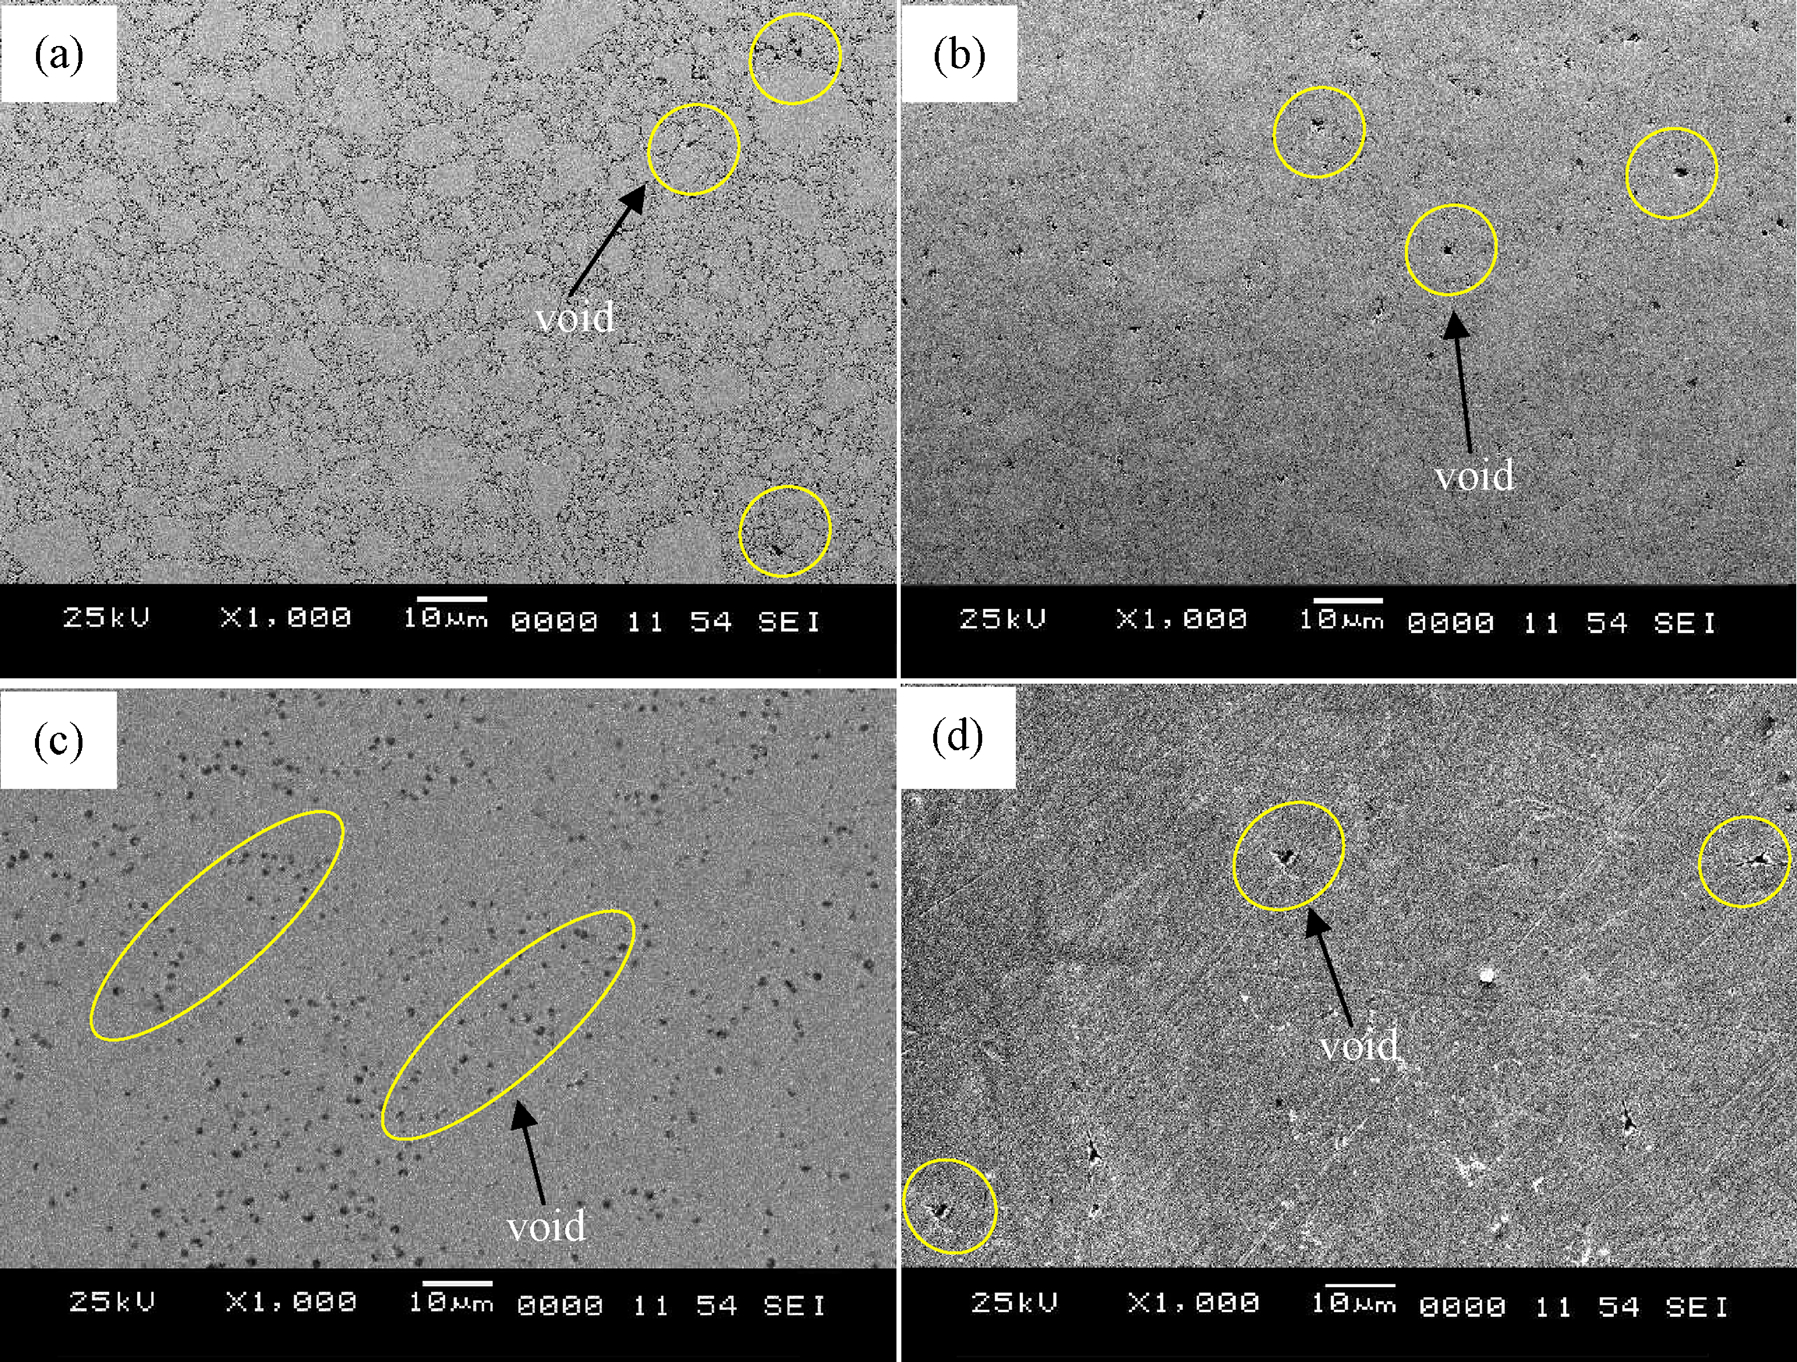
Images (SEM) for as consolidated a FeCr with SPS sintered at 800°C, b FeCr with SPS sintered at 900°C, c FeCr with HP sintered at 1000°C and d as received commercial alloy
Figure 5 shows the XRD results for all the studied specimens: a as spark plasma sintered at 800°C, b as spark plasma sintered at 900°C, c as hot pressed at 1000°C and d as received commercial alloy. All the three strong line peaks of the as consolidated and as received samples were shown that the phase detected in the samples can be identified as FeCr. Comparing the XRD peaks before and after the consolidation process, the peaks become sharper than those in the patterns of the as milled powders (Fig. 3). These peak width reductions were considered due to the increase in the mean crystallite size and the decrease in the mean lattice strain. It also indicated that the progressive sharpening of the peaks was due to the grain growth during the consolidation process. Regarding the as received commercial alloy (Fig. 5d), the XRD peaks show the sharpest than those in the patterns of the as consolidated samples. It can be pointed out that the as received commercial alloy consists of coarser size.
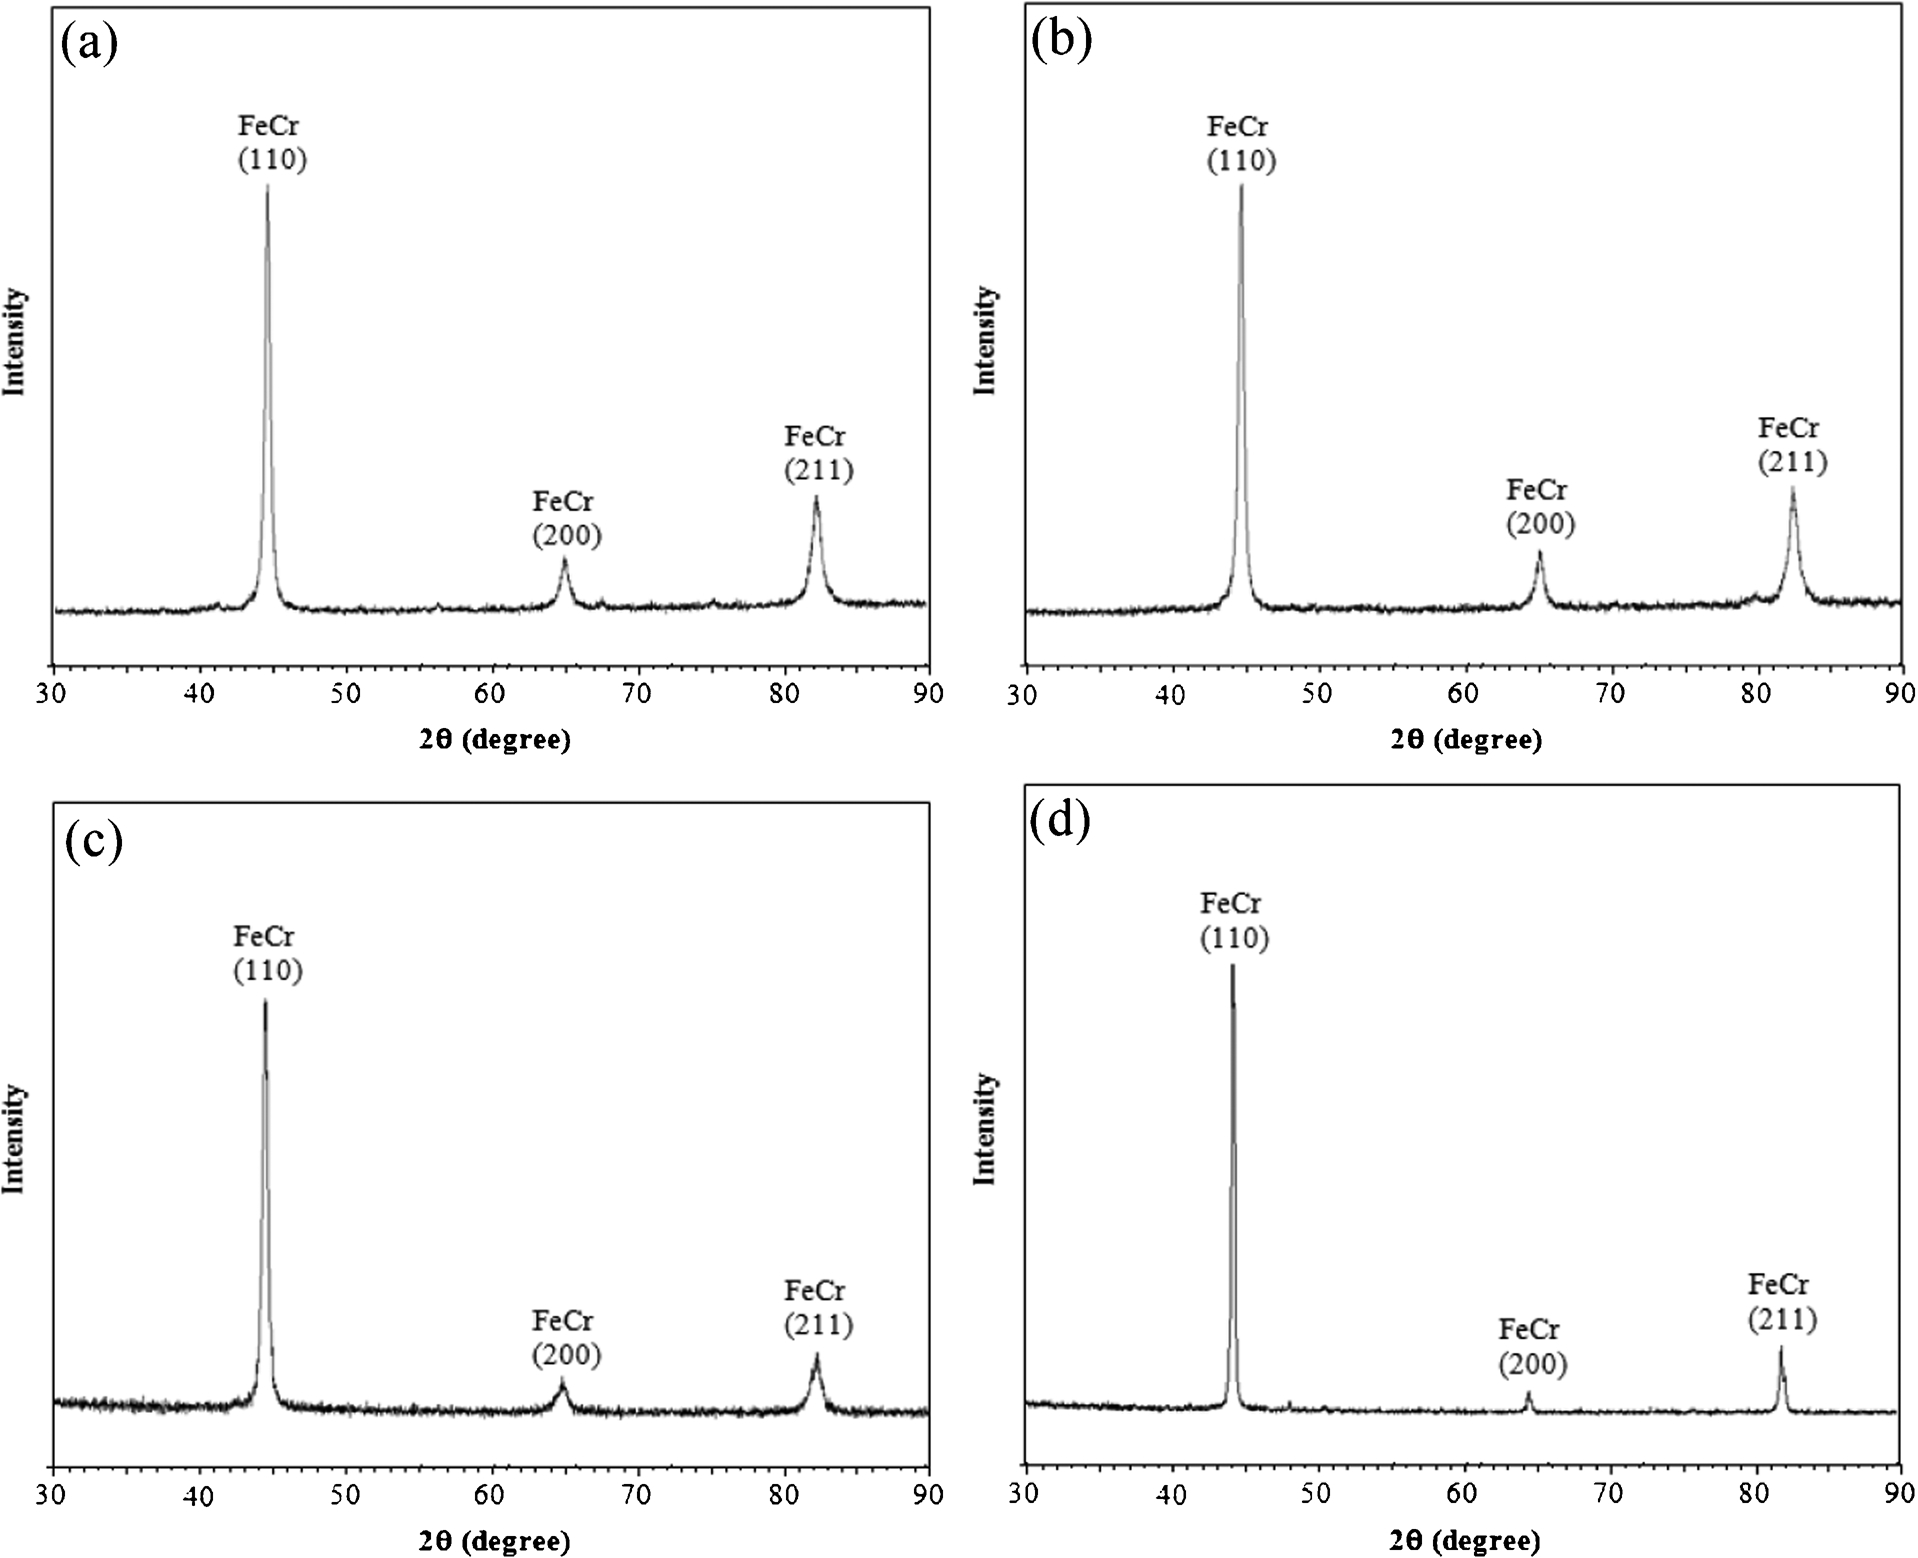
a FeCr with SPS sintered at 800°C; b FeCr with SPS sintered at 900°C; c FeCr with HP sintered at 1000°C; d as received commercial alloys
Crystallite size and density
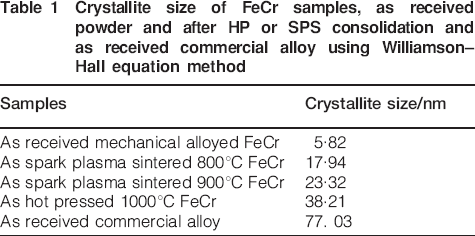
The crystallite sizes of the FeCr alloy, as received powder and as consolidated and as received commercial alloy samples were calculated or estimated from the XRD data using the Williamson–Hall method. The size calculations were based on the assumption of spherical grains. The FeCr crystallite size was calculated by measuring the FWHM of (110), (200) and (211) planes. These peaks were chosen since it shows the strongest line peaks and did not overlap with the others peaks. The size calculation results are summarised in Table 1, which shows that the powder consolidation process had increased the crystallite size of the as received mechanically alloyed FeCr powders. Among the consolidation techniques, the HP sample resulted in larger crystallite size. It was probably because of an extensive grain growth during the HP process. In HP sintering, more time was consumed to optimise the sintering parameters in order to achieve the sintered product than the SPS. The FeCr crystallite sizes of SPS samples, SPS800 and SPS900, are ∼18 and 23 nm, approximately three and four times the powder crystallite size respectively. The crystallite size of the HP sample is approximately two times larger than the SPS sintered samples and six times larger than the powder. Meanwhile, the crystallite size of the as received commercial alloy is ∼77 nm.
Crystallite size of FeCr samples, as received powder and after HP or SPS consolidation and as received commercial alloy using Williamson–Hall equation method
In this study, the as SPS sintered samples were sintered with lower sintering temperatures, which are ∼100 and 200°C lower than HP. The densifications take place much faster in the SPS than that in the HP process. In this experiment, the holding time of the SPS process was 5 min than that in the HP process in 45 min. This is likely to reduce the grain growth of the sintered product. It also has good agreement with the research that was studied by Zhang et al. 26 This could be due to the fact that the beneficial effect of SPS in the densification of alloy is on its capability to pin the grain boundaries, which will limit the grain growth of the alloy. The SPS process is also very significant to lower the sintering temperature and shorter soaking time, with only 10% of the load that is required for the HP process.
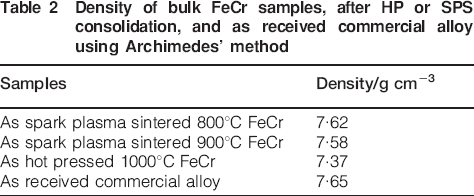
Density measurements were performed using the Archimedes’ method. The experimental error for the density measurement was estimated to be ±1% based on the resolution of the scale (0·001 g) used for these tests. The theoretical (100%) density of the alloys at this composition (Fe–20 wt-%Cr) is estimated ∼7·71 g cm−3 (density of Fe is 7·86 g cm−3 and for Cr is 7·19 g cm−3). The results for all the studied specimens, both as sintered and as received specimens, are presented in Table 2. It shows that the fully dense FeCr is more compacted for the as SPS sintered than the HP sintered samples, as shown by its higher density value. The enhanced densification by SPS was attributed to self-heat generation by the microscopic discharge between particles, activation of the particle surfaces, and high mass and heat transfer rate during the sintering processes.14–16 Based on the results, it shows that although the sintering temperature for the SPS is lower by approximately 100-200°C than the HP process, however, the obtained density is more compact.
Density of bulk FeCr samples, after HP or SPS consolidation, and as received commercial alloy using Archimedes’ method
Thermal expansion behaviour
The comparisons of the CTE as a function of temperature (T) are shown in Fig. 6. It shows the implanted and unimplanted a FeCr SPS800, b FeCr SPS900, c FeCr HP1000 and d commercial alloy samples. The reactive element implantation is included in order to investigate whether the beneficial effect of lanthanum implantation on scale adherence is related to the modification of the thermal expansion behaviour. The CTE measurements of each alloy were carried out over the temperature range from room temperature to 900°C.
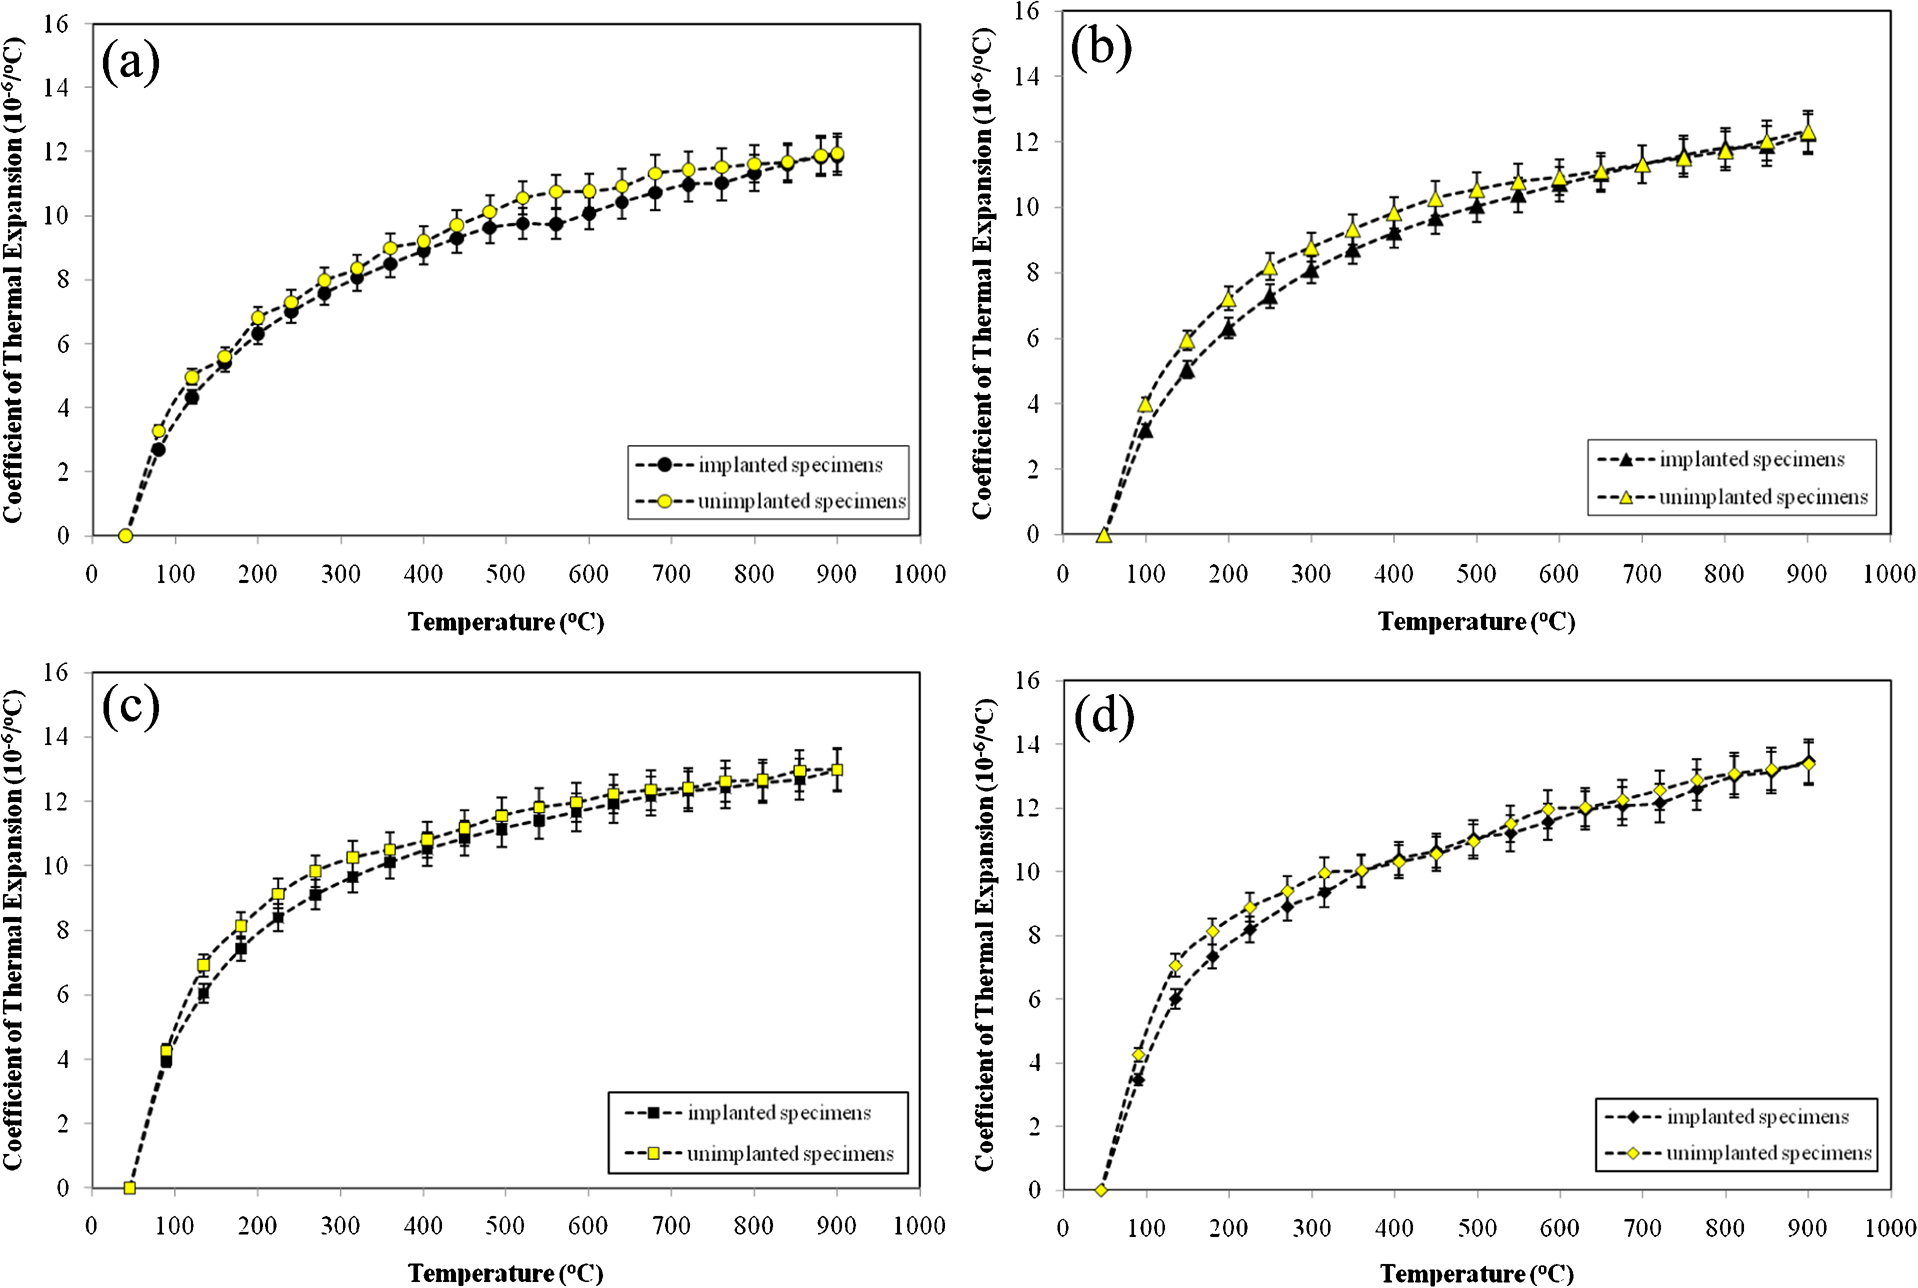
Comparison of CTE values between implanted and unimplanted for a FeCr SPS800, b FeCr SPS900, c FeCr HP1000 and d commercial alloy samples
The study demonstrated that lanthanum ion implantation had a negligible effect on thermal expansion. The four CTE curves shown in Fig. 6 were nearly identical in shape, and each exhibited only a slight increase in slope above ∼500°C, after which there were minor variations in the curves. Moreover, the thermal expansions of the implanted samples exhibited only slightly lower than the implanted samples over the temperature range of measurement, except in the case of commercial alloy with the slightly higher thermal expansion. In general, the differences of average CTE values (Δα) for implanted and unimplanted samples are only in the range between 0·01 and 0·1×10−6 °C−1. The average CTE values of implanted and unimplanted FeCr SPS800 are ∼11·86 and 11·96×10−6 °C−1, and the implanted and unimplanted FeCr HP1000 are ∼12·98 and 12·99×10−6 °C−1 respectively, as shown in Fig. 6a and c. Whereas the average CTE values of the implanted and unimplanted FeCr SPS900 are ∼12·25 and 12·33×10−6 °C−1, and the implanted and unimplanted commercial alloy are ∼13·48 and 13·39×10−6 °C−1 respectively, as shown in Fig. 6b and d.
According to the results of the thermal expansion experiments, the ion implantation shows insignificant change (extremely small) to the CTE values of the alloy. Materials generally change their size when subjected to a temperature change. The magnitude of the CTE mostly depends on the structure of the material. In the special case of this research, the ion implantation does not appreciably affect the size or dimension of an object. This means that the dimension per unit change in temperature can be assumed by changes only in the original structure (bond energy) of the alloy. Furthermore, the La element consists only of <0·2 wt-% (nominal dose of ∼1×10¹⁷ ions/cm2), which is distributed only at the surface of the alloy.
The FeCr SPS800 samples exhibited the lowest average CTE values, whereas the commercial alloy exhibited the highest average CTE values followed by FeCr HP1000 and FeCr SPS900 samples. The plausible explanation is that the decrease in thermal expansion of the samples in this study is observed as the porosity of samples is increased. Considering the porosity influence to the thermal expansion behaviour, it also has good agreement with the previous research, which was studied by Shui et al. 27 . This occurs due to the fact that the porosity (void) could accommodate the internal grain thermal expansion of the material.
The high operating temperature of SOFC requires that the CTE of the components be matched to avoid the thermal stress. 28 Therefore, one of the primary reasons that the thermal expansion behaviour of alloys is an important criteria for material selection is due to its effect on the thermal stresses, which lead to the significant long term stability of SOFC stack performance. Since an SOFC is commonly assembled at one temperature and placed into operation at another, any difference in thermal expansion behaviour of the different materials would become a potential source of stress in the SOFC. Precommercial SOFC generally used the YSZ as commonly material for the electrolyte. In the case of YSZ electrolytes, the CTE of the interconnects suggested having an approximate CTE value around 10·5-11×10−6 °C−1. 29 In this study, the CTE value of FeCr SPS800 (∼11·86×10−6 °C−1) was in better thermal expansion matching due to the CTE value of the YSZ electrolyte compared to other studied alloys, which are expected to be suitable as new SOFC interconnect materials.
Oxidation behaviour
Oxidation kinetics
The comparisons of mass gain curves presented here are the samples oxidised during a particular oxidation temperature, with the intention of providing a direct comparison between these respective alloys and to ascertain the beneficial effect of lanthanum implantation related to oxide formation kinetic trends. The obtained kinetics data reveal a relatively low oxidation rate of the studied alloys at different temperatures, confirming its high oxidation resistance.
The results of mass gain versus time for the unimplanted and La implanted samples after oxidation for 100 h at 900, 1000 and 1100°C are shown in Fig. 7a–c respectively. The analyses also include the effect of a certain reactive element (La) implantation to the studied samples. It shows that the mass gains of La implanted are reduced by ∼35% than the unimplanted samples. The impact is particularly noticeable to the FeCr SPS800; except at 1000°C, the commercial alloy shows better improvement of oxidation resistance compared to the other oxidised samples, as shown in Fig. 7b. However, at higher temperature (1100°C), as shown in Fig. 7c, the difference in oxidation behaviour between the implanted and unimplanted alloys only had slightly improved by ∼16%. Generally, the oxidation resistance curves between the as received commercial alloy and the as developed alloy (SPS and HP samples) show significant difference in mass gain during oxidation at 900 and 1000°C. Meanwhile, at 1100°C, it shows relatively similar oxidation curve trends.
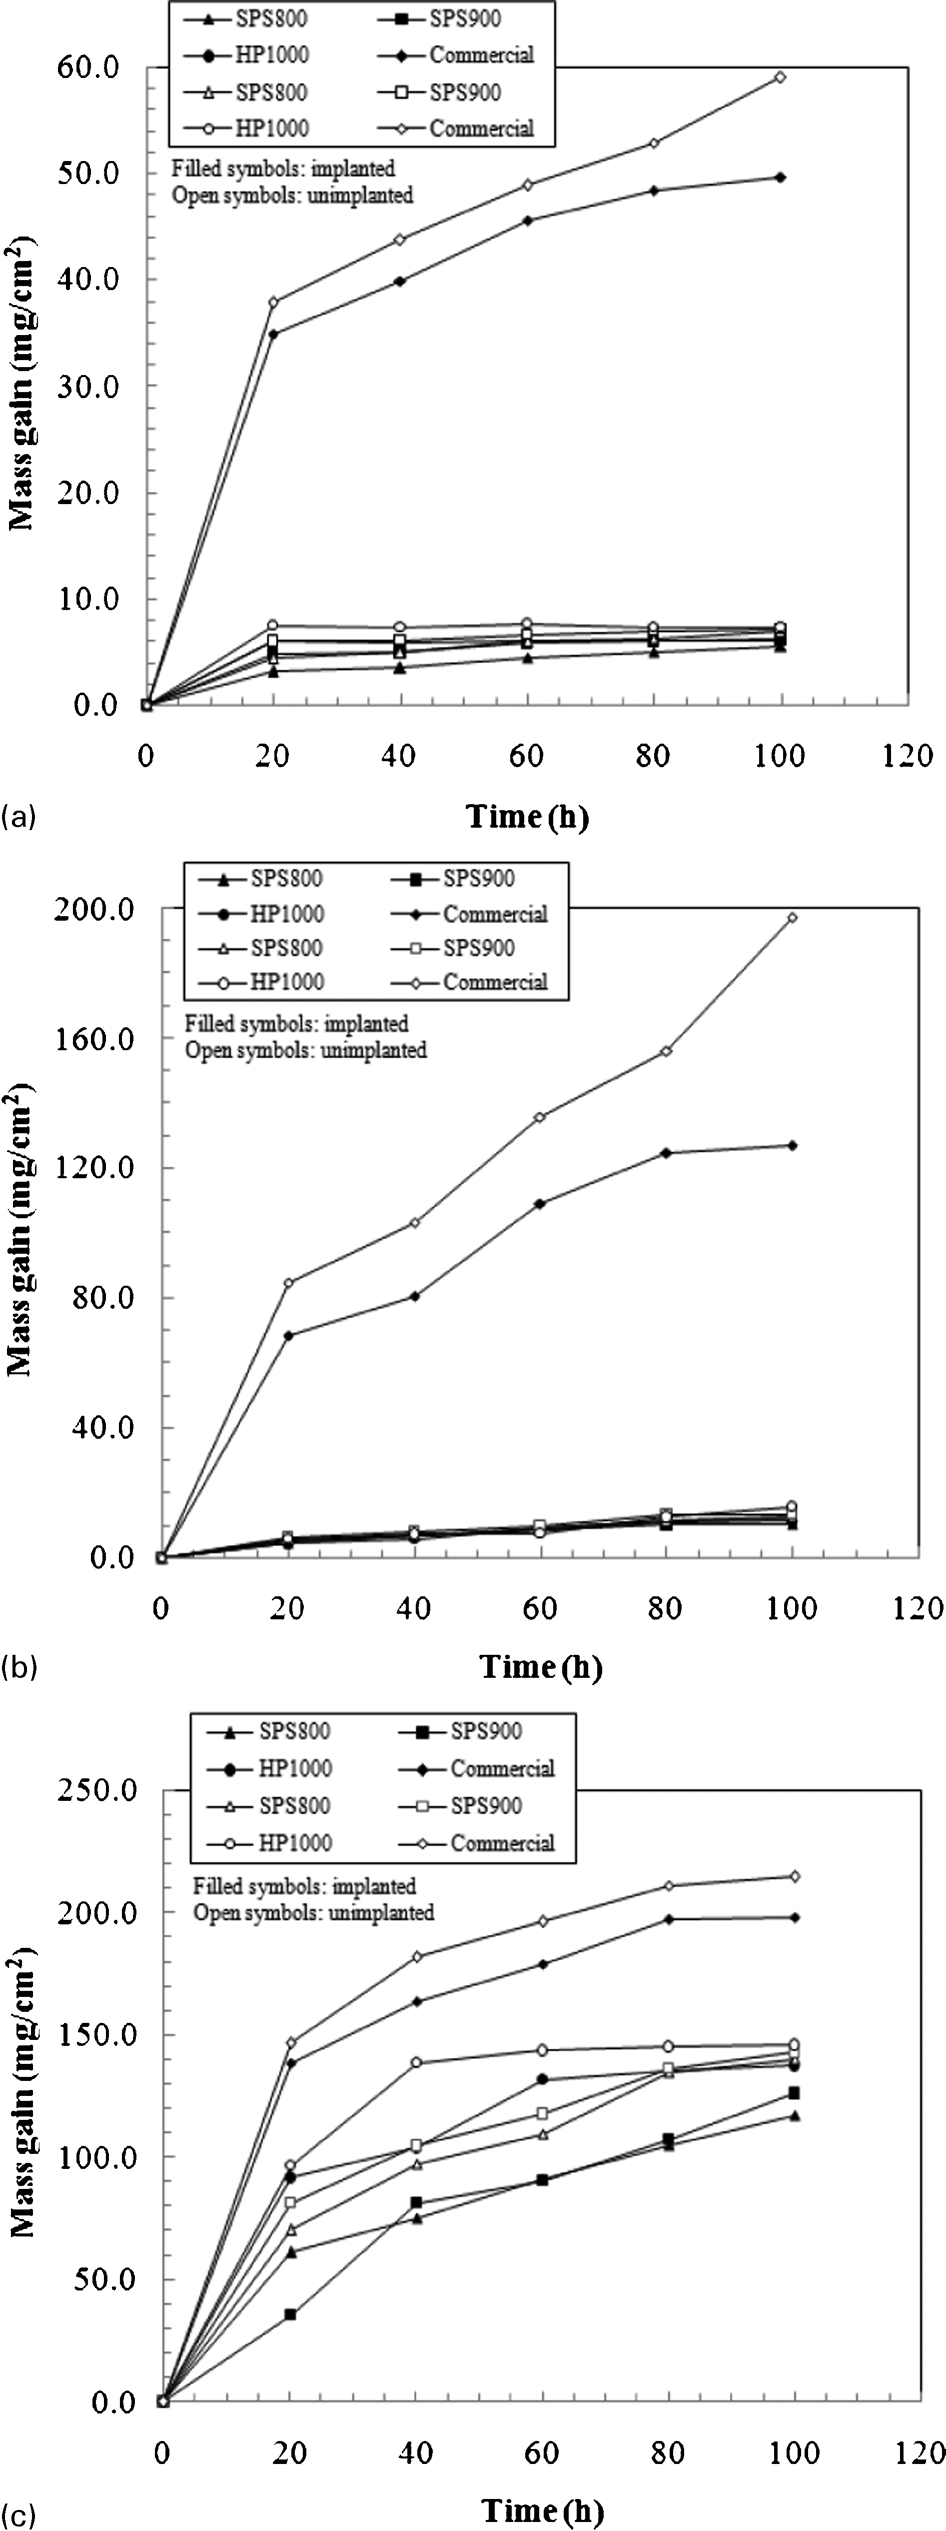
Mass gain as function of oxidation time for all specimens during oxidation at a 900, b 1000 and c 1100°C for 100 h in air
The reasons for such behaviour of mass gain trends during the oxidation at various temperatures are associated primarily to the formation of chromia scales at the interface with the alloy, which could be more explained due to the principle of gas/solid phase reaction kinetics.18,30 Chromia is increasingly susceptible to oxidation to volatile Cr2O3 at temperatures above 900-1000°C, especially in the presence of water vapour. Characterisation of the scale will be given by the XRD analyses, and a discussion is given later in this section. Furthermore, for identifying properly the oxide scale formed on the alloy in more detail, SEM morphology and EDS linescan analyses of these samples from the cross-section views were performed to get more information about the element distribution in the scale and thickness of each layer, and a discussion is also given later in this section.
The oxide formation kinetic trends for the unimplanted alloys, i.e. FeCr SPS800 sample, exhibited the best oxidation resistance, whereas the commercial alloy exhibited the lowest oxidation resistance followed by FeCr HP1000 and FeCr SPS900 samples. In this study, the increase in oxidation resistance of the samples is observed as the fine crystallite size (nanocrystalline structure) of the samples is increased. It is in agreement with the previous study by Gupta et al. 31 It is noted that the improved oxidation resistance in nanocrystalline alloys arises mainly because of the faster diffusion of elements that can form a ‘healing layer’ and/or because of the improved adhesion of the healing layer formed over the nanocrystalline structure. In addition, this also could be due to the fact that the oxidation resistance is sensitive to the microstructural (nanostructural) characteristics of the material. Thus, the parabolic rate constants deduced from those curves are reported in Table 3.
Parabolic rate constants (k p) for investigated alloys calculated from oxidation data
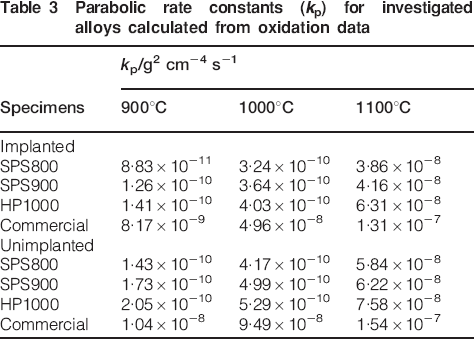
In Table 3, at 900°C, the parabolic rate constants were found to vary between 8 and 14×10−11 g2 cm−4 s−1 for the FeCr SPS800 sample, between 12 and 17×10−11 g2 cm−4 s−1 for the FeCr SPS900 sample, between 14 and 20×10−11 g2 cm−4 s−1 for the FeCr HP1000 sample and between 8 and 10×10−9 g2 cm−4 s−1 for the commercial alloy sample. In order for the alloy to be suitable for SOFC interconnect applications, a parabolic rate constant below 10−14 g2 cm−4 s−1 is required, and a value below 10−15 g2 cm−4 s−1 would be ideal. 32 Those values are chosen due to controlling the oxide thickness, which acts as a strong diffusion barrier that also can lead to the increasing electrical resistance. Metals with linear oxidation kinetics at a certain temperature have a tendency to undergo the so called catastrophic oxidation (also referred to as breakaway corrosion) at higher temperatures. As none of the alloys, implanted and unimplanted, resulted in a parabolic rate constant within the required range, therefore, further modifications are required in order for the alloys tested to be suitable for SOFC interconnect applications. The modifications that can be applied are surface treatment (single/interlayer) with other rare earth elements (Y, Ce), improving in nanostructured alloy or other modification methods. However, in this study, it shows that the as developed material has greater performance compared to the available commercial alloy.
Scale structure, morphology and composition
The XRD experiments performed on the surface of each exposed sample were used to identify the possible oxides formed during the oxidation at different oxidation temperatures. The XRD patterns for all the studied samples, implanted and unimplanted, after oxidising in different oxidation temperatures at 900, 1000 and 1100°C, are shown in Figs. 8–10. The XRD graph labelled with a represent as the SPS800 sample, b SPS900 sample, c HP1000 sample and d commercial alloy sample.
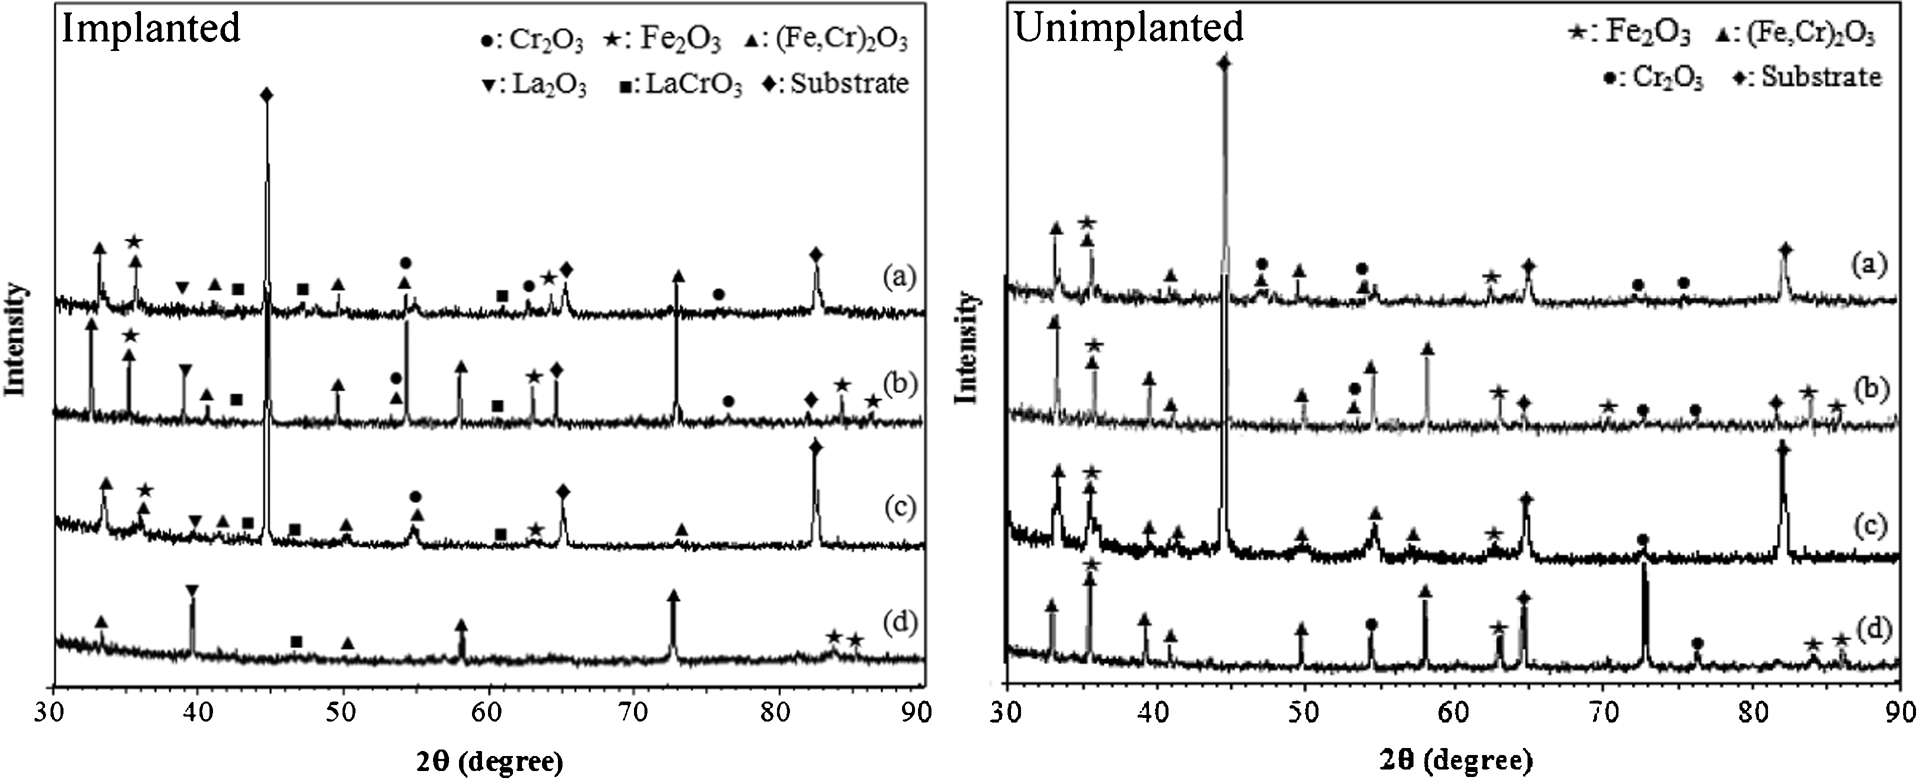
X-ray diffraction results for implanted and unimplanted samples a SPS800, b SPS900, c HP1000 and d commercial alloy oxidised at 900°C
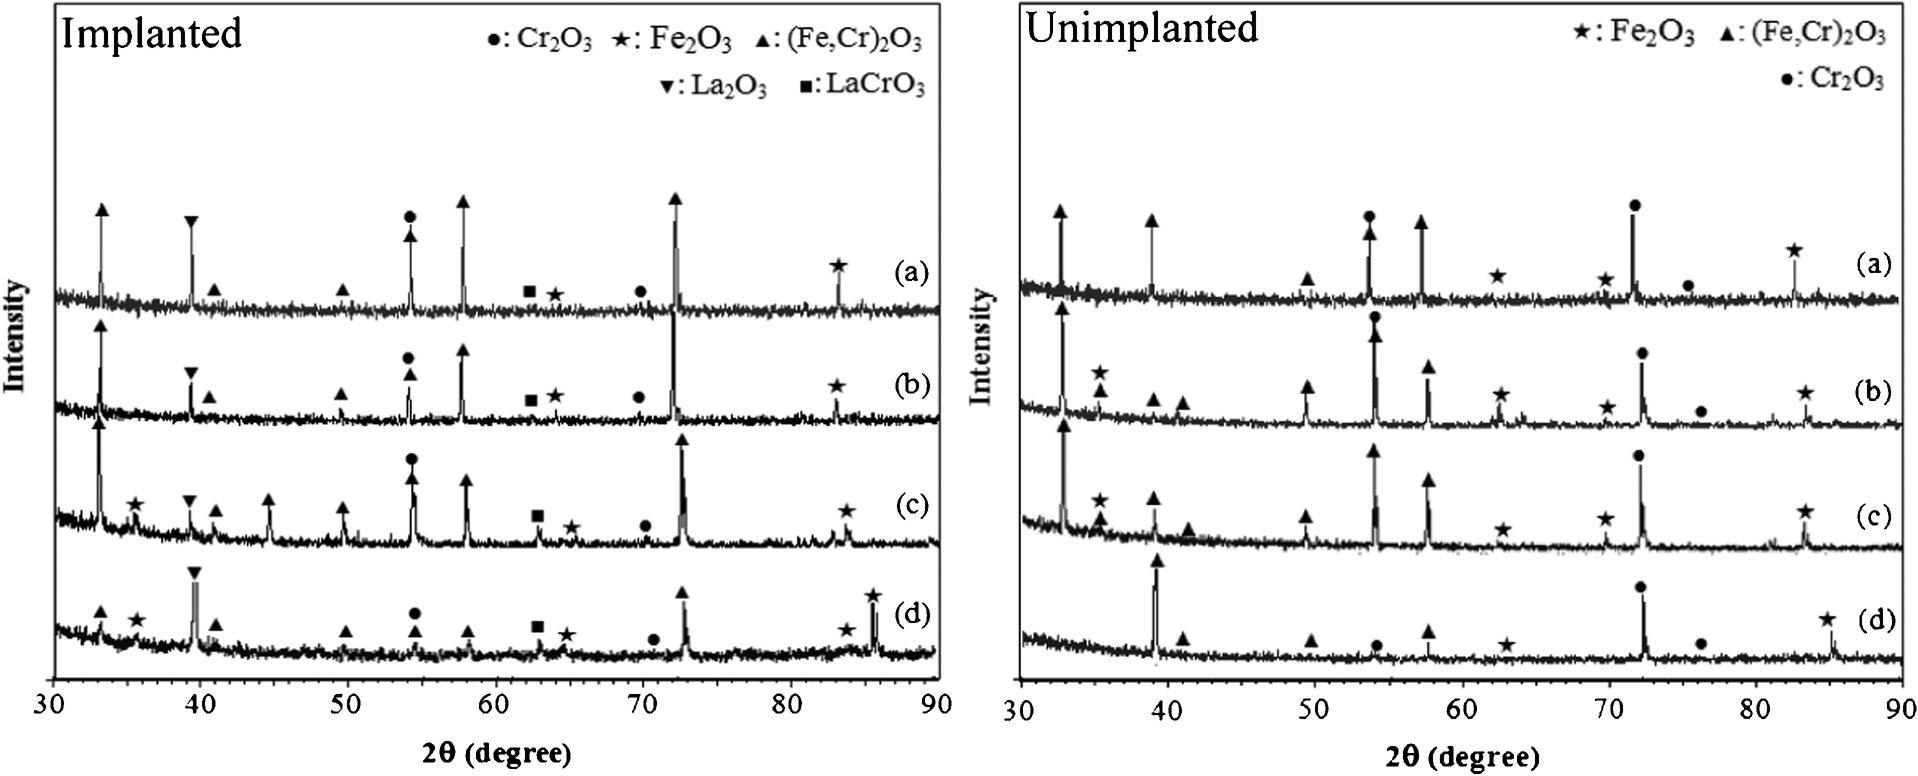
a SPS800; b SPS900; c HP1000; d commercial alloy oxidised at 1000°C
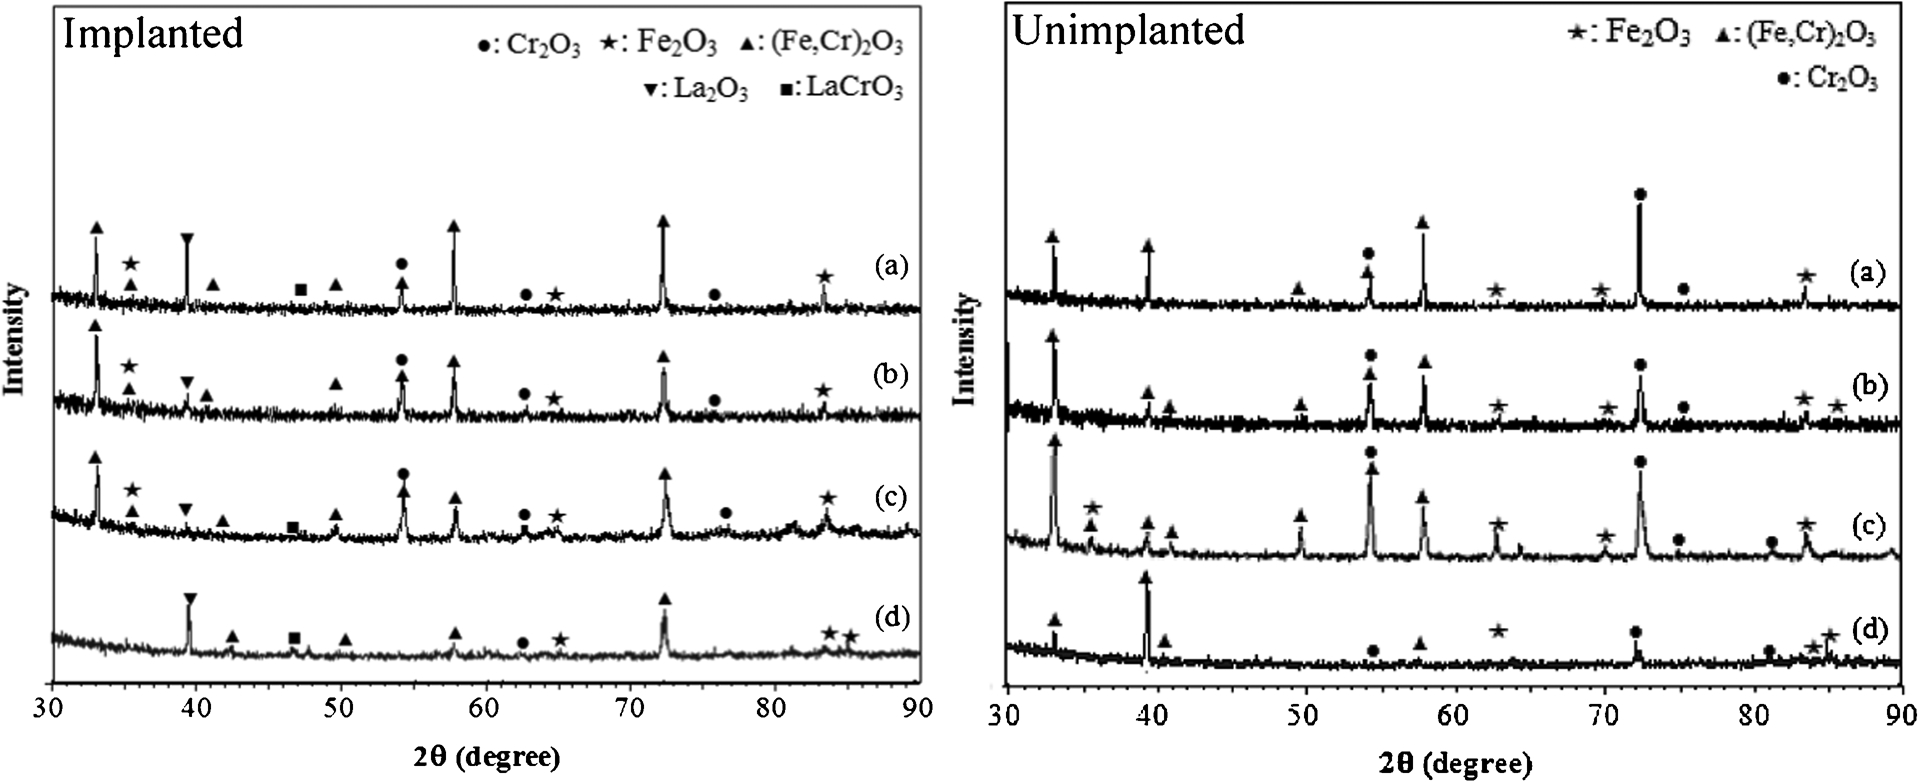
a SPS800; b SPS900; c HP1000; d commercial alloy
At 900°C (Fig. 8), the FeCr phase (substrate) is easily observed in all XRD graphs with a large peak (110) near 2θ = 44°. There are also relatively weak FeCr peaks found near 2θ = 64 and 82° that can be assigned to reflections from (200) and (211) planes. Whereas for the commercial alloy, the FeCr phase is not identified. The reason for such behaviour could be due to the layered thickness scale formed on the surface of commercial alloy. Obviously, for the implanted samples, the main contribution to the X-ray spectra is from Cr2O3 and very weak peaks of La2O3, LaCrO3, Fe2O3 and (Fe,Cr)2O3. The XRD diagram for the unimplanted samples indicated that mainly Cr2O3 is formed. Very weak peaks of Fe2O3 and (Fe,Cr)2O3 are also observed. After oxidation at temperatures 1000 and 1100°C (Figs. 9 and 10), the FeCr phase (substrate) is not detected, as the oxidation kinetics of the samples show higher than that at 900°C. However, for the implanted samples, the X-ray spectra were still found very weak of La2O3 and LaCrO3. At 1000 and 1100°C, generally, the XRD analysis also identified the identical signal peaks (oxide phases) as oxidised at 900°C, except it only showed differences in the higher signal peaks due to higher oxidation temperatures.
According to the XRD diagrams, the following oxide phases were identified and summarised. Comparing the diffraction peaks generated from the oxidised samples (with its ICDD files), the predominate phases in the oxide scales are (Fe,Cr)2O3 and Cr2O3. Moreover, weak diffraction peaks show the existence of La2O3 and LaCrO3. For the surface implanted and unimplanted samples, Cr2O3 (ICDD card no. 72-3533) was detected. The La implanted samples show LaCrO3 phase (ICDD card no. 33-0701) and phase La2O3 (ICDD card no. 71-4953). The Fe2O3 phase (ICDD card no. 71-5088) was also detected. It may have occurred due to the high oxygen pressure that provides a driving force for iron (as the main element of original substrate) diffusion through the chromia scale as the interface oxide layer substrate to form iron oxide. The XRD analysis also reveals the appearance of (Fe,Cr)2O3 (ICDD card no. 34-0412) and Cr2O3 phases at all exposure times by thermal oxidation at the specimen surface. It establishes the process of outward diffusion of Cr through the oxide layer at the specimen surface. The oxide scale structure is rather complex. However, in the simplest case, it can be considered to be a chromium oxide layer with some lanthanum–chromium oxide or ferritic–chromium oxide formed at the surface. The oxide scale elemental composition was then further analysed by the following surface and cross-section SEM and EDS linescan analyses.
The formation of an oxide layer on the alloy surface after 100 h oxidation testing is shown in Figs. 11–13 in different oxidation temperatures at 900, 1000 and 1100°C respectively. The SEM image labelled with a represent as the SPS800 sample, b SPS900 sample, c HP1000 sample and d commercial alloy sample.
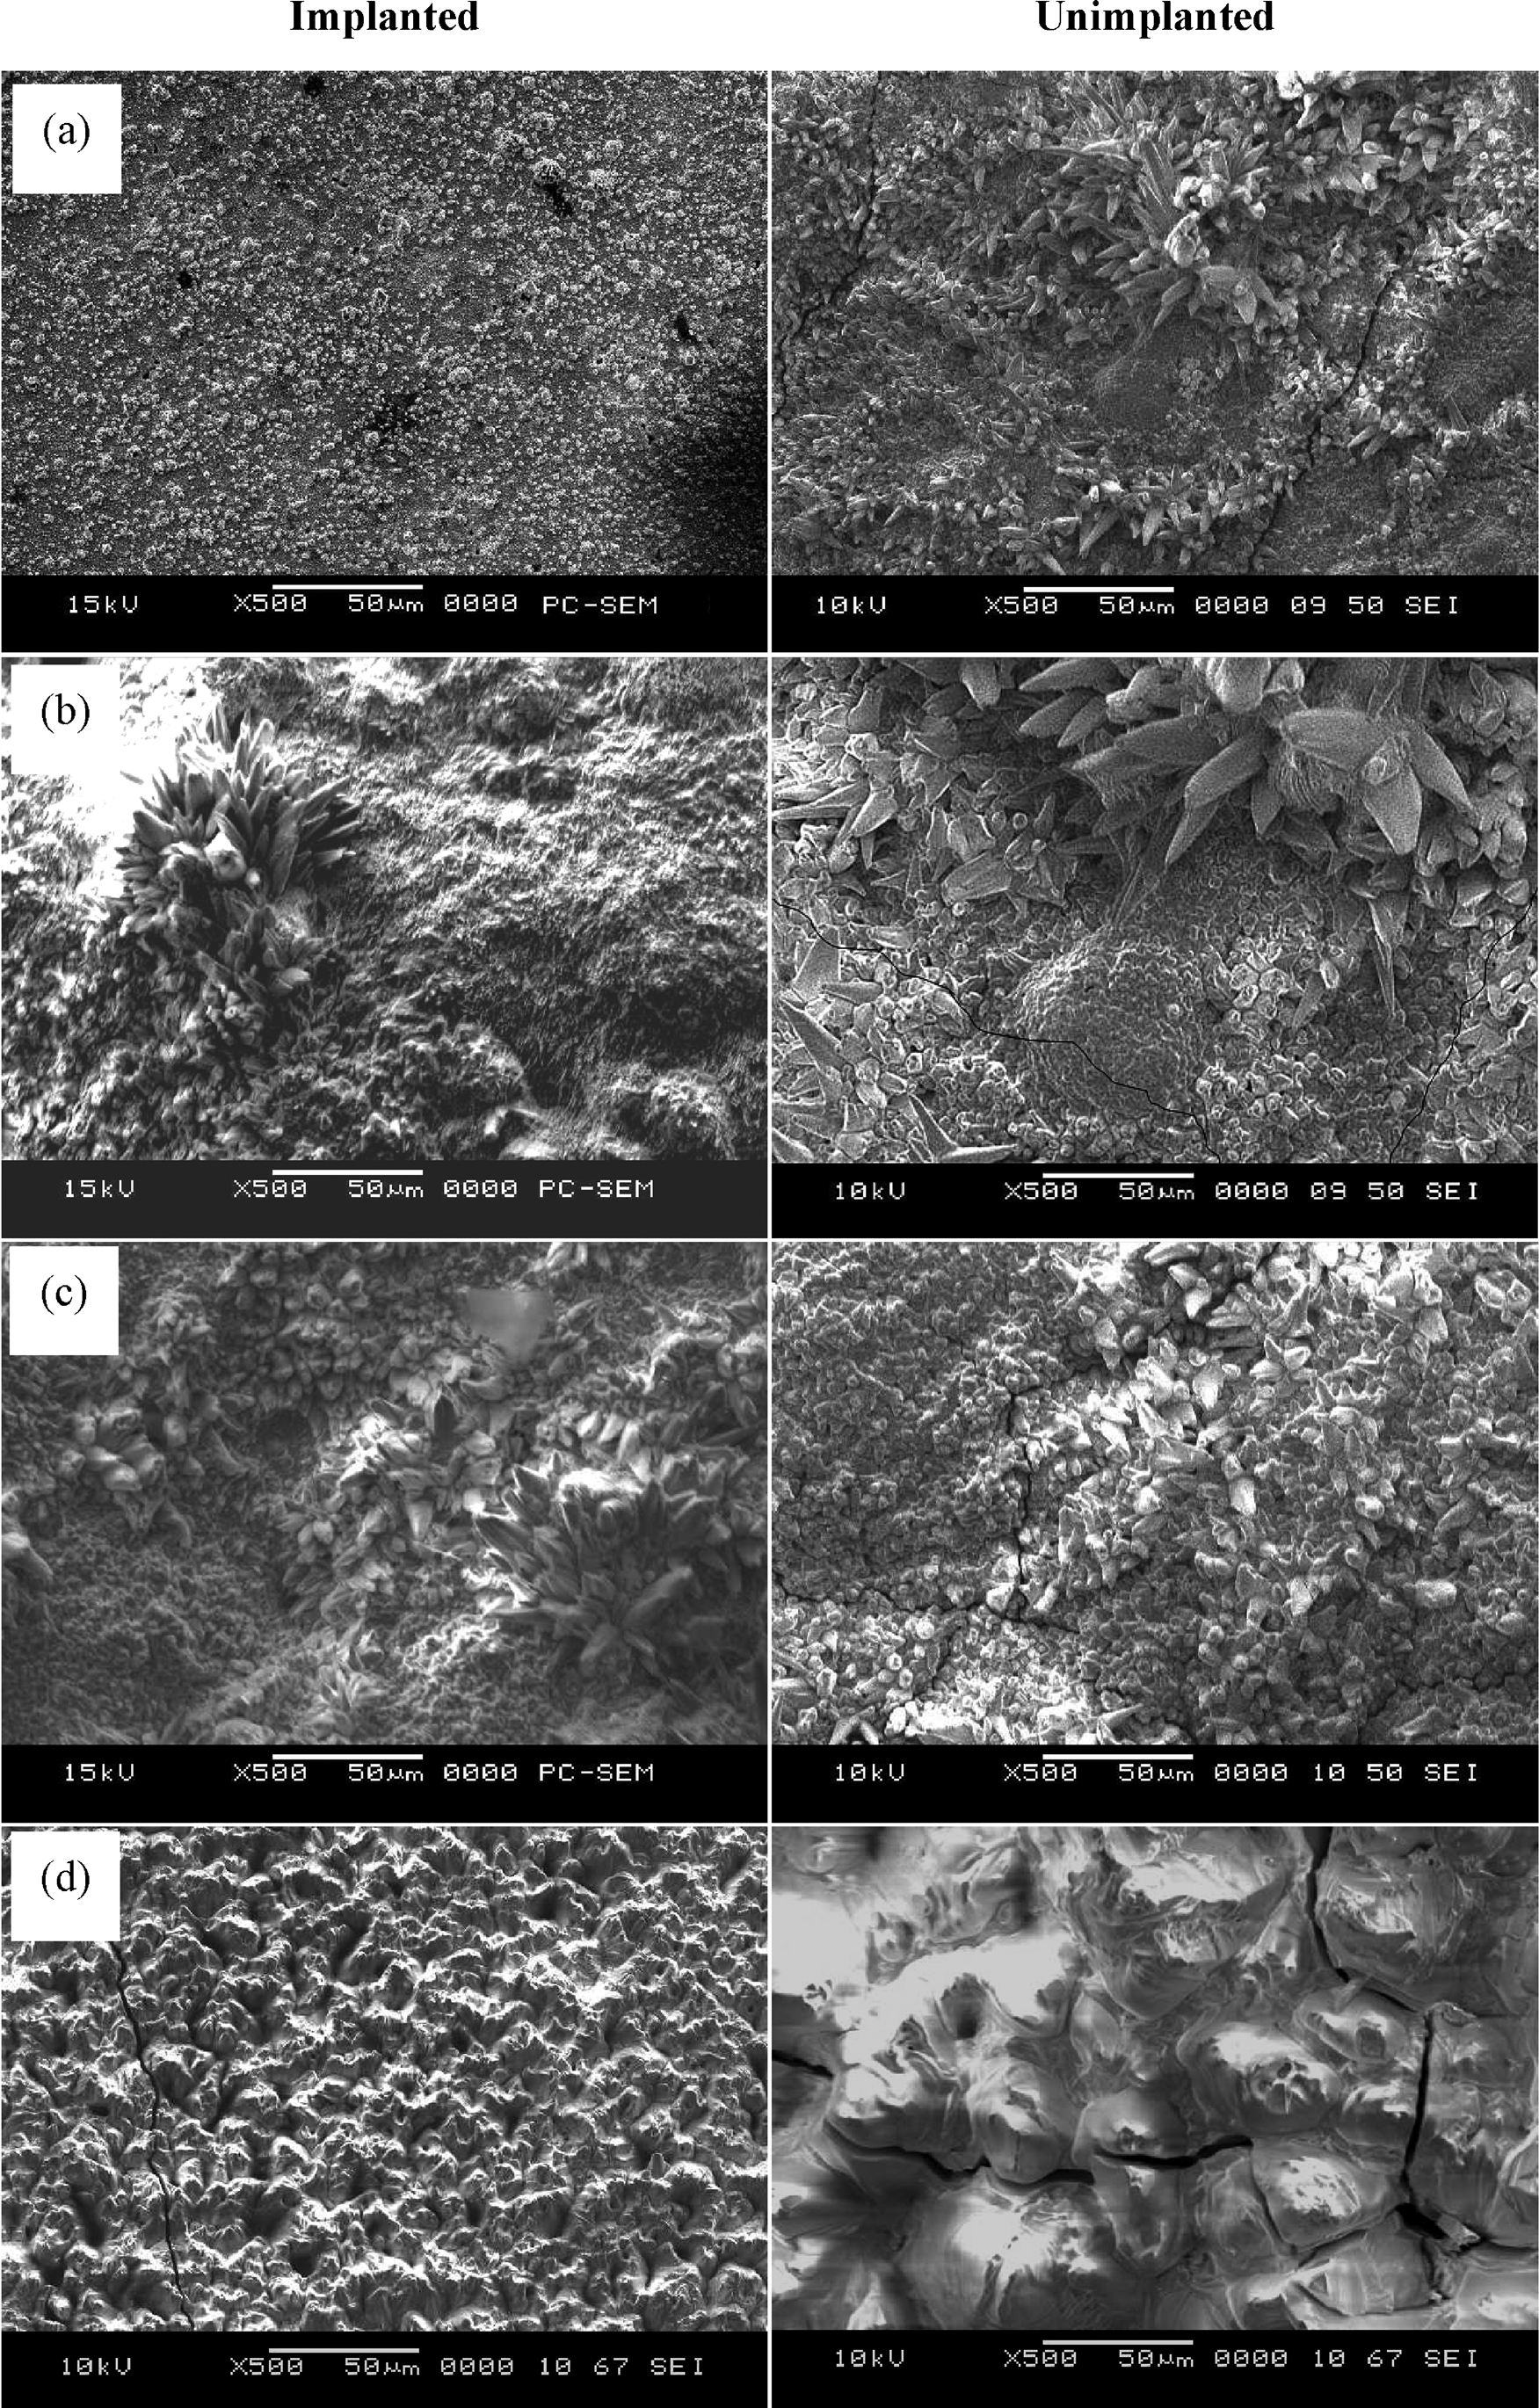
a SPS800; b SPS900; c HP1000; d commercial alloy
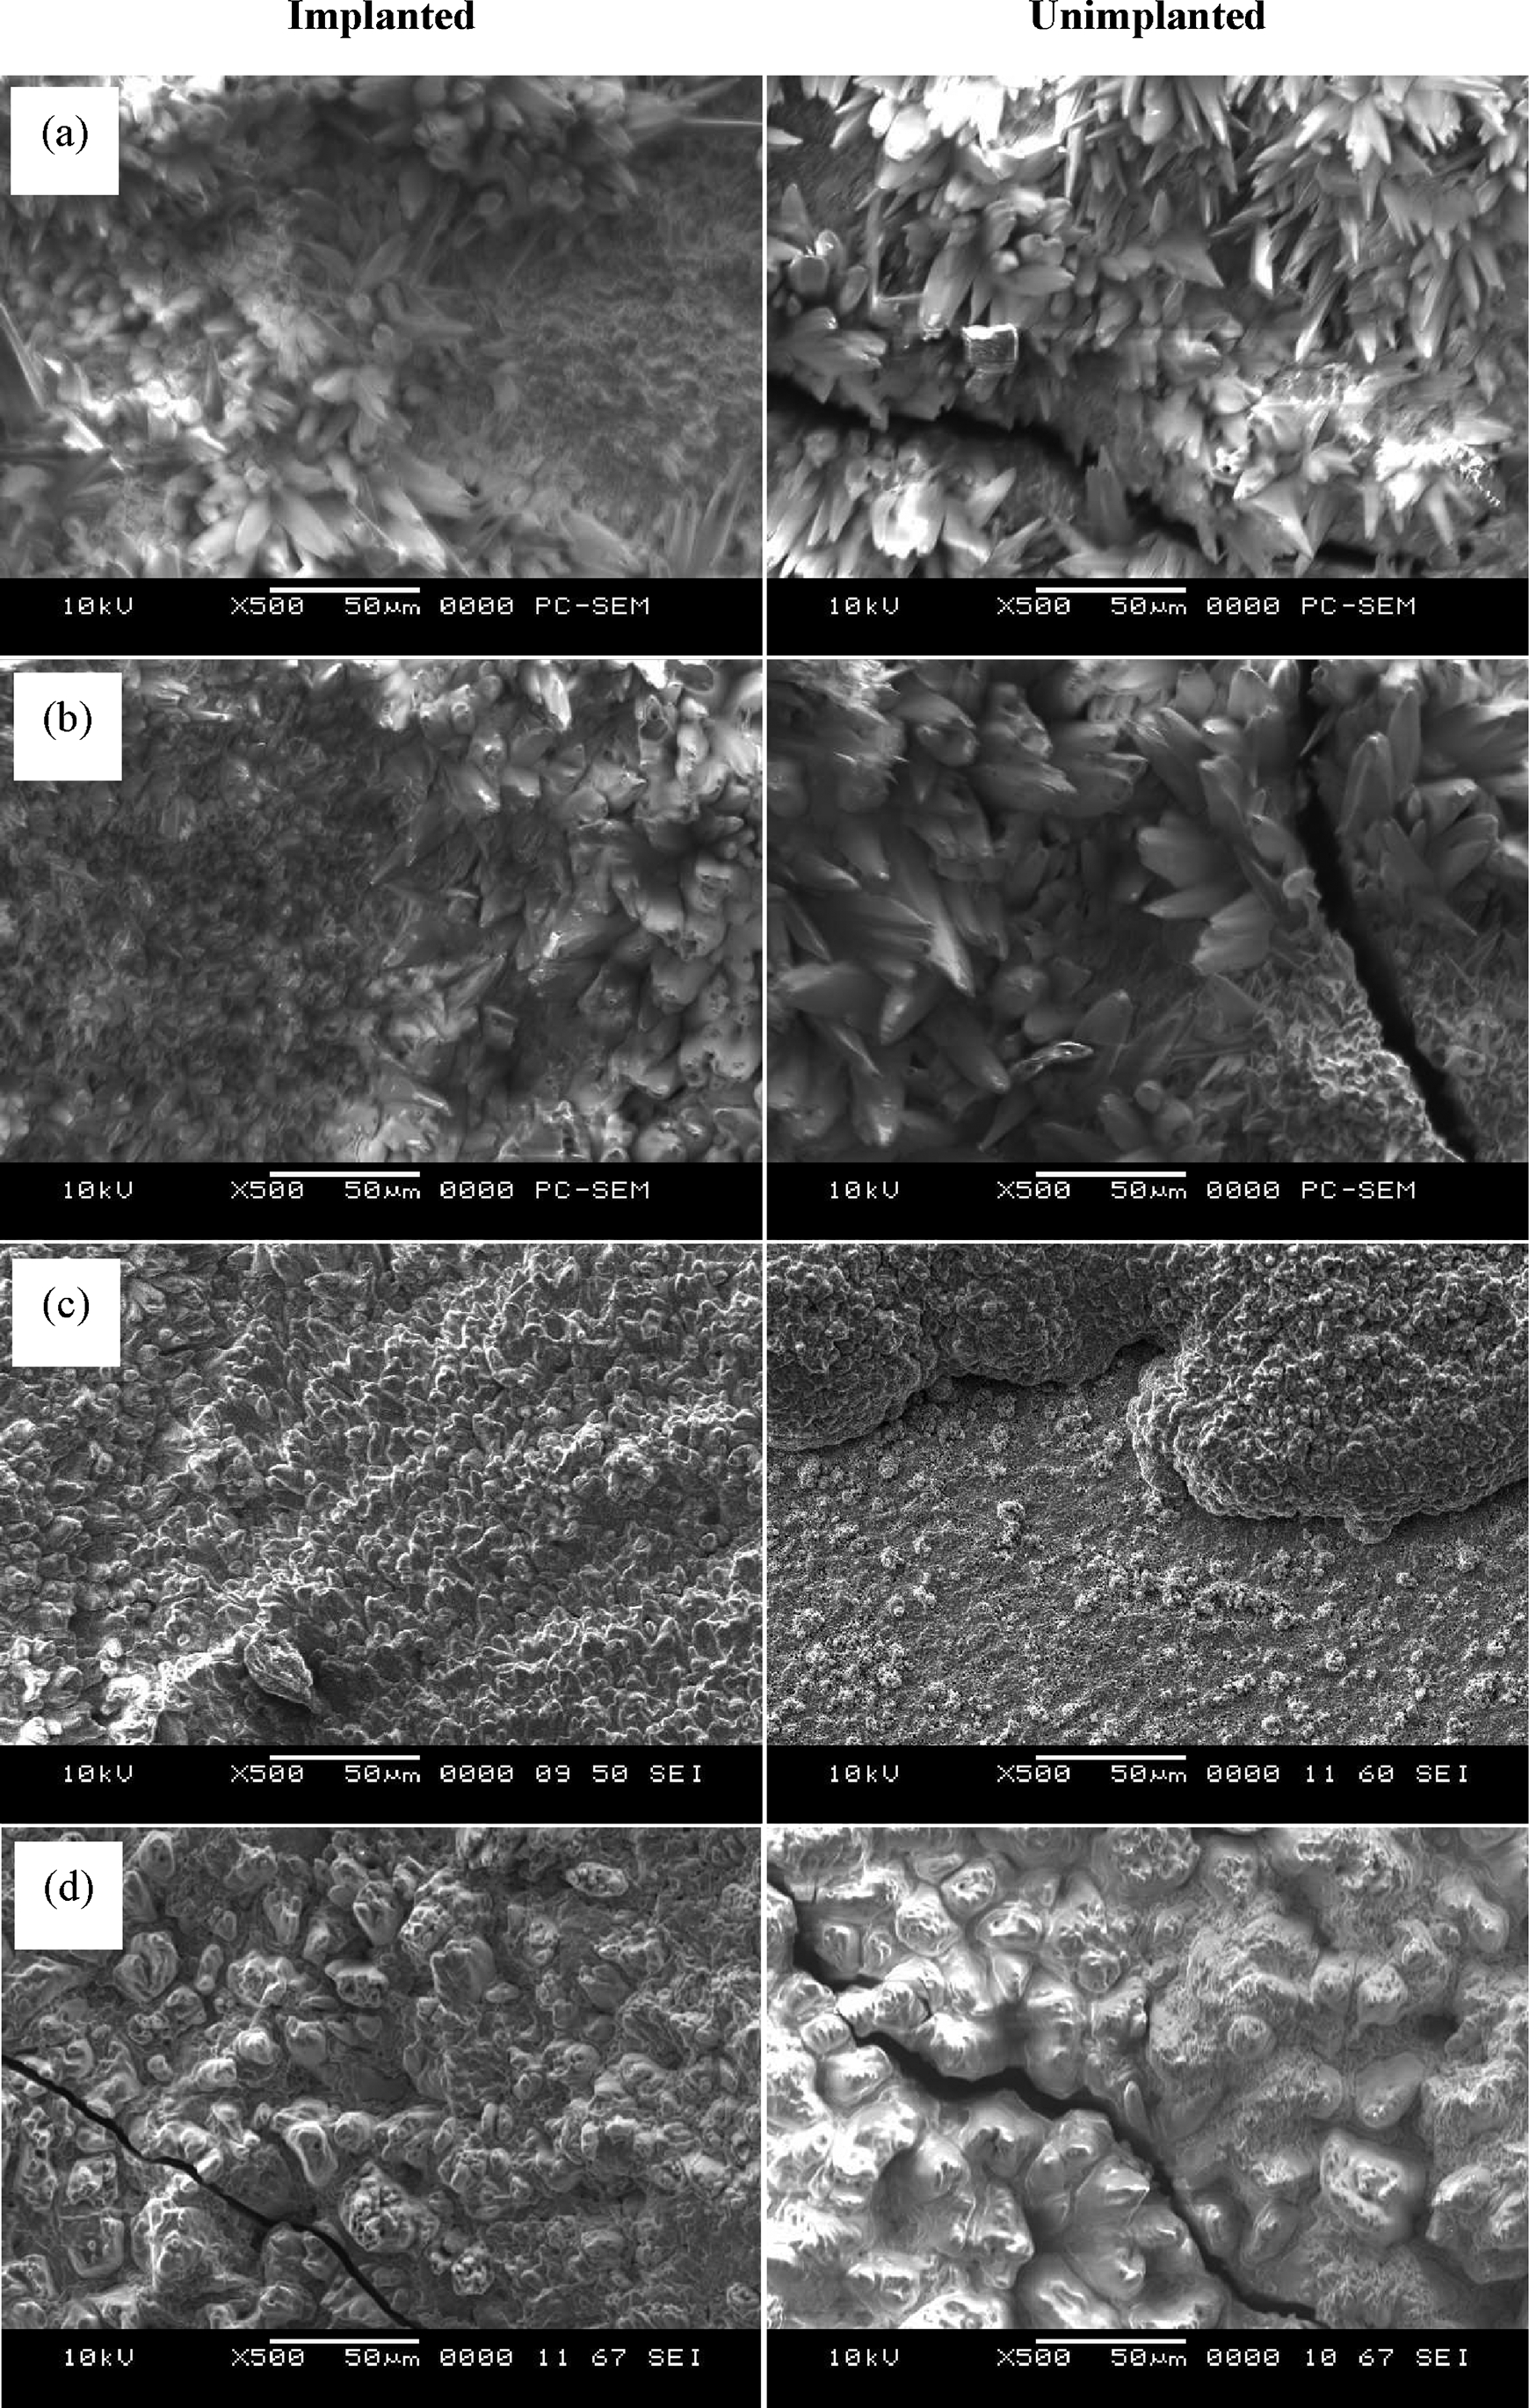
a SPS800; b SPS900; c HP1000; d commercial alloy
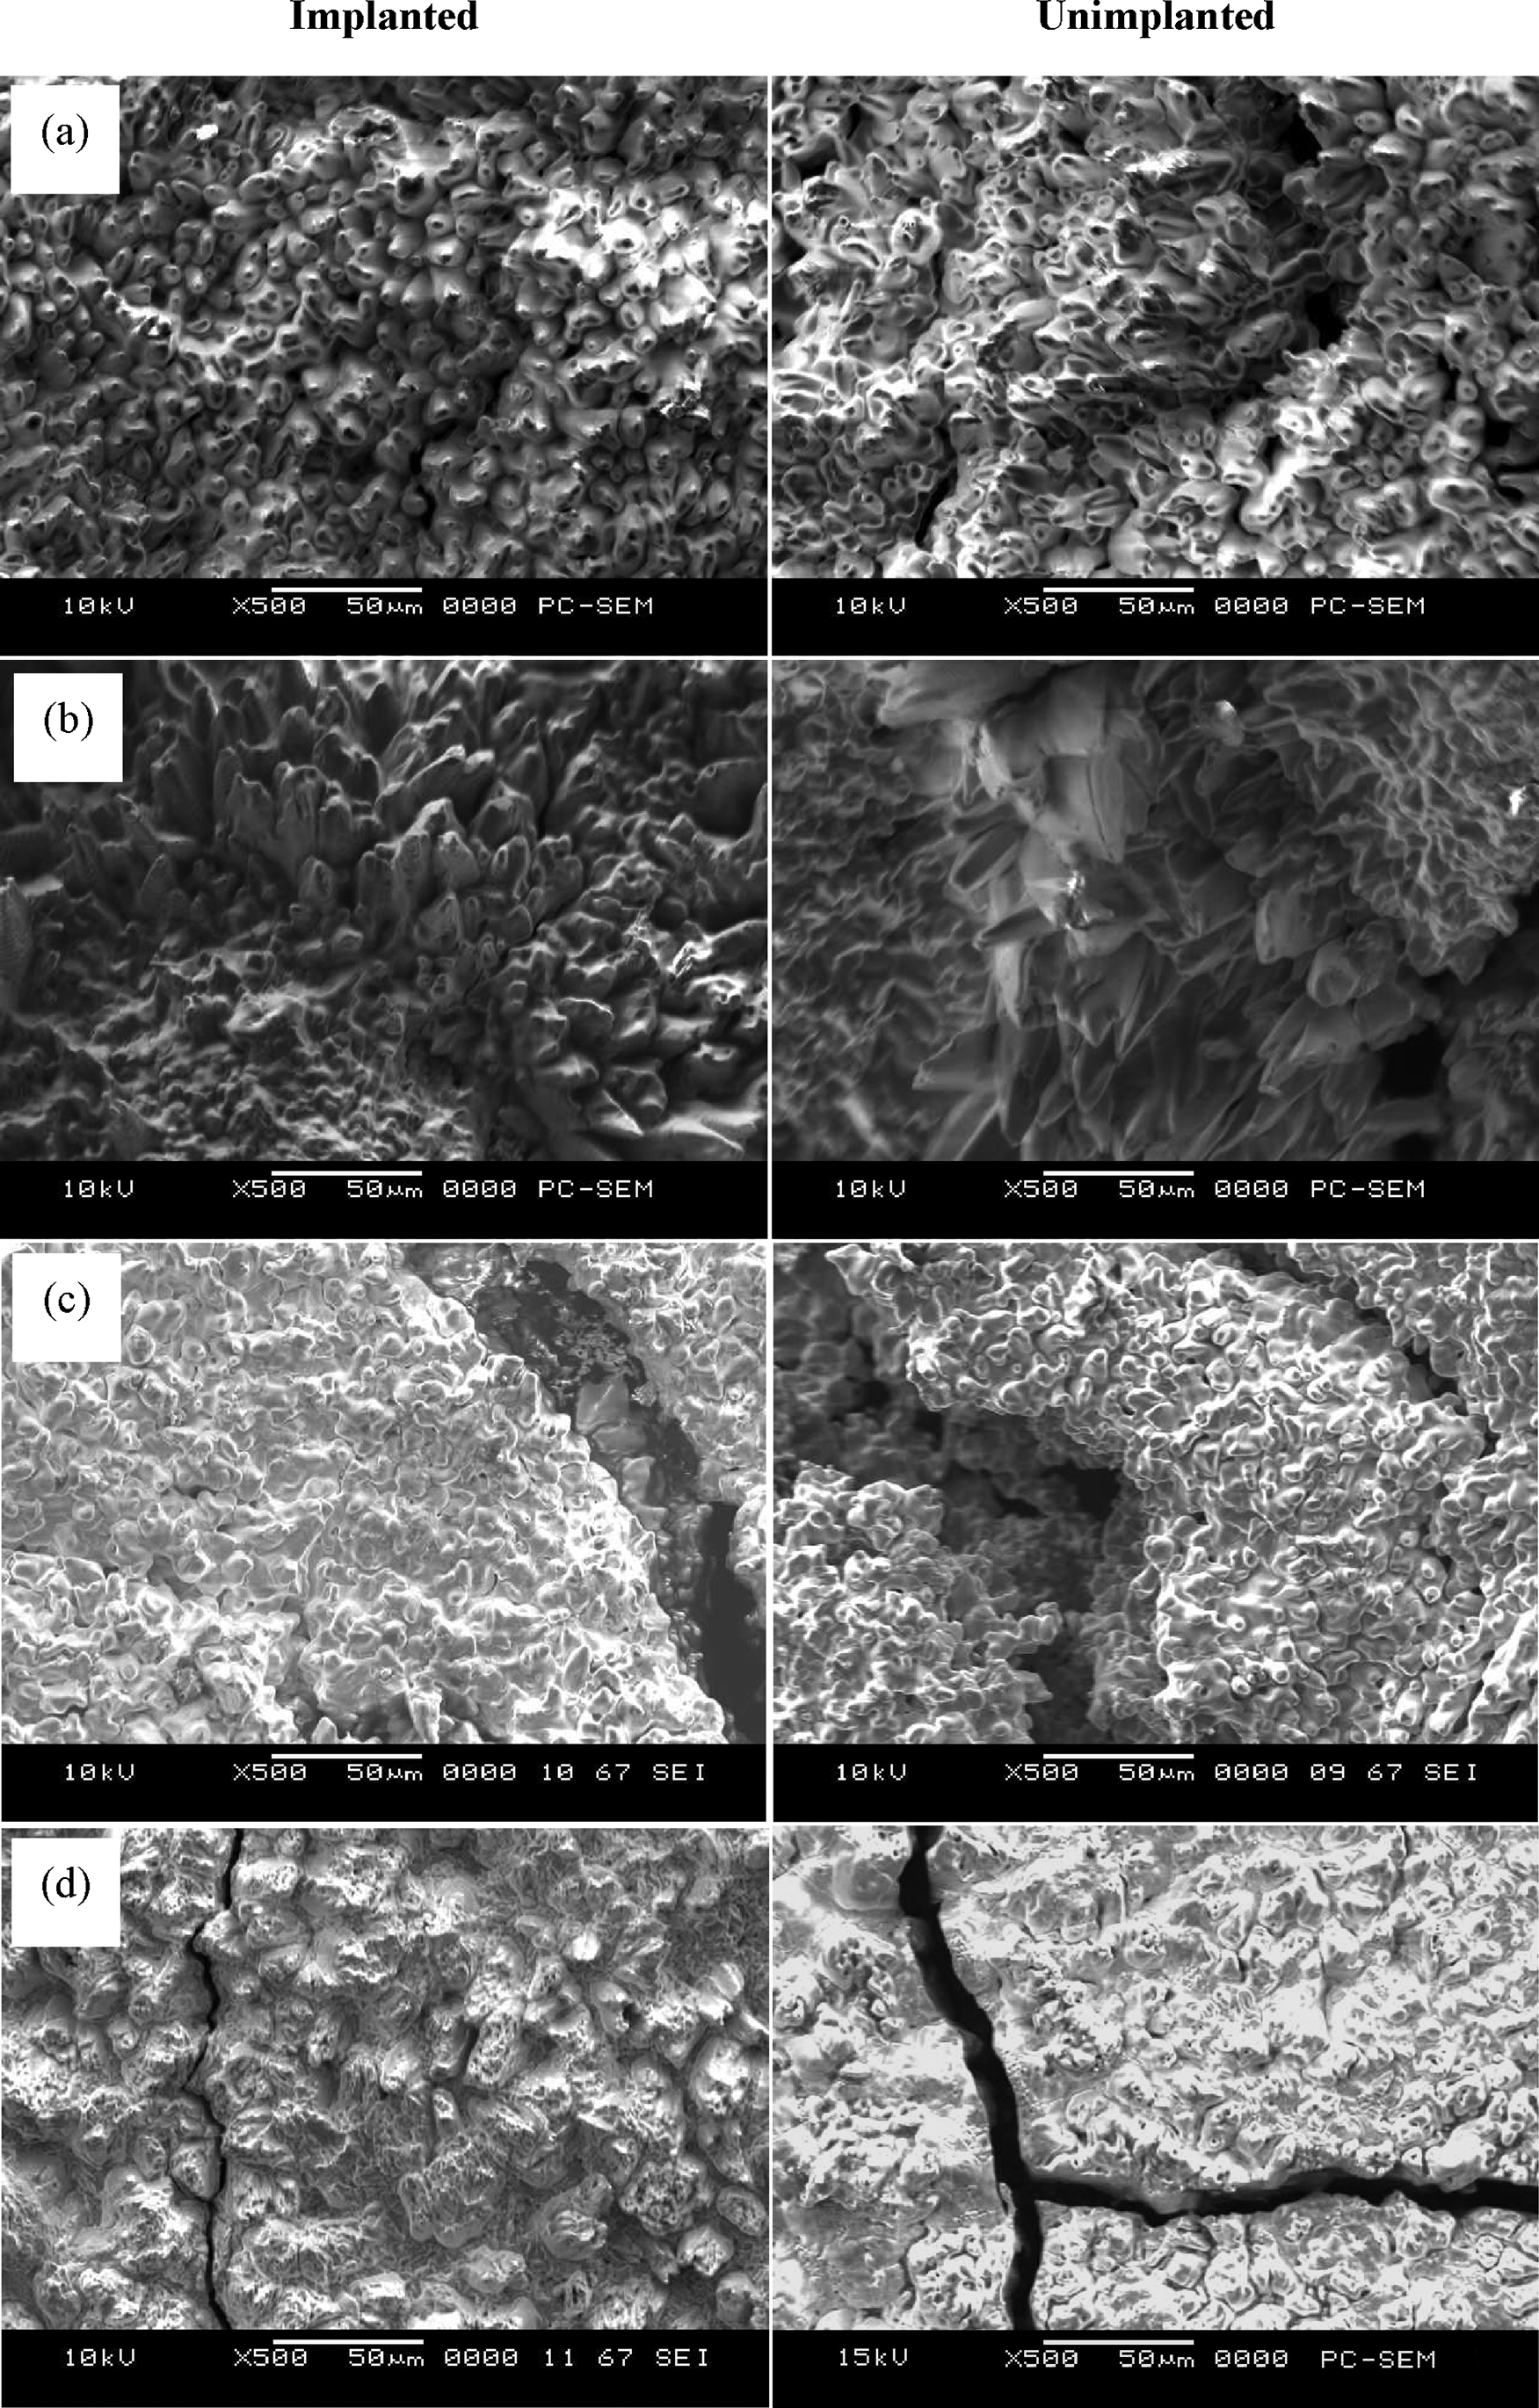
a SPS800; b SPS900; c HP1000; d commercial alloy
At 900°C, no significant cracking takes place on any of the surfaces of the implanted samples, except for the commercial alloy. The formation of an almost continuous oxide layer at the surface of the implanted samples can be appreciated, excluding for the commercial alloy. Figure 11a exhibits the surface morphology for the implanted FeCr SPS800, which looks an almost flat surface with some nodules on it. Next to it, the morphology of the oxide for unimplanted FeCr SPS800, which looks very similar to that of the implanted sample but with some decoration at some nodule and some cracks, stretched. The SEM examination also revealed obvious cracks of scales that were distinguished for the other unimplanted samples. However, no indications of spallations were observed at this oxidation temperature. As expected, the commercial alloy (Fig. 11d) exhibits a poor oxide scale with significant cracks and large grain or nodule-like oxides.
The difference morphology after oxidation at 1000 and 1100°C is shown by the SEM images in Figs. 12 and 13. The SEM examination revealed that the scales seem to be the typical nodule-like and some needle morphology. The surfaces of the oxide scales in as developed alloy consist of small oxide ridges and needle-like oxides. For the unimplanted alloy, the oxide morphology shows fractured scales (crack). The oxide scales of commercial alloy (Figs. 12d and 13d) show very different oxide morphologies from that of the as developed alloy. The surface of the scales grown in commercial alloy (implanted and unimplanted) consists of larger oxide nodules and wider gap of crack scales.
In general, the effect of different oxidation temperatures and crystallite sizes of alloy on the morphology of the outermost part of the oxide scale can be explained as follows. It is clearly shown that the morphology of the outermost oxide is changing from oxide ridges and nodule-like oxides to a morphology containing to extend and larger grains after oxidation in the air. Furthermore, most of the unimplanted samples exhibit more significant gap cracking and tend to spall seriously, particularly after oxidising at 1100°C. However, the implanted samples show better scale morphologies, except for the commercial alloy at 1000°C, and commercial alloy and FeCr HP1000 at 1100°C. Most spalled areas show a rough feature, implying that scale spallation mainly took place. The implanted FeCr SPS800 shows the best oxide scale morphology. The oxide scales formed on FeCr SPS800 (as the finest crystallite size) show superior resistance to cracking and spallation compared to the other samples.
It is reasonable to expect that temperature and nanostructure (crystallite size of alloy) would affect the kinetics of the oxide formation. The possible effects of temperature and crystallite size on the oxide morphology include the enhanced diffusion of iron/chromium and oxygen atoms through the grain boundaries and the decrease in interfacial strain due to the differences in CTEs of oxide scale and the metal substrate. At higher temperatures, both iron/chromium and oxygen atoms could diffuse quickly to form more thermodynamically, equilibrium shaped oxides. This indicates that the scale morphology to reach a specific oxide layer thickness is influenced by the variation of temperature and nanostructure of alloy. The mechanisms by which nanocrystal structures improve the scale spallation resistance are also complex. Several mechanisms can be suggested based on the experimental results. First, nanocrystal structures promote selective oxidation to form more protective oxides (chromia). Second, the segregation of lanthanum (reactive element) ions and/or fine grained oxide scales often shows a fast creep rate at high temperatures, which can release the stresses accumulated in the scales, therefore reducing the scale spallation tendency. Third, the oxides formed on nano- and submicrocrystal implantations are pegged onto the grain boundaries to form a complex interface. The so called ‘micropegging’ effect of the inward grown oxides results in better scale adhesion to the metal substrate.
According to Fernandes and Ramanathan, 33 another factor that is responsible for the oxide morphology is the reactive element. The reactive element, La in this case, induced in the oxide morphology is due to prevent (inhibit) the oxide scale from growing rapidly. In this case, the time taken to form the critical oxide (chromia) layer thickness is significantly longer. During much of this period, the scale formed is relatively thinner, more plastic and more adherent to the alloy and therefore capable to withstand stresses associated with scale growth and temperature cycling, as also confirmed by the cross-sectional SEM/EDS analysis, which is given later in this section. In general, scale cracking or spalling occurs when the stresses accumulated in the scales, reflected as the difference in CTE between the substrate and the oxide scale. The mismatch in CTE is particularly important under thermal cycling oxidation conditions.
Based on the above SEM analysis, it can be concluded that at the beginning of oxidation, a discontinuous chromia scale was formed but could not protect the alloy from internal oxidation. At the same time, Fe became enriched and diffused outwards, which caused the formation and rapid growth of Fe2O3. Blocked by Cr2O3, Fe2O3 nucleated and grew at the discontinuous areas, such as the incompact Cr2O3 scale or its microdefective areas, leading to some bulges or nodules. Then, with the outwards diffusion of Cr, (Fe,Cr)2O3 developed, which also previously showed in the XRD analyses. The oxide scale elemental compositions at specific oxidation temperature (900°C) were then further explored with the following cross-section SEM/EDS linescan analysis.
Figures 14 and 15 show the SEM cross-section and EDS linescans for the implanted and unimplanted samples after 100 h oxidation at 900°C in air. The oxide scale clearly shown formed on the surface of the substrate. At this temperature, the implanted FeCr SPS800 and HP1000 show better scale adherence, dense and thinner compared to the unimplanted one (Fig. 14). The scale adhesion and thickness of the implanted FeCr SPS900 and commercial alloy also show better compared to the unimplanted samples (Fig. 15). The unimplanted HP sample (HP1000) shows significantly thicker oxide scale compared to the SPS sample (SPS800 and SPS900). It also shows a significantly porous oxide scale, as depicted in Fig. 14b. The cross-section of the unimplanted commercial alloy shows significant thick scale and porous and poorly bonded substrate/scale compared to as developed sample, as depicted in Fig. 15b. Some pores were randomly detected within the scale. Its scale is clearly divided into two regions: the outer layer is more porous than the inner layer. However, the implanted commercial alloy shows better oxide morphology than the unimplanted one. The scale thickness of the commercial alloy is approximately five times of the as developed FeCr, as confirmed by its mass gain curves.
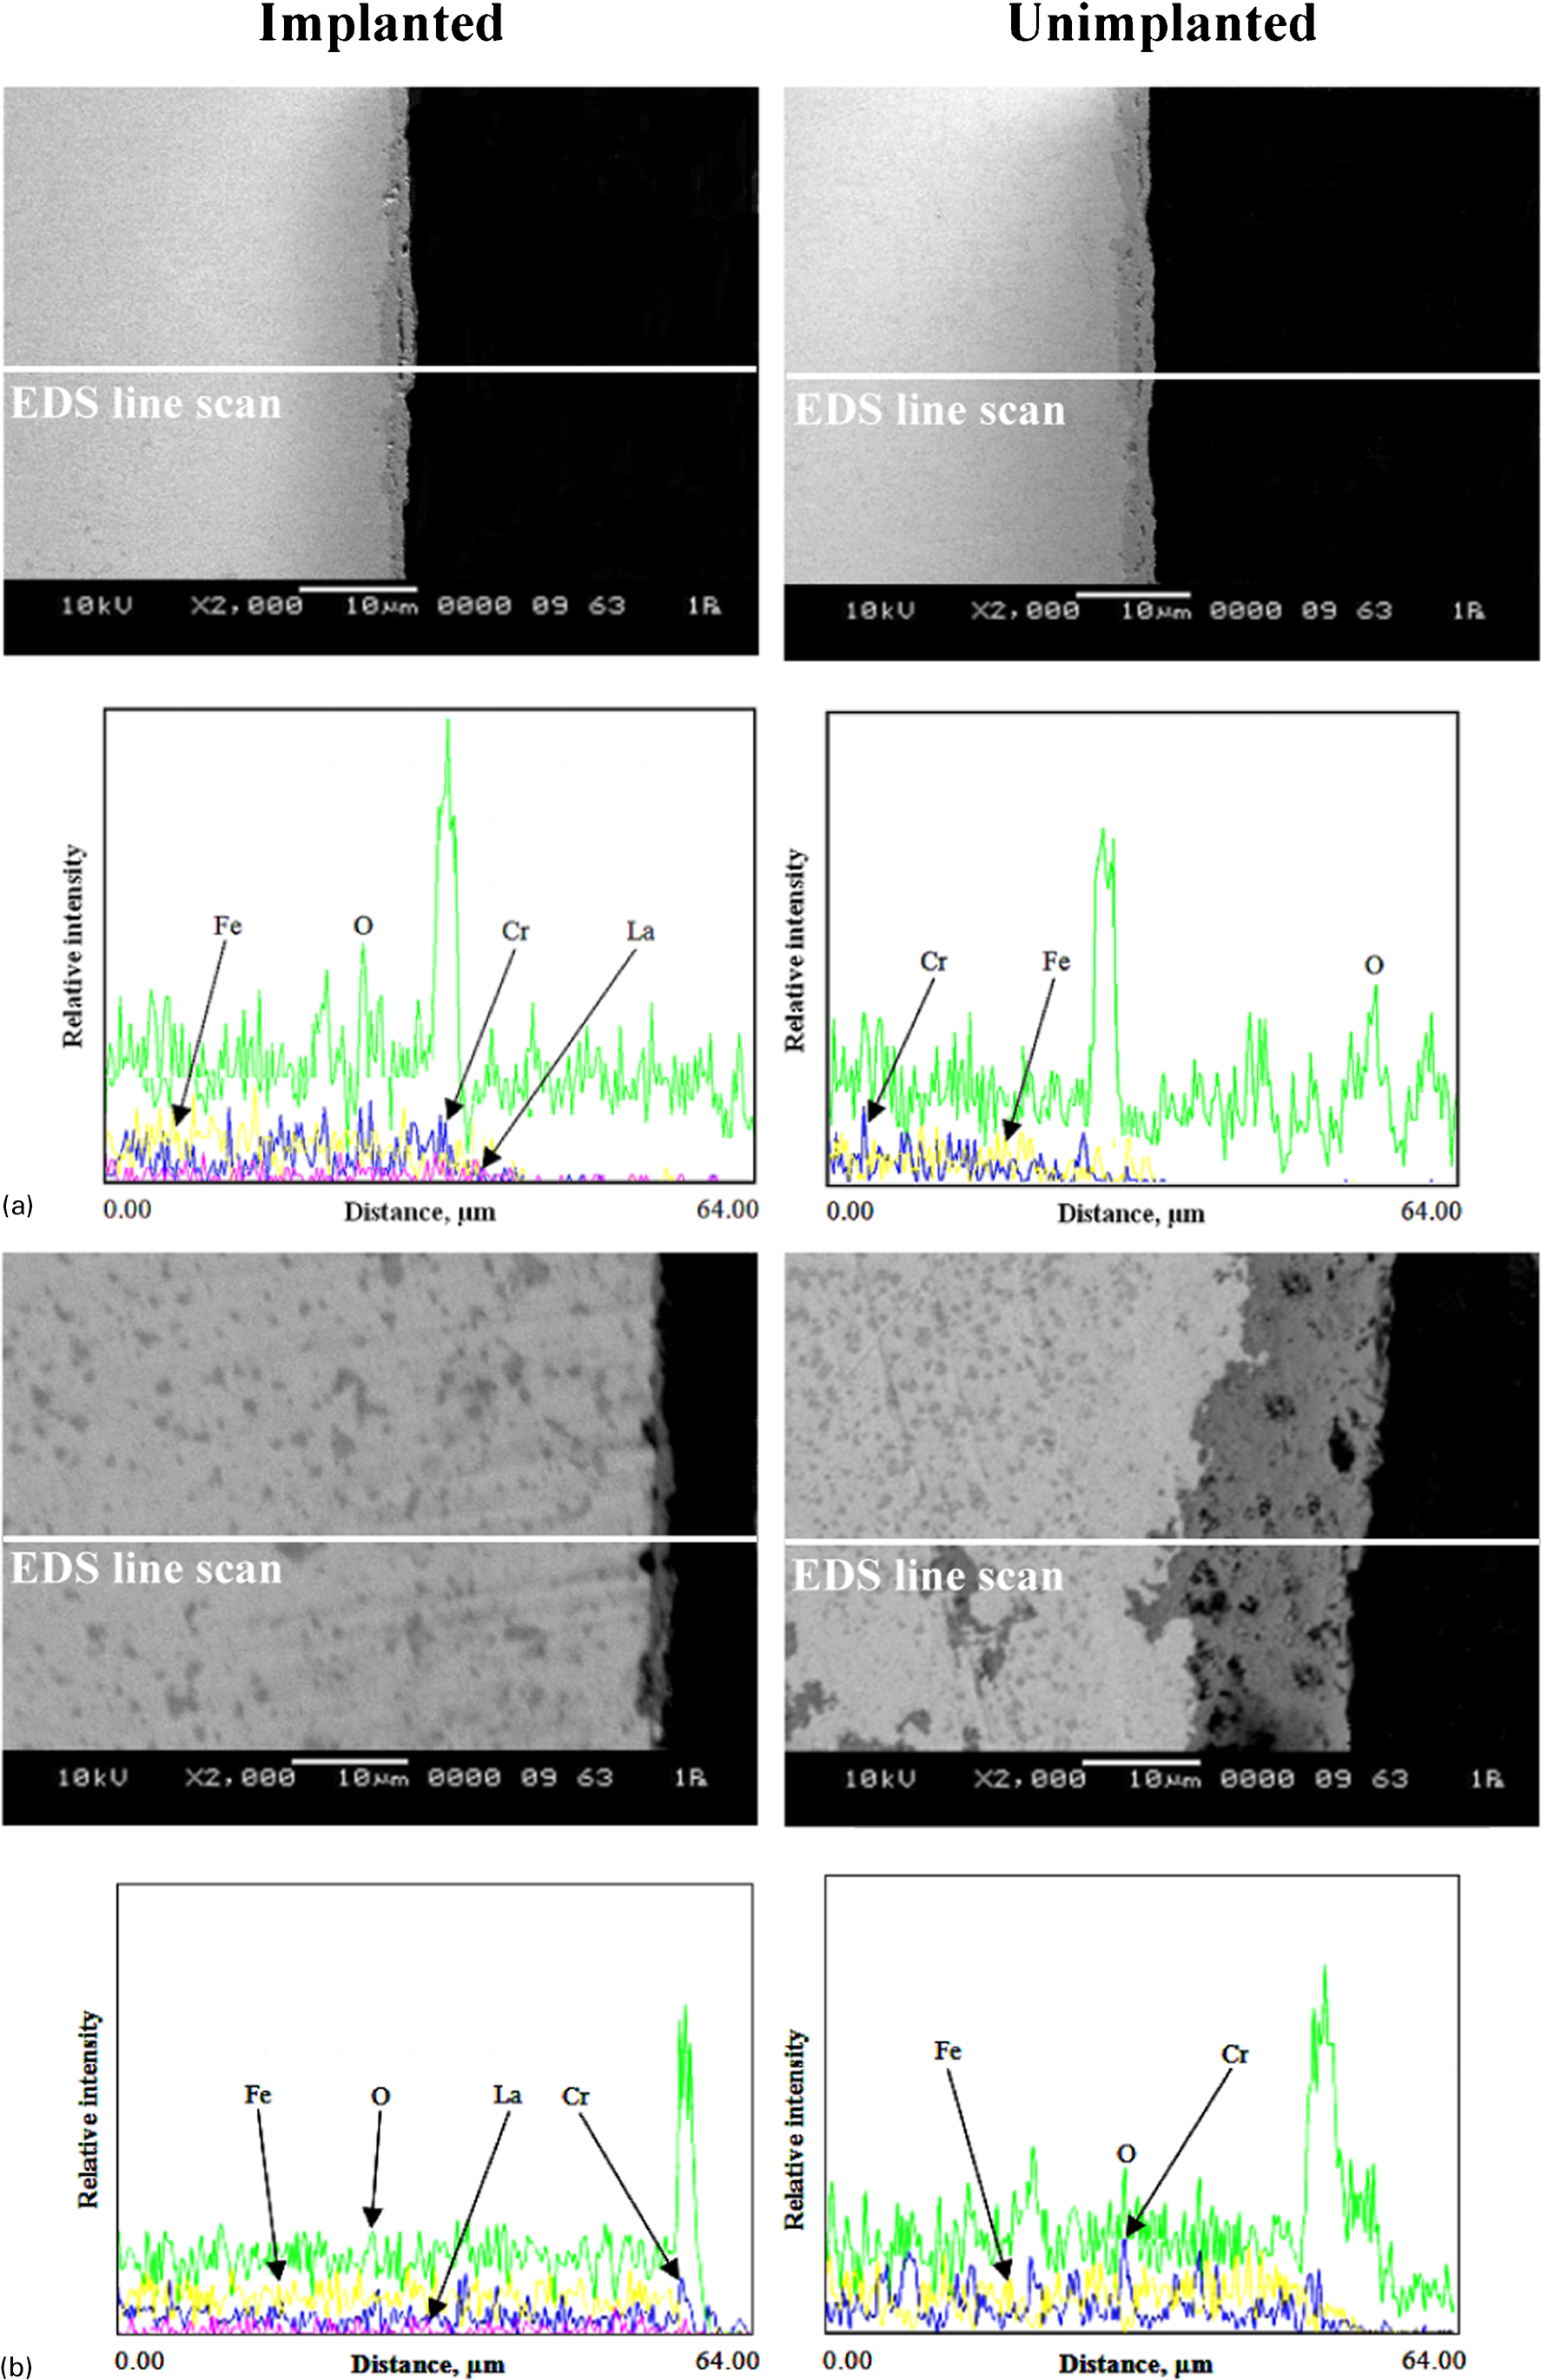
Cross-section (SEM) and EDS linescan of elements for implanted and unimplanted a SPS800 and b HP1000 alloy specimens after 100 h oxidation at 900°C
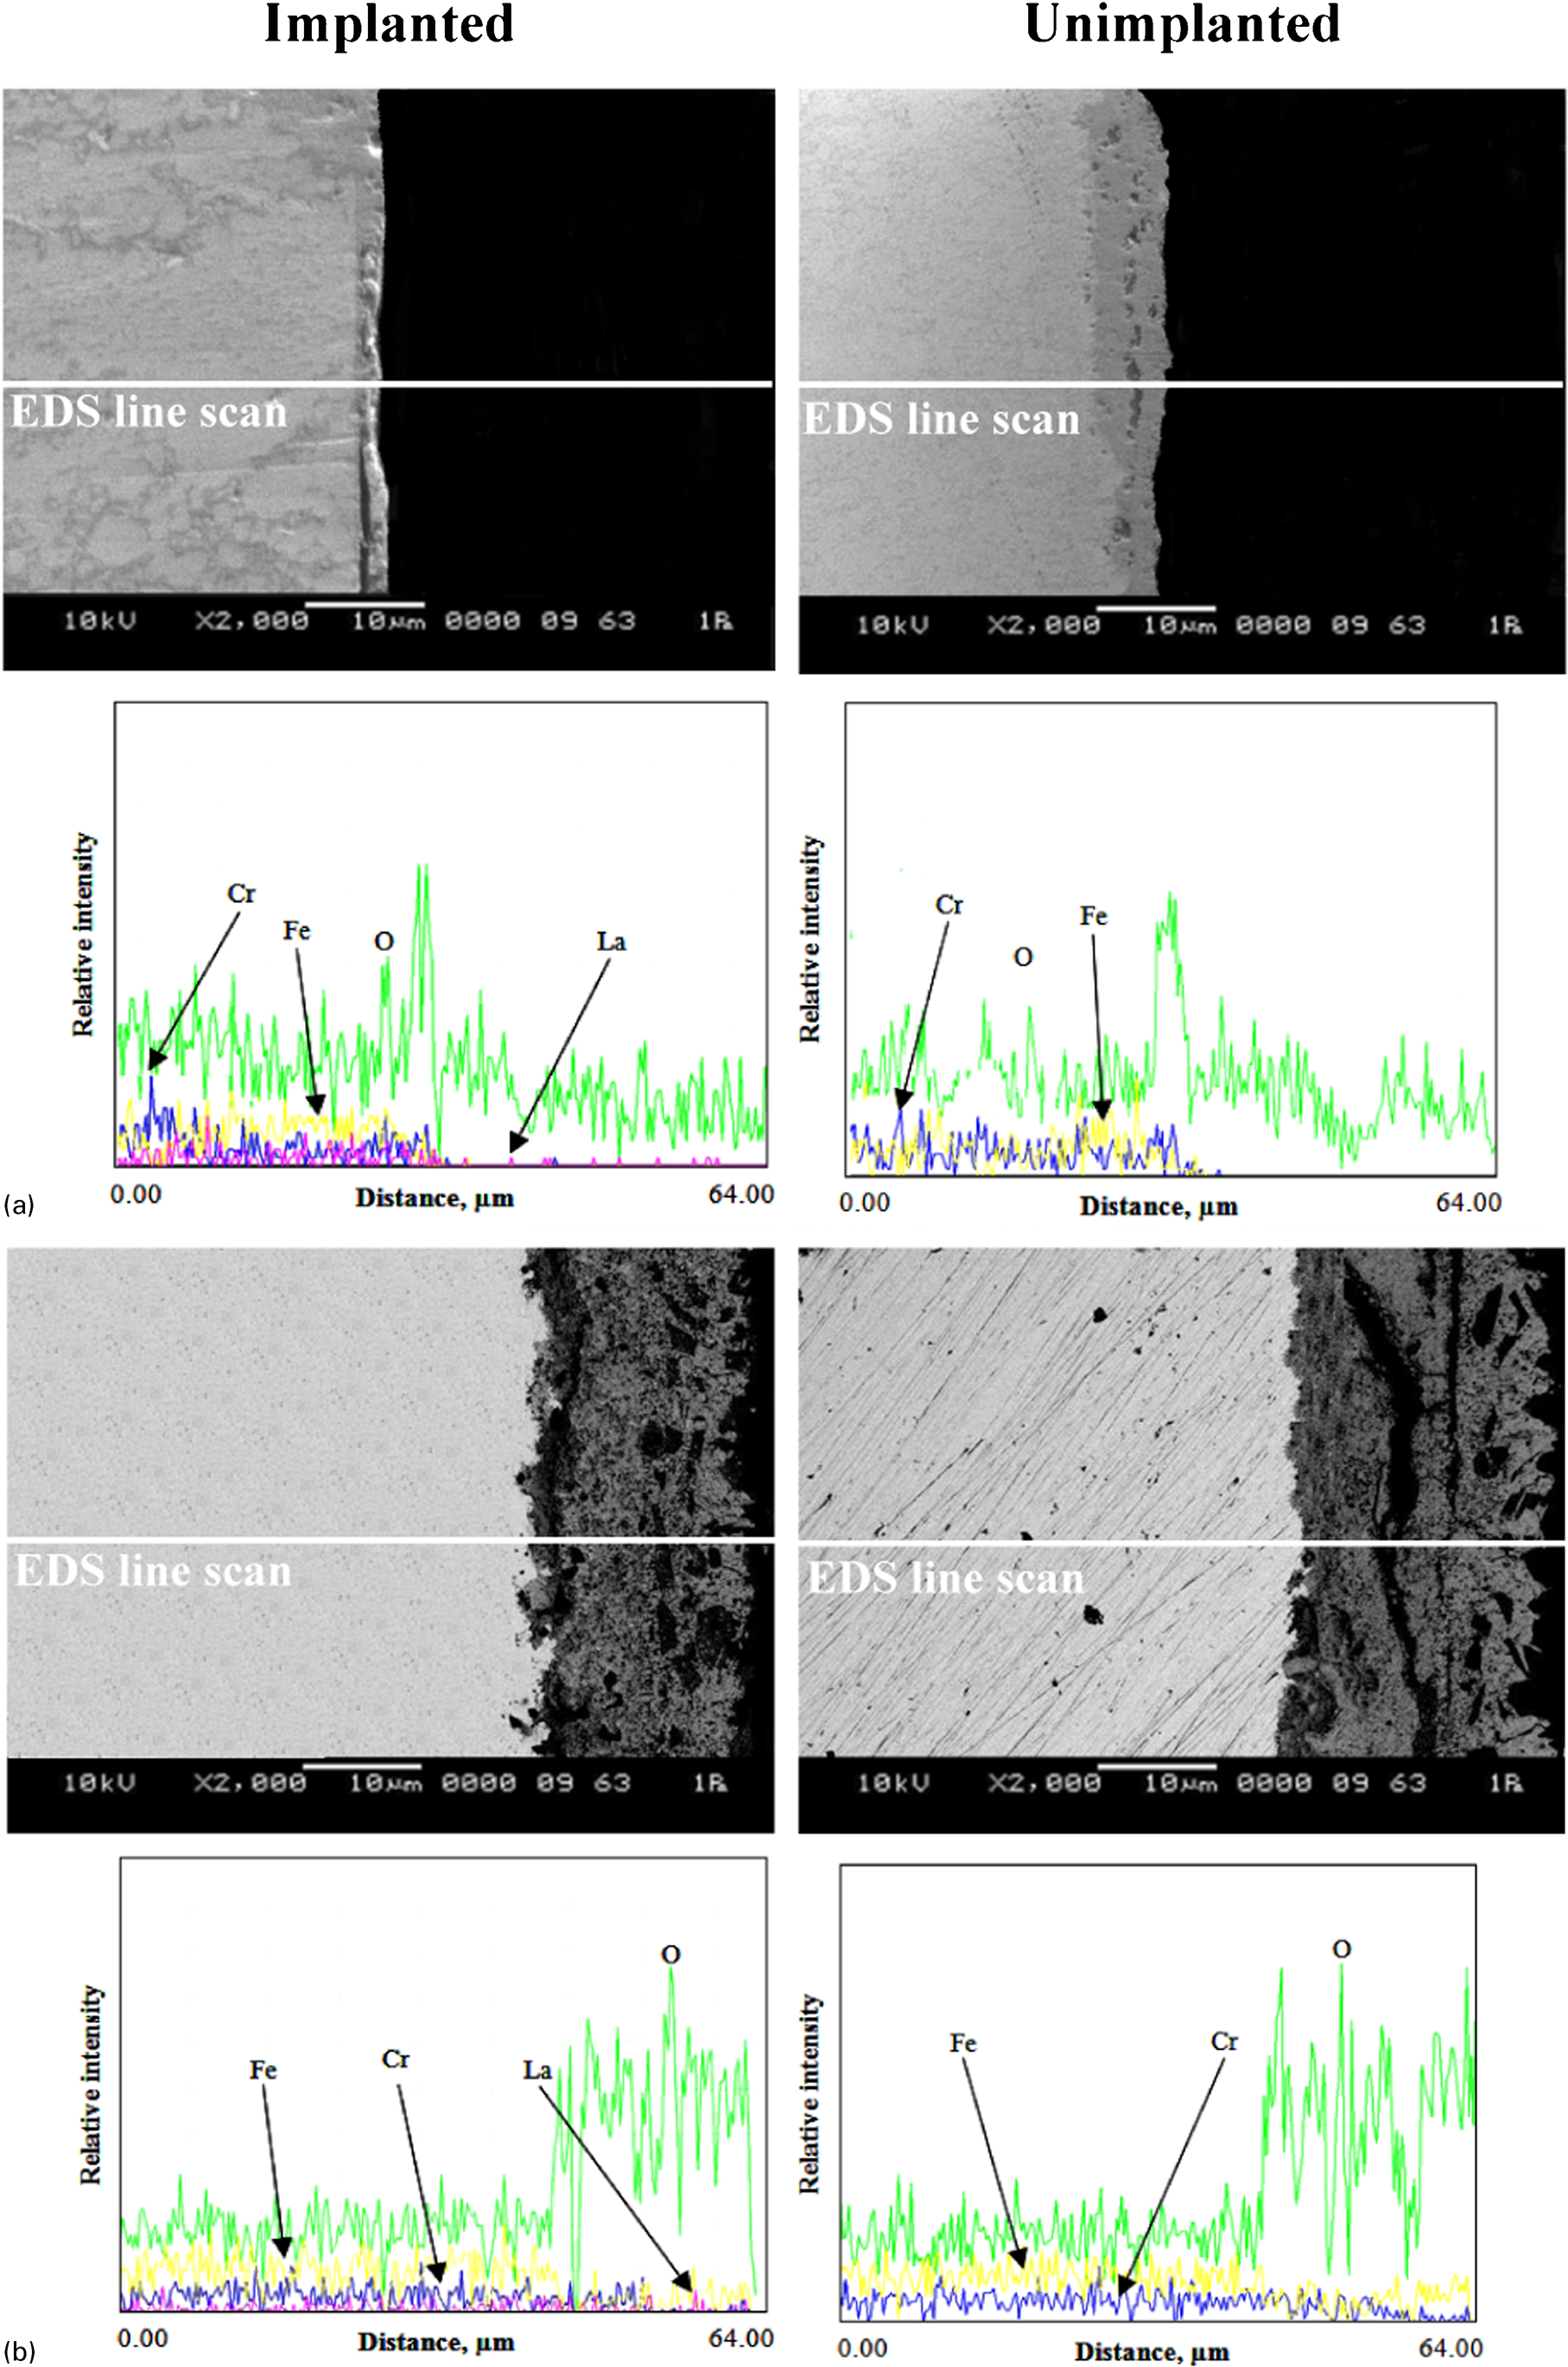
Cross-section (SEM) and EDS linescan of elements for implanted and unimplanted a SPS900 and b commercial alloy specimens after 100 h oxidation at 900°C
Scale spallation generally occurs at the commercial alloy. The parabolic rate constant also confirmed the highest value, as evidenced by its very thick oxide scale. Fontana et al. 34 showed that the beneficial effect of the reactive elements in chromia forming alloys was due to the segregation of reactive elements at chromia grain boundaries. Obviously, the La implanted samples exhibit a relative dense and continuous scale with a relatively strong adhesion to the substrate. In the case of commercial alloy probably insufficient for the segregation of the reactive elements at the chromia grain boundaries, the structures promote selective oxidation to form more protective oxides (chromia) and then improves the oxidation resistance.
Conclusions
The sintering technique using the SPS method had clearly given major beneficial effect in controlling the microstructure of alloys. The higher density in the consolidated FeCr with SPS can be achieved at comparatively lower temperatures compared to the hot pressed alloy. The reactive element addition of La into the investigated alloy, as developed FeCr and as received commercial alloy, had clearly given a beneficial effect in improving the sample microstructure and thermal stability in high temperature. The addition of La as a reactive element had shown a significant improvement of the oxidation resistance to the blank alloy when oxidised at 900-1100°C. However, the addition of a reactive element has no significant effect in the thermal expansion behaviour of FeCr and commercial alloys at high temperatures. Microstructural examination of the La implanted alloys reveals a denser, thinner scale and a stronger scale/metal interface than those of the unimplanted alloys. The formation of a protective oxide layer at the scale/substrate interface was observed, as confirmed by the SEM/EDS analysis of the oxidised cross-section samples. It was demonstrated that the crystallite size of the alloy has a significant effect in improving the high thermal stability of alloy. In this work, the optimum way of developing FeCr alloys for high temperature application is achieved by SPS at 800°C and followed with surface treatment via ion implantation. It expected to be relevant and applicable to the development of SOFC technologies. Additional development work is needed to improve the stable phase content in the scale to enhance the stability further. Successful completion of these tasks will play a major role in enabling the SOFC system as a commercial reality.
Footnotes
Acknowledgements
This project was supported by the Ministry of Higher Education – Malaysia under the FRGS Grant Scheme with contract nos. VOT.0361 and VOT.0759.