
Abstract
This paper presents the potential use of electrochemical impedance spectroscopy (EIS) for the electrochemical study of stainless steel behaviour under different constant loads and for the detection and characterisation of stress corrosion cracking (SCC). The test specimens were made from sensitised stainless steel of type 304 and were immersed in 0·5M aqueous solution of sodium thiosulphate. The specimens were subjected to constant load tests. Different load levels were applied in order to provoke and evaluate different experimental conditions. The results of EIS measurements clearly showed that the initial polarisation resistance is inversely proportional to the increasing load level. The polarisation resistance also changes with time. Although EIS is generally used for the characterisation of stationary processes, basic electrochemical parameters indicated temporal breaks of the passive film. It was confirmed that under stress, these damages can initiate SCC. It can therefore be concluded that EIS can be used as a supplementary technique for monitoring the initial phases of intergranular SCC.
Introduction
It is known that stress corrosion cracking (SCC) is a complex process that causes initiation and propagation of cracks due to the combined action of mechanical stress and corrosion reactions. The synergistic sum of these actions can result in unexpected failures of vital structural elements.1–3 The SCC is an especially dangerous process of degradation for highly corrosion resistant materials such as aluminium alloys and stainless steels. Since these materials are generally used in construction, automotive, aircraft and especially the nuclear power plant industry,4–7 it is essential to improve existing knowledge, procedures and techniques for the detection and characterisation of SCC. Only the successful detection of SCC in its early stages would eliminate the risk for potential failure and significantly reduce the cost of necessary periodic inspections.
Nowadays, several monitoring techniques for SCC detection are available and have been more or less successfully implemented in laboratory studies, including8–12 electrochemical noise (EN), direct current potential drop and acoustic emission (AE). An additional technique that is potentially viable for in situ monitoring is electrochemical impedance spectroscopy (EIS), which requires minimal disturbance of the system being studied. It is often used in the field of coating evaluation, studying corrosion inhibition efficiency and mechanistic studies. 13 The authors are aware that EIS should be used only for stationary conditions. The SCC is inherently a non-stationary process, but in shorter time intervals, the corroding system can obey the rules of causality, linearity and stability. In cases where impedance is finite valued, the impedance data converse correctly. In the present study, the viability of employing EIS as an additional laboratory in situ SCC monitoring technique has been evaluated.
A number of studies have already implemented EIS in SCC research. One study 14 reported the behaviour of stainless steel under different load levels, and it was concluded that changes in impedance correlated well with changes in corrosion potential, and it was found that such correlation was the greatest at lower frequencies. Another study proposed that phase angle at certain frequencies could be used as an indicator for the initiation of SCC, 15 while other researchers compared EIS results for loaded and unloaded specimens, indicating that a change in phase shift between loaded and unloaded specimens could be related to SCC. 16 Dynamic EIS has also been used to investigate passive layer cracking and its relation to SCC.17,18 Different parameters of the proposed model were compared and related to degradation processes. It was concluded that dynamic EIS could be a useful tool for SCC research.
This present work is a continuation of our previous research on detection and characterisation of SCC by different measuring methods, such as EN, AE, elongation measurement and digital image correlation.10–12 The potential use of EIS for the electrochemical study of stainless steel behaviour under different constant loads is described. The possible detection of SCC received considerable attention.
Experimental
Austenitic stainless steel of type AISI 304 with a carbon content of 0·042 wt-% was used in the present study. To enhance susceptibility to intergranular SCC (IGSCC), the material was solution annealed at 1050°C for 1 h and quenched in oil, followed by sensitisation treatment at 650°C for 24 h and air cooled to room temperature. After sensitisation treatment, the microstructure was austenitic with no dominant grain orientation. Carbide precipitation was confirmed at the grain boundaries. The mean grain size was estimated to be 9 according to ASTM E1382 standard. 19 Yield stress and ultimate tensile strength of the material were estimated by tensile test to be 230 and 650 MPa respectively.
Flat specimens were made from 2 mm thick plate and cut to 12 mm in width and 280 mm in length. The specimen gauge section was a semicircular notch of 8 mm radius located at the midpoint of the specimen length, reducing the gauge section width to 4 mm. The surface was ground with 600 grit SiC paper. In order to minimise the surface area exposed to the test environment, only one side of the gauge section was exposed to the electrolyte, and the specimens were protected with paint and insulating tape, leaving an exposed surface area of 60 mm2. The exposed surface was ground with 600 grit SiC paper. Specimens were sealed in a corrosion cell and exposed to ∼350 cm3 of 0·5M sodium thiosulphate (Na2S2O3) solution at room temperature. The pH of the test environment was 6·8. Tests were performed with a static mechanical loading machine, which had no electric control at the following constant load levels: 0, 100, 150, 200 and 250 kg.
The EIS measurements were performed using a three-electrode set-up. A saturated calomel electrode was used as the reference electrode, a graphite rod as the counter electrode and the test specimen as the working electrode. A Gamry 600 potentiostat/galvanostat, expanded with a Gamry Instruments framework module for EIS measurements, was used. Measurements were conducted in the frequency range 65 kHz to 5 mHz by 10 points per decade. The amplitude of the voltage perturbation was 10 mVrms. All experiments were performed at open circuit potential, at different times after immersion (start of the experiment), in a sequence of ∼1, 2, 4, 8, 12 and 24 h. Exact times were calculated by taking into account the duration of the EIS measurement.
In order to detect and evaluate surface damage (i.e. SCC) on the specimen gauge section during exposure, the gauge section was monitored by a digital camera connected to an optical system with a zoom. Monitoring was performed at the rate of one image per minute. Detailed characterisations of the specimen gauge section and fracture surfaces were performed after each experiment with a scanning electron microscope (SEM).
Results and discussion
All the performed experiments with the assigned load levels and the outcome results after 24 h of exposure are shown in Table 1. In the last column of Table 1, there is an indication for all the experiments that will be presented more in detail.
Summary of performed experiments
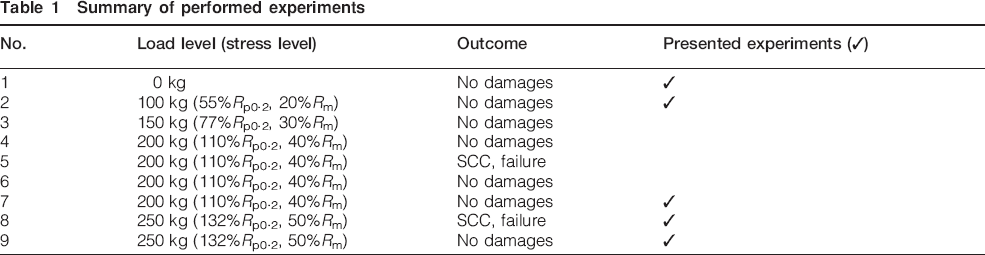
The EIS response for 304 stainless steel tested in sodium thiosulphate solution at two different constant loads is presented in Fig. 1. The data in Fig. 1a show the EIS response for the specimen loaded to 100 kg (55%R p0·2). The EIS results shown in Fig. 1b are for experiment no. 7 (Table 1), where the specimen was loaded to 200 kg (110%R p0·2). The results show that the impedance response in general decreases slowly with time for specimens loaded below yield. However, the impedance response is found to increase with time for the specimens loaded above yield. For all specimens where SCC has not been observed and consequently no failure occurred, it was observed that the polarisation resistance decreases with time if the load (stress applied to specimen) is smaller than the yield and increases with time if the load is higher than the yield.
a load level at 55%R p0·2; b load level at 110%R p0·2 (experiment no. 7, Table 1)
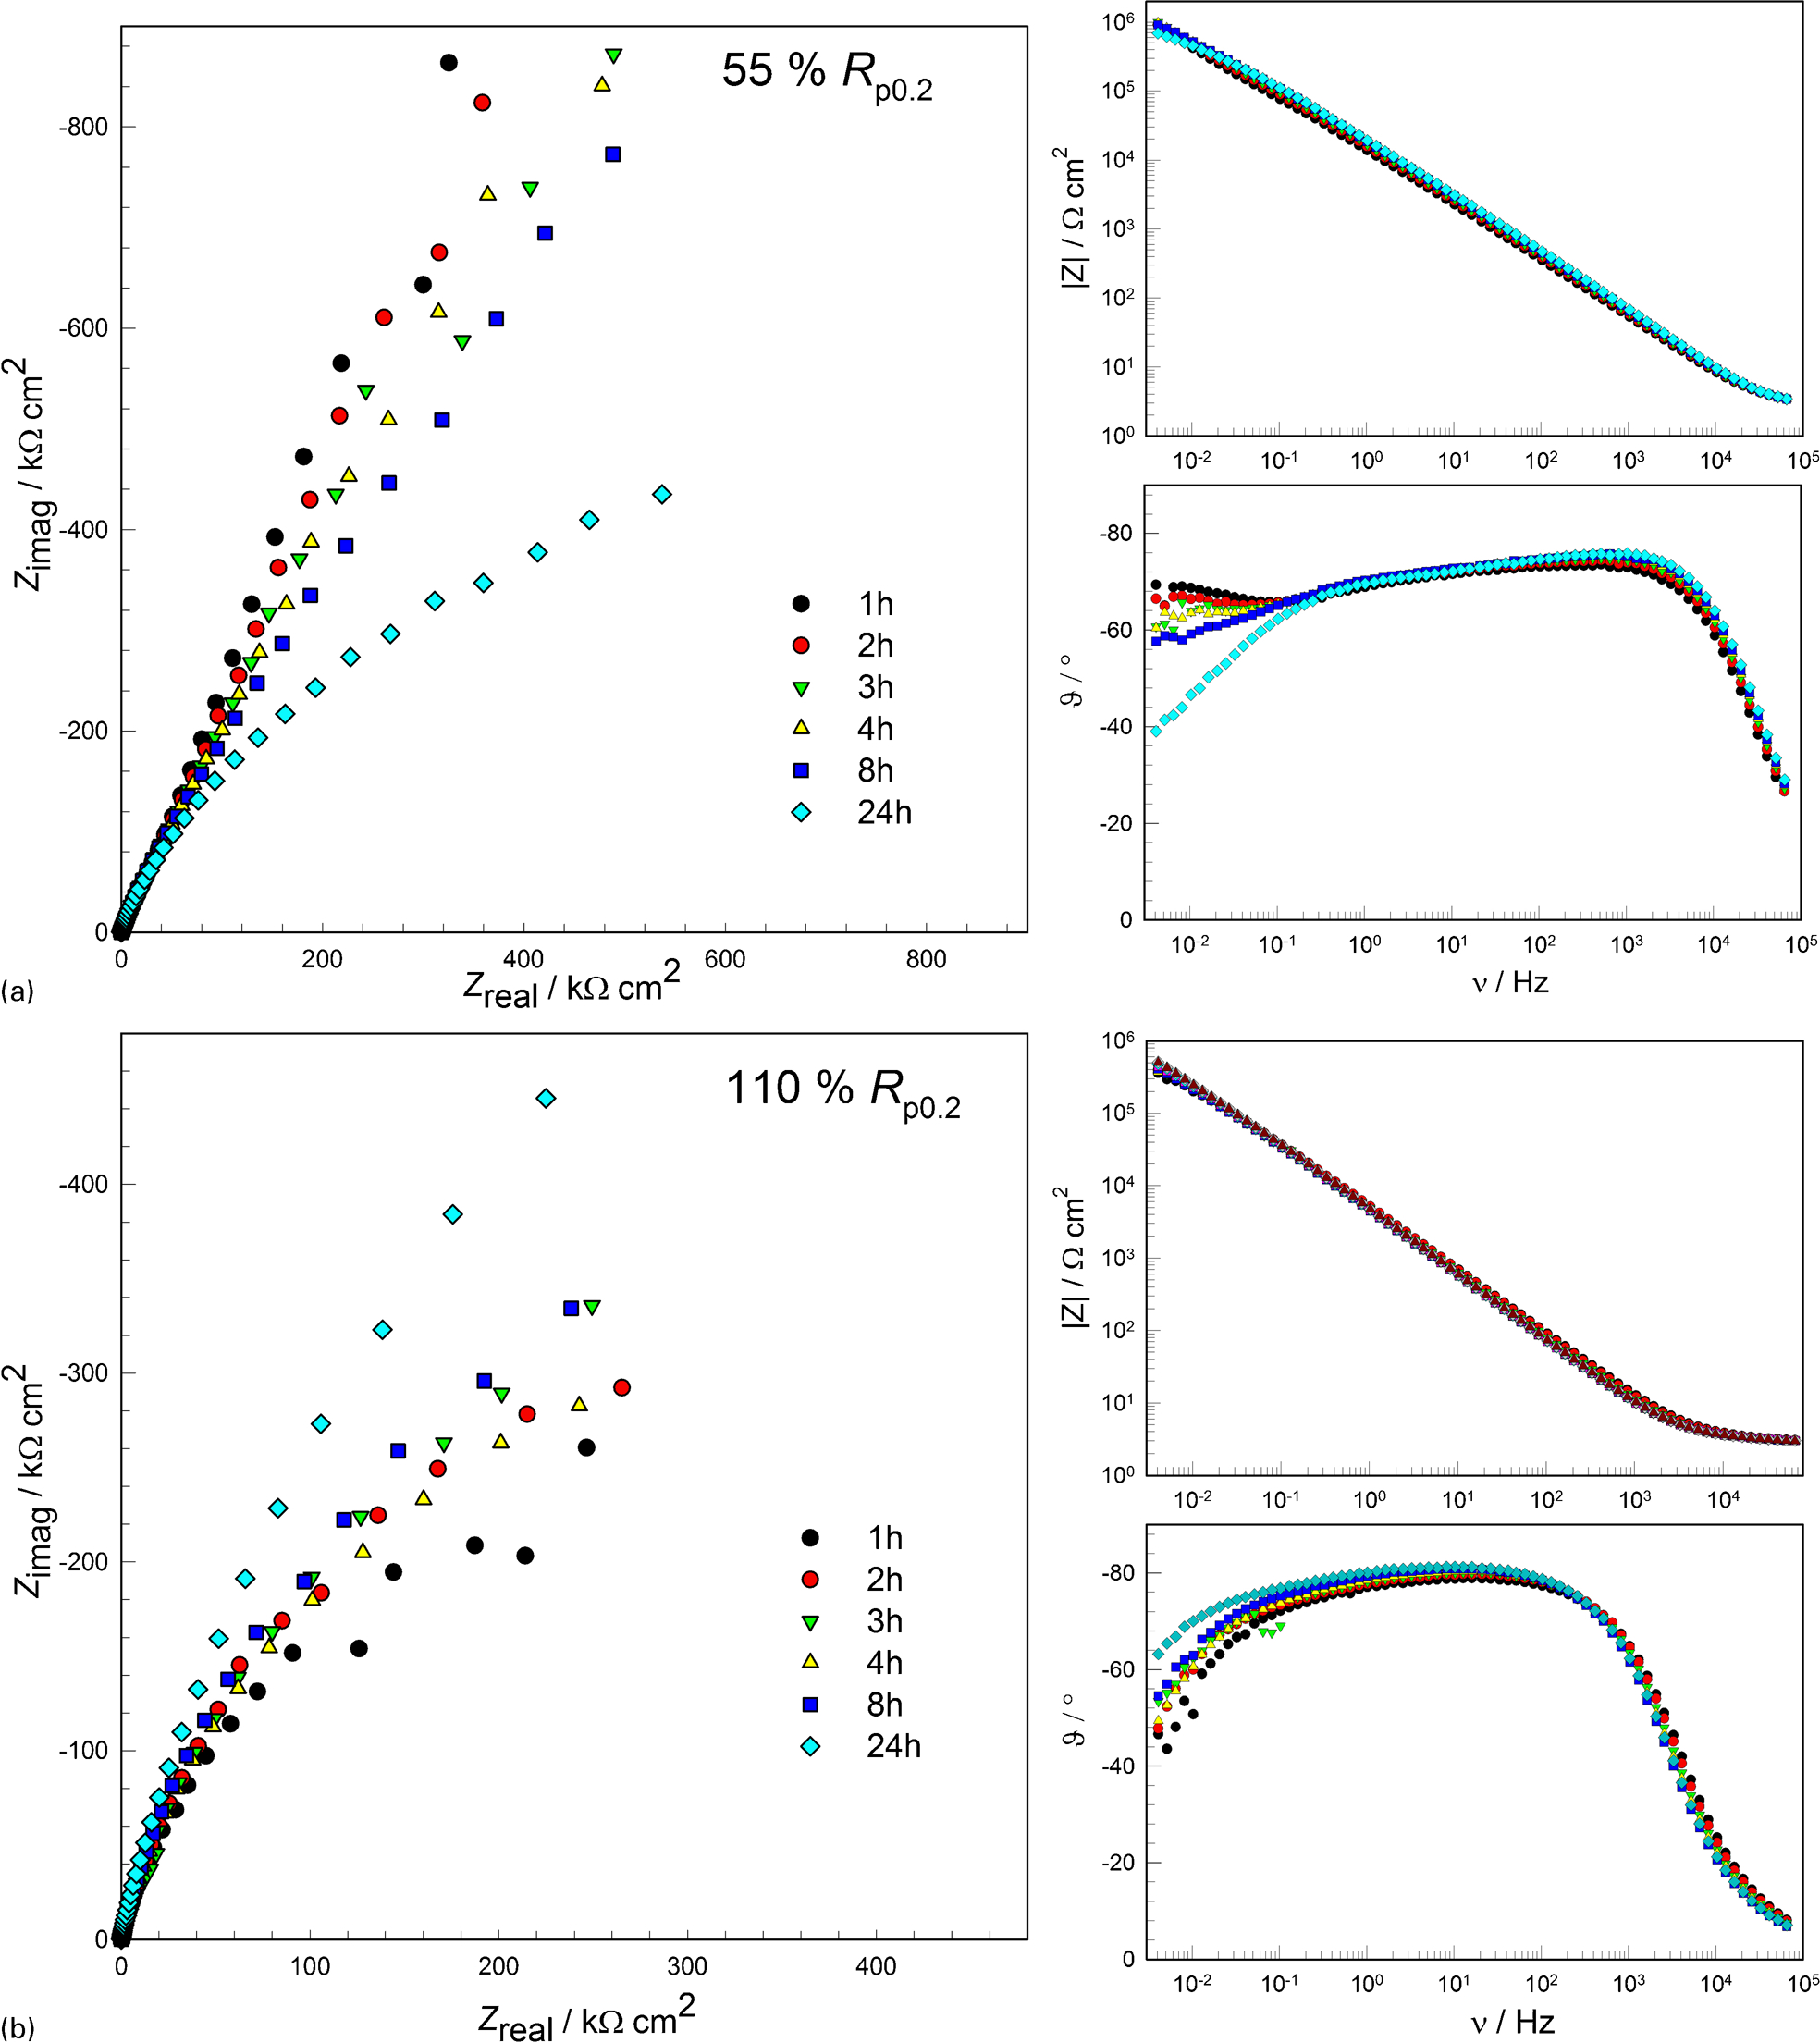
Figure 2 presents the EIS results and simultaneous imaging of the specimen gauge section for the specimen loaded to 250 kg (50%R m), which also showed evidence of SCC. A timeline started with the immersion, which was eventually the start of the experiment, is presented in the figure. In the figure, the presented images and EIS results are related to that timeline. It has to be emphasised that the EIS time labels (e.g. 1, 2, 4 h, etc.) are only approximate times, and that the real times of measurements that could significantly differ from the labels are shown in Fig. 2. The impedance response at 1·46 h (‘EIS 1 h’) is found to be the greatest. After 1·9 h, crack initiation was observed based on the captured images of the specimen's surface. This can be also seen from the EIS measurement at 2·81 h (‘EIS 2 h’), where the impedance response in the Nyquist plot is four times smaller than that measured at 1·46 h (‘EIS 1 h’). The crack initiation is the result of changes in the passive film properties. These changes are indicated at the smallest frequencies in the EIS results. The specimen failed at 4·5 h and the subsequent EIS measurement (‘EIS 3 h’) showed the smallest impedance response in the Nyquist plot. Following specimen failure, the newly exposed fracture surface started to repassivate as indicated by the increase in impedance at ‘EIS 4 h’. It is also evident from the Bode diagram that during SCC, the system underwent different processes since time constants changed with time considerably. There were two processes detected at high and intermediate frequencies (one time constant) and lower frequencies (second time constant). It was previously observed that cracking of the specimens can be successfully detected with evolution of time shift at frequencies in the range of 100-0·1 Hz, detecting cracks from 0·1 to 10 mm. 16 It is visible from the Bode diagram (Fig. 2) that a peak of a phase shift response changes towards lower frequencies. The processes that can be observed at these frequencies are indicative of a change in the electrical double layer (EDL) properties.
Set of six selected images with times of capture and first four EIS measurements related to plotted timeline of experiment (experiment no. 8, Table 1)
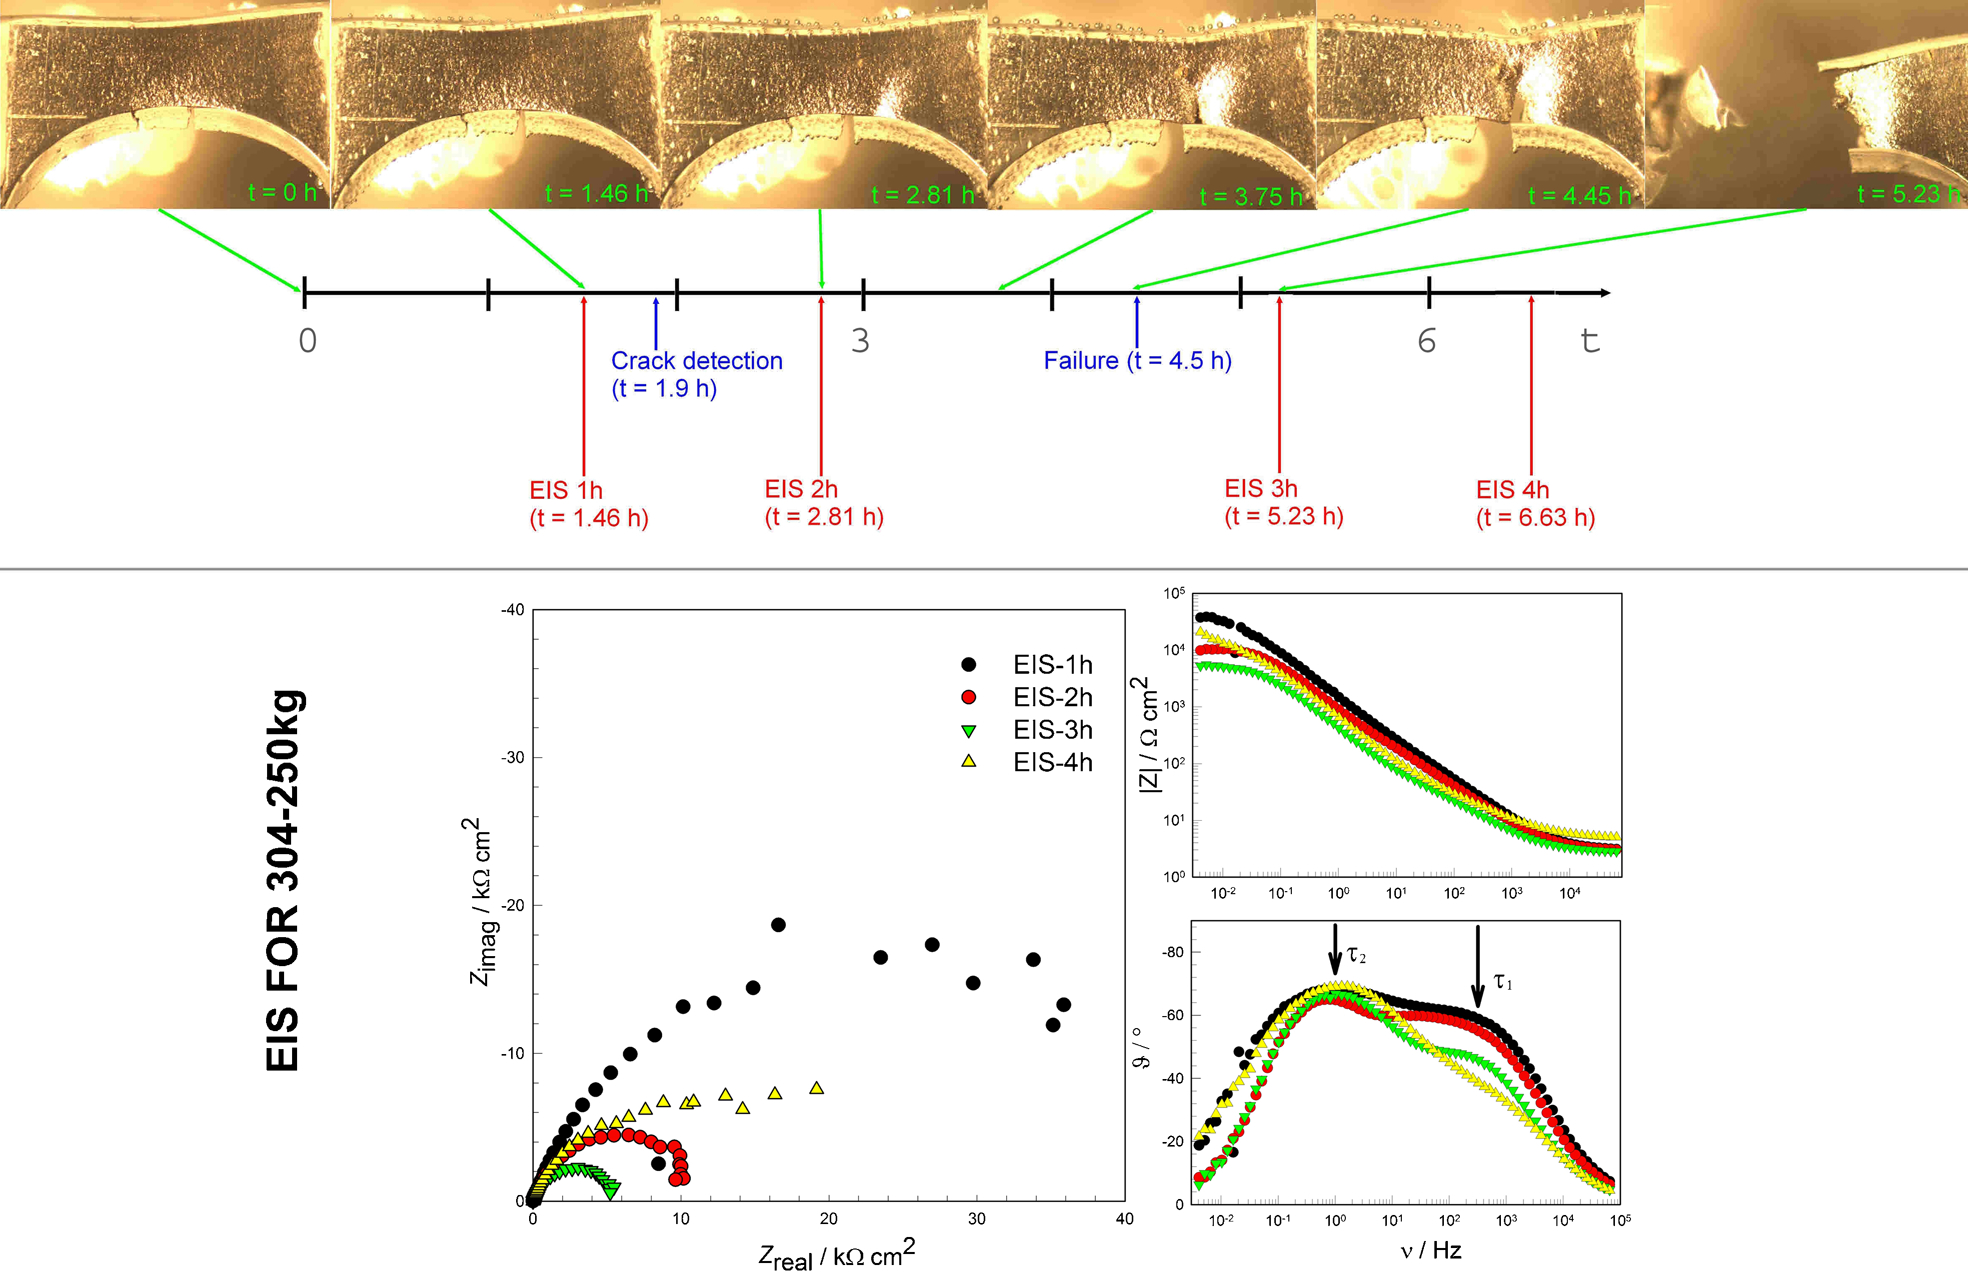
The SEM analysis performed on the failed specimen is presented in Fig. 3. There was one major crack identified that resulted in specimen failure along with a number of smaller cracks. One of the smaller cracks is shown in Fig. 3a. From the fracture surface (Fig. 3b), it was estimated that ∼60% of the final fracture was intergranular (Fig. 3c), caused by IGSCC, while the remaining fracture surface was ductile, caused by mechanical overload of the specimen.
a side surface of specimen, with small cracks; b fracture surface; c brittle part of fracture caused by IGSCC; d ductile part of fracture caused by overloading of specimen
In order to clearly resolve the different processes detected during EIS measurements, the equivalent circuit with two RQ couples was used to fit the EIS data for 304 stainless steel in sodium thiosulphate solutions under different constant tensile loadings (Fig. 4).
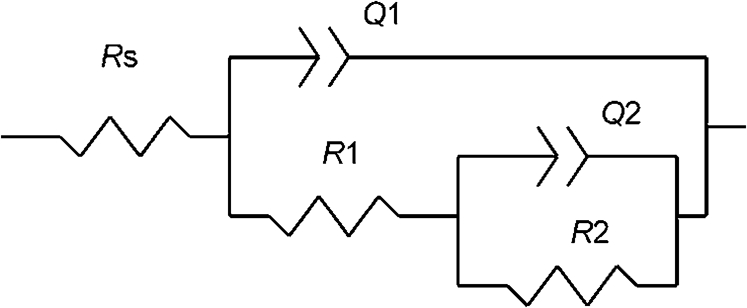
Equivalent circuit used to fit EIS data
R s in the equivalent circuit represents solution resistance and is very low in our case, as much as several Ω cm2 for all the investigated systems. The first (R 1Q 1) couple represents the processes that are detected at high frequencies and are connected to the oxide film resistance and the capacitive behaviour of the oxide film. The second process (R 2Q 2), usually detected at intermediate and lower frequencies, reflects the charge transfer resistance and capacitive properties of the EDL. Changes in cracking and loading of the specimens are thus first visible at lower frequencies.
Constant phase element was used to gain better fits. The impedance of the constant phase element is Z(CPE) = 1/[Q(iw)n], where if n is 1, Z becomes the impedance of the capacitor and Q is the capacitance of the capacitor. If n is different from 1, the system shows behaviour that has been submerged to surface heterogeneity or to continuously distributed time constants for charge transfer resistance.13,20
All impedance data were fitted using the equivalent circuit presented in Fig. 4. Reasonably good fits were attained, with chi square always smaller than 0·001.
The impedance parameters obtained by fitting the experimental data to the selected equivalent electrical circuit are presented in Fig. 5. The red dotted experiments denote experiments where SCC was observed.
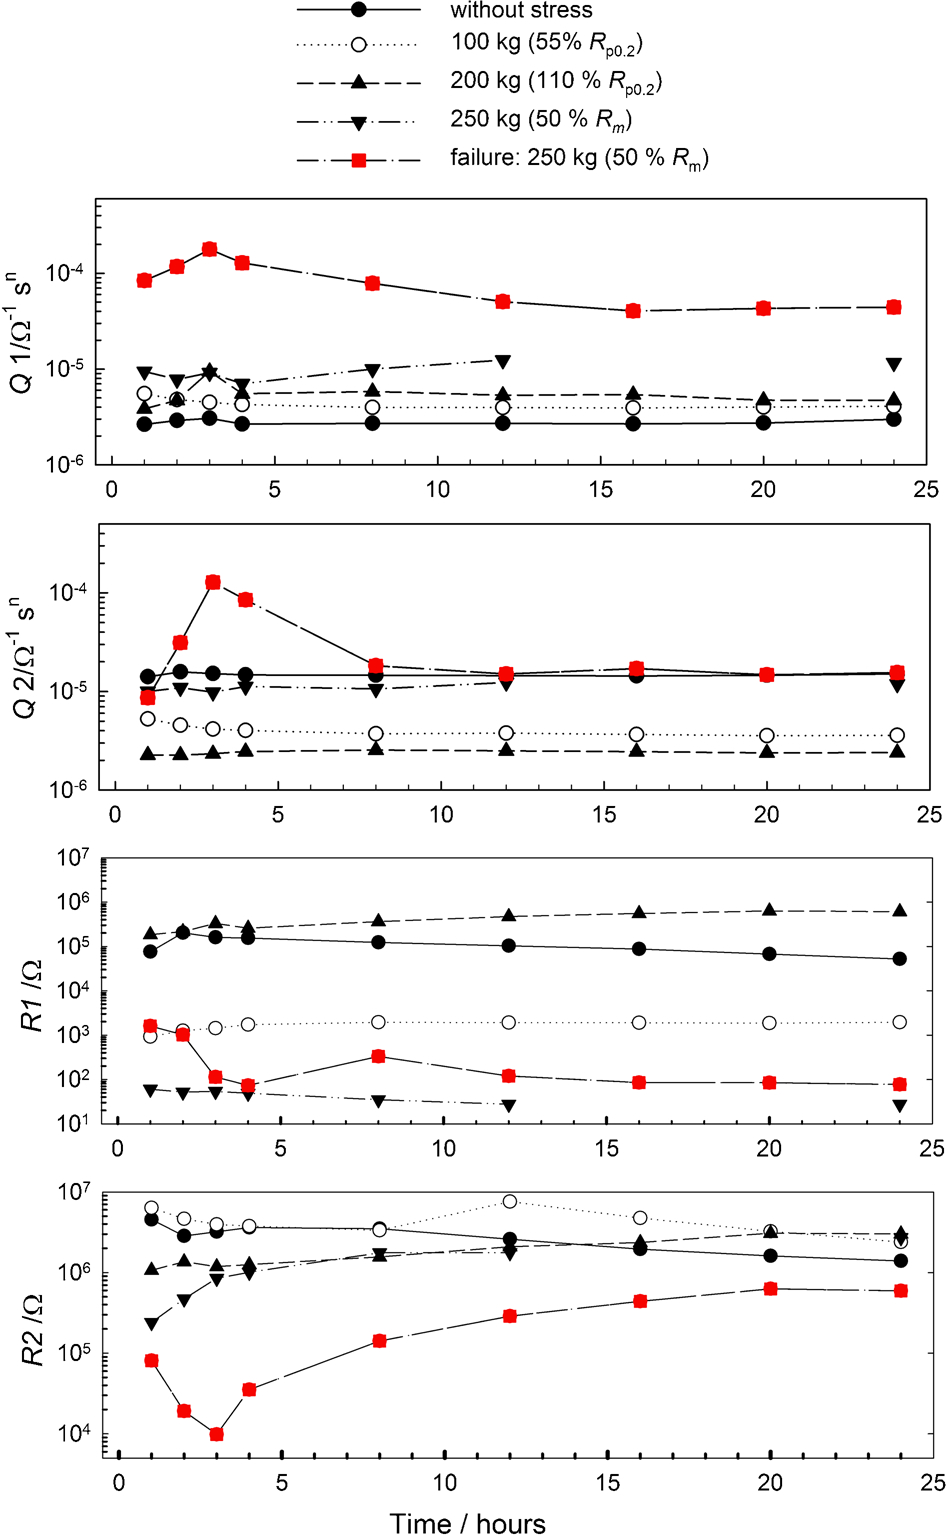
Fitted EIS parameters for 304 stainless steel in 0·5M thiosulphate solution under different constant loadings at different exposure times
In general, the capacitance of the oxide film and EDL do not change much with time for the experiments that did not undergo SCC and failure. The capacitance values Q 1 for oxide films on specimens loaded to 100 kg (55%R p0·2) or less were lower than those where the loads exceeded the material yield strength. The capacitance of EDL does not change much with time unless specimen failure occurred. The resistance of the oxide R 1 and the charge transfer resistance R 2 vary only little with time for each experiment where SCC did not occur. Figure 6 presents the total polarisation resistance as a sum of partial resistances. The polarisation resistance increases with time for specimens loaded above the yield strength (e.g. 200 and 250 kg) and decreases with time for specimens loaded below the yield strength (e.g. 0 and 100 kg).
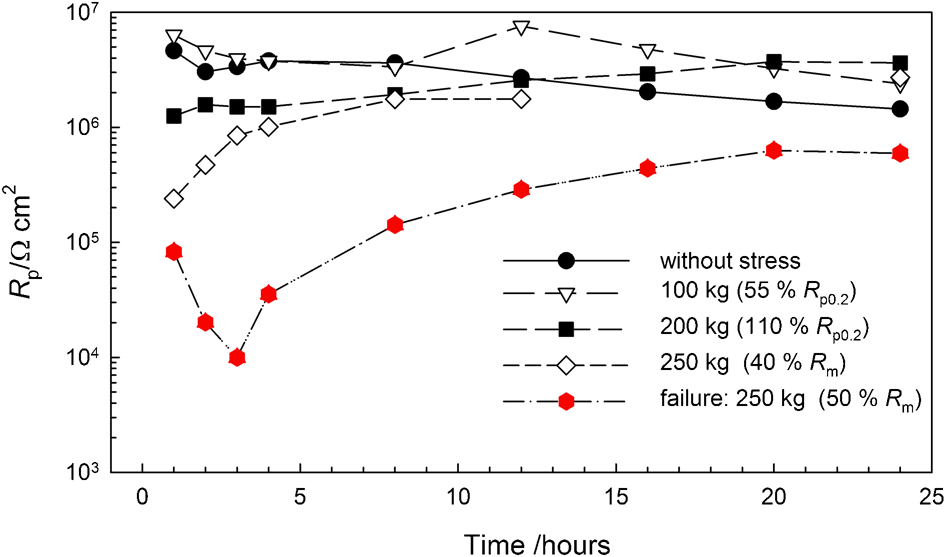
Polarisation resistance of 304 stainless steel in 0·5M thiosulphate solution under different constant loadings at different exposure times
The capacitances of the EDL (Q 2) and oxide film (Q 1) strongly increased with time in the first hours before failure by SCC. This was due to dramatic changes in the passive film (i.e. reduction in film thickness, opening of cracks in the passive films). After failure by SCC, the capacitance of the oxide film and EDL subsequently decreased due to active growth of the passive film.
The resistance of the oxide film R 1 decreases with time when the specimen undergoes cracking. Moreover, the charge transfer resistance R 2 also decreases with time since new and extensive dissolution reactions take place during the cracking process (Fig. 5). Similar observations of decreasing charge transfer resistance with the development of cracking process or decay of passive film tightness were observed by Orlikowski et al. 18 After the failure, the opened fresh surfaces repassivated again, observed by the increasing resistance of both oxide film and charge transfer resistance (Fig. 5).
However, the total polarisation resistance (R p = R 1+R 2) for six experiments was compared, as presented in Fig. 6. The total polarisation resistance, deduced from impedance data, decreased for the unloaded specimens and the specimens loaded to 100 kg (55%R p0·2). For the specimens loaded above yield strength, which exhibited no cracking, R p increases with time. For the specimen loaded above yield strength, which failed by SCC, R p was found to decrease.
The specimens tested below the yield strength of the material show a decreasing R p with time. This phenomenon can be explained by the fact that the initial loading did not significantly affect the passive film properties, and it is simply the corrosive environment that results in the reduction in R p with time. On the other hand, specimens loaded above the yield strength resulted in an increase in R p with time. It is assumed that this specific observation results from damage to the passive film as the specimen is loaded above yield, and the material becomes workhardened. Obviously, the process of repassivation of the passive film on specimens loaded above yield is quicker and more effective than that due to the corrosive environment for specimens loaded below yield strength.
Similar findings were observed by Orlikowski et al., 18 where they showed that at lower ranges of elongation, mechanical factors were dominant (surface hardening and increase in R p in our experiments), while for higher elongation ranges, electrochemical factors dominate (changes in EDL interface).
In the present study, changes in passive film properties due to film rupture were detected, although it was not possible to differentiate between the initiation and propagation stages of the crack. In our previous studies, it was shown that EN, together with image analysis, elongation and AE, could be used to detect SCC processes very reliably. 12 Thus, it might be expected that a simplified technique, such as multisine EIS 21 with more frequent measurements, may be a more reliable technique for in situ SCC monitoring than the EIS technique presented in this study.
Conclusions
Results from this present study have shown that EIS can be used to detect passive film damage that can be related to IGSCC. The technique is limited to detecting the initiation stage of SCC, while its ability to follow the propagation of cracks is uncertain.
The following conclusions can be made from the in situ EIS measurements performed on austenitic stainless steels tested under an applied constant load.
Specimens loaded below yield point (σ<R p0·2) exhibited a high initial polarisation resistance that decreased with time, while specimens loaded above yield (σ>R p0·2) resulted in a low initial polarisation resistance that increased with time. It is believed that surface cold work induced by loading the specimen above its yield strength resulted in a passive film less protective than that which forms on a non-cold worked surface (i.e. specimen loaded below yield). The increase observed in polarisation resistance with time for the specimen loaded above yield is likely to be associated with subsequent film repassivation.
Modelled parameters using two time constants clearly indicate changes in the passive film properties at the metal/solution interface for various applied loads. The occurrence of SCC was characterised by a significant decrease in polarisation resistance and an increase in capacitance of the EDL. This observation is consistent with the findings from other studies. 18