
Abstract
Autoclave corrosion experiments were conducted on a number of zirconium alloys in different heat treatment conditions. The alloys tested in the present work were Zircaloy-4, ZIRLO® (ZIRLO is a registered trademark of Westinghouse Electric Company LLC in the USA and may be registered in other countries throughout the world. All rights reserved. Unauthorised use is strictly prohibited.) and two variants of ZIRLO with significantly lower Sn levels, referred to here as A-0·6Sn and A-0·0Sn. Typical corrosion kinetics with a change from pre- to post-initial transition was observed with ZIRLO and Zircaloy-4 displaying the shortest time to the initial transition after 120-140 days of autoclave exposure, followed by A-0·6Sn materials after 140-260 days. A-0·0Sn materials showed no sign of transition even after 360 days although one sample tested to 540 days had gone through transition. Material in the stress relieved condition generally experienced initial transition earlier than the same alloy in the recrystallised condition. Pretransition samples had a universally black oxide layer, which eventually developed grey patches when transition occurred. Practically, all non-hydrogen charged alloys showed a strong trend towards cubic oxide growth rates. Cathodic hydrogen charging was conducted to simulate end of life condition of cladding tubes, forming a hydride rich rim region at the outer surface of the cladding tubes. Hydrogen charged materials generally experienced accelerated corrosion of different degrees with the exception of recrystallised A-0·0Sn and partially recrystallised A-0·6Sn showing no sign of acceleration. It therefore seems that increasing tin levels has a negative impact on autoclave corrosion behaviour for materials with and without a hydride rich rim. In developing advanced alloys for use in cladding, this effect has been balanced against the benefits that Sn is known to provide in-reactor, including robustness in corrosion behaviour and reduced irradiation growth. It was noted that most materials with a hydride rich rim exhibit parabolic corrosion kinetics with decreased initial weight gain but increased overall weight gain.
Keywords
Introduction
Zirconium based alloys have been the material of choice for fuel cladding, channels, spacer grids and guide tubes that comprise the structural components of fuel assemblies in water cooled nuclear power plants since the early 1950s. The two physical properties of zirconium alloys, which largely influence their selection, are their excellent high temperature water corrosion resistance and very low thermal neutron absorption cross-section. The initial kinetics of zirconium alloy corrosion in high temperature pressurised water (i.e. before the initial transition) can be described by an approximately cubic growth rate law, rather than the parabolic law as predicated for diffusion controlled processes.1–13 This is followed by successive cycles that involve a rapid increase in oxidation followed by a corrosion rate similar to the first cycle. Note that the cyclic transitions are often approximated by a linear post-transition corrosion rate. These cyclic transitions are repeated until an accelerated, roughly linear, breakaway corrosion takes place.3,5–8,11,14–19 Considerable efforts have been made to understand the mechanisms behind such transition and breakaway since elimination or delay of such behaviour will greatly improve the overall corrosion performance of zirconium alloys. However, to date, our understanding of these two phenomena is still limited. A number of mechanisms have been proposed for the breakdown of the pretransition oxide, and it has been suspected that more than one, if not all, of the mechanisms may be active in any given corrosion conditions. 5 Among them, one of the more prominent mechanisms involves the tetragonal to monoclinic phase transformation in the oxide due to a stress gradient inside the oxide film that might lead to cracking, as reported by Preuss et al. 20 and various other researchers such as Blat-Yrieix et al. and Busser et al.21,22 With a Pilling–Bedworth ratio of 1·56 from oxidation of zirconium to zirconia1,23 brings about a build-up of compressive stress inside the oxide layer with the highest stress level expected at the metal/oxide interface, decreasing towards the outer surface of the oxide. It has been suggested that these highly compressive stresses at the interface stabilise the tetragonal phase of the first oxide that forms at the interface,17,19,20,24–26 as well as causing creep in the underlying metal substrate. 21 Subsequently, as the corrosion front progresses inwards, the stresses in the existing oxide relax, destabilising the tetragonal phase, which results in a martensitic phase transformation from tetragonal to monoclinic oxide associated with a further 5% volume expansion. 27 It is proposed that this additional significant volume expansion leads to cracking in the oxide that ultimately results in the cyclic corrosion kinetic transitions.5,28,29
During prolonged reactor service, zirconium cladding absorbs hydrogen generated during the corrosion reaction between water and zirconium, radiolysis of coolant water and, in the case of pressurised water reactor (PWR) environment, the hydrogen overpressure.30–32 Hydrides will be precipitated when the local hydrogen concentration reaches the solubility limit, which is 120 wt ppm at 360°C.33,34 Given the temperature dependence of hydrogen solubility in zirconium, 35 preferential precipitation of hydrides occurs first at regions of lower temperature, which lay within the outer surface of fuel cladding at the metal/oxide interface. Such accumulation of hydrides has been correlated with breakaway corrosion once a high volume fraction of hydrides has been reached in the rim, although the underlying mechanism for this accelerated corrosion is still unclear.5,11,14,16,21,36–40 Microstructure observations of oxides grown on artificially formed hydride rich rims have shown high levels of porosity.36,40 It has been suggested that the complex stress field at the metal/oxide interface will result in fracture of the brittle hydrides, disturbing the coherence at the metal/oxide interface and therefore reducing the integrity of the inner barrier oxide layer. 16 Alternatively, because the volume expansion during hydride formation (17%)41–43 reduces the overall Pilling–Bedworth ratio to 1·3 (i.e. for the oxidation of zirconium hydride), it has been suggested that this could result in lower compressive stresses in the oxide. 44 A previous work has shown that a reduction in tin content delays the transition to breakaway corrosion in Zr–Sn–Nb–FeCrV alloys, 45 and it is difficult to see how the two arguments above can be affected by alloy chemistry. Note that alloy chemistry may indirectly impact breakaway by controlling hydrogen pick-up and the propensity for hydride rim formation.
It should also be noted that Sn is well known to have both positive and negative impacts on the in-reactor corrosion rate and growth acceleration at high burn-ups of PWR cladding. A reduction in the tin content generally improves the corrosion resistance, e.g. for Zircaloy-4 46 and advanced alloys like Westinghouse ZIRLO.47,48 This insight has been utilised over the years to improve cladding alloys by reducing tin. However, tin is also known to provide a robustness and predictability of the corrosion behaviour, e.g. it protects against enhanced corrosion in high lithium and abnormal chemistry conditions. 49 Tin addition also reduces the corrosion enhancement of weld regions compared with the non-weld region and reduces the irradiation growth acceleration of zirconium alloys at high burn-ups believed to be due to hydrogen. 50 These contradictory effects of tin have been balanced in the latest generation of advanced alloys, e.g. Westinghouse Optimized ZIRLOTM. (Optimized ZIRLO is a trademark of Westinghouse Electric Company LLC in the USA and may be registered in other countries throughout the world. All rights reserved. Unauthorised use is strictly prohibited.)
The purpose of the present paper is to provide detailed experimental data recorded during extensive autoclave corrosion testing in simulated primary water chemistry of three different Zr–Nb–Sn alloys with varying Sn contents and two Zircaloy-4 variants (Nb free Zr alloy). In some cases, material was available as clad tubes, while in other cases, it was available as sheet. A further variable was the final heat treatment of the material either producing a stress relieved (SR), partially recrystallised (pRX) or fully recrystallised (RX) condition. While these experiments focused on early corrosion kinetics and time to the initial transition, tube material was also cathodically hydrogen charged before autoclave testing in an attempt to simulate end of life condition of irradiated reactor claddings in order to identify material sensitivity to breakaway corrosion.
Experimental
Materials preparation
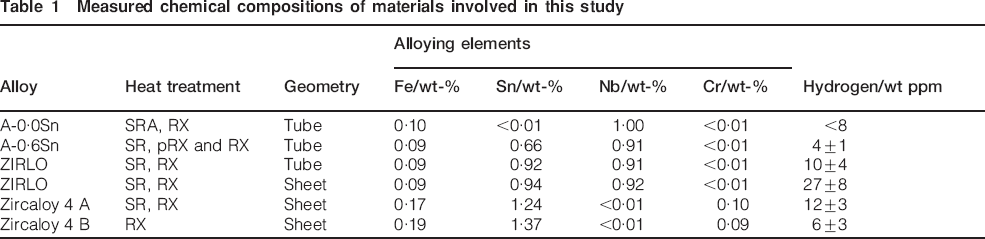
Two types of sample geometry were involved in this study. Tube samples were 30 mm long and 9·5 mm in diameter, while sheet samples were 30×20 mm. Note that the rolling direction for sheet samples was oriented parallel to the longer side. The wall thickness of all tube material is 0·6 mm, while the thickness of the sheet samples is 0·5 mm for the ZIRLO material, 0·7 mm for Zircaloy-4 (A) and 5·0 mm for Zircaloy-4 (B). All samples were pickled in a solution of 10 vol.-% hydrofluoric acid, 45 vol.-% nitric acid and 45 vol.-% distilled water for 3 min, removing <0·02 mm thick of material from the sample surface. Chemical composition and as received hydrogen concentration of each material were determined at the EDF Research and Development facility in Moret-Sur-Loing, France, and these are presented in Table 1. The alloys were provided in either two or three heat treatment conditions: SR, pRX (only for A-0·6Sn) and RX. Westinghouse provided all materials apart from the 5 mm thick Zircaloy-4 (B) sheet, which was provided by Rolls-Royce plc. The rationale behind the choice of alloys was to compare an Nb containing alloy (ZIRLO sheet) with a non-Nb containing alloy (Zircaloy-4 sheet) and to study the effect of Sn in Nb containing alloys (tin content decreases from ZIRLO to A-0·6Sn to A-0·0Sn). Note that A-0·0Sn is an experimental alloy, while all other alloys are commercial alloys.
Measured chemical compositions of materials involved in this study
Cathodic hydrogen charging
Cathodic hydrogen charging was conducted on pickled tube samples in a 0·1 mol L−1 KOH solution with a fixed current density of 10 mA cm−2. This process resulted in the formation of a hydride rich rim with fairly consistent thickness on the outer surfaces of tube samples. The 10 day charging process was followed by a 24 h homogenisation heat treatment at 400°C in Ar to redistribute some of the hydrogen further into the bulk of the testpiece. Averaged hydrogen levels of individual testpieces were determined by inert gas fusion analysis using an H-MAT 2500 (Ströhlein) analyser. This method only accounts for overall hydrogen concentration and provides no information regarding the distribution of hydrogen. Using a Philips X'Pert MPD operating at 45 kV (Cu tube) in glancing angle set-up (θ = 6°), it was revealed that samples with an overall hydrogen level between 600 to 700 wt ppm have the top few micrometres of material composed of ∼60% of δ-hydride. 51 This corresponds to an average hydrogen content in the rim of ∼11 000 wt ppm. In comparison, it has been predicted that a solid hydride rim would form once the oxide had grown to a thickness of 60 μm. These predictions have also been confirmed by hot cell observations. 52 Note that a fixed incident beam at θ = 6° ensures that 90% of the signal is collected from the top 3 μm of the specimen surface. Since the duration of the autoclave corrosion experiments of the hydrogen charged samples was relatively short, only the material from within this range was consumed. More details regarding the cathodic charging procedure and the microstructure analysis of the hydride rim can be found in Ref. 51.
Autoclave corrosion
Corrosion experiments were conducted in static isothermal autoclaves operating at 360°C in simulated primary water chemistry (Li and B were added in the form of lithium hydroxide and boric acid, Li = 2 wt ppm, B = 1000 wt ppm), at a saturation pressure of ∼18 MPa (360°C). The autoclave was deaerated each time during heat-up at 125°C. The tests were performed consistent with ASTM G2 standard. To enable tracking of oxidation weight gain as a function of autoclave corrosion exposure, as well as generating samples that have experienced different durations of autoclave exposures, sets of four samples were introduced into the autoclave periodically (every 20 days in the case of non-hydrided samples and every 10 days in the case of hydrided samples). Samples were rinsed in deionised water, dehydrated with ethanol and compressed air and weighed before loading into a stainless steel basket and inserting into the autoclave (Fig. 1). A graphical representation of the detailed loading plan as well as an autoclave test scheme is presented in Fig. 2, highlighting the insertion time of each set and the spread of individual samples from each set across different layers of the basket. The positions of individual samples were not altered throughout the autoclave corrosion tests. The loading plan was introduced as a measure to counter any possible temperature heterogeneity inside the autoclave. However, in most cases, no significant differences in corrosion kinetics were observed for samples in the same condition. Periodic weighing of the exposed samples was conducted between individual exposures, after which the samples were reinstalled to their original position inside the autoclave. Both pre- and post-corrosion weight measurements were conducted on a Mettler Toledo XS205 dual range analytical balance (repeatability, 0·01 mg; sensitivity accuracy, 4×10⁻⁶ Rnt). The balance was recalibrated after every 10 measurements. Note that weight measurements were normally conducted within hours after opening the autoclave. Samples were dipped into ethanol and dried by compressed air before conducting the weight measurements.
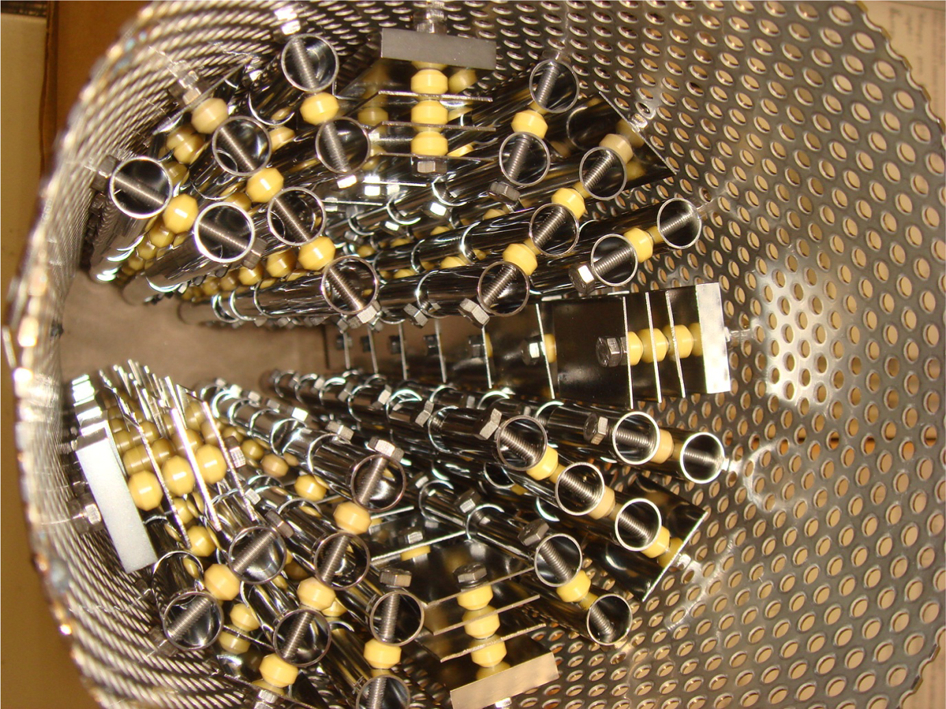
Autoclave basket showing all samples installed before autoclave exposure: location of individual samples is kept unchanged
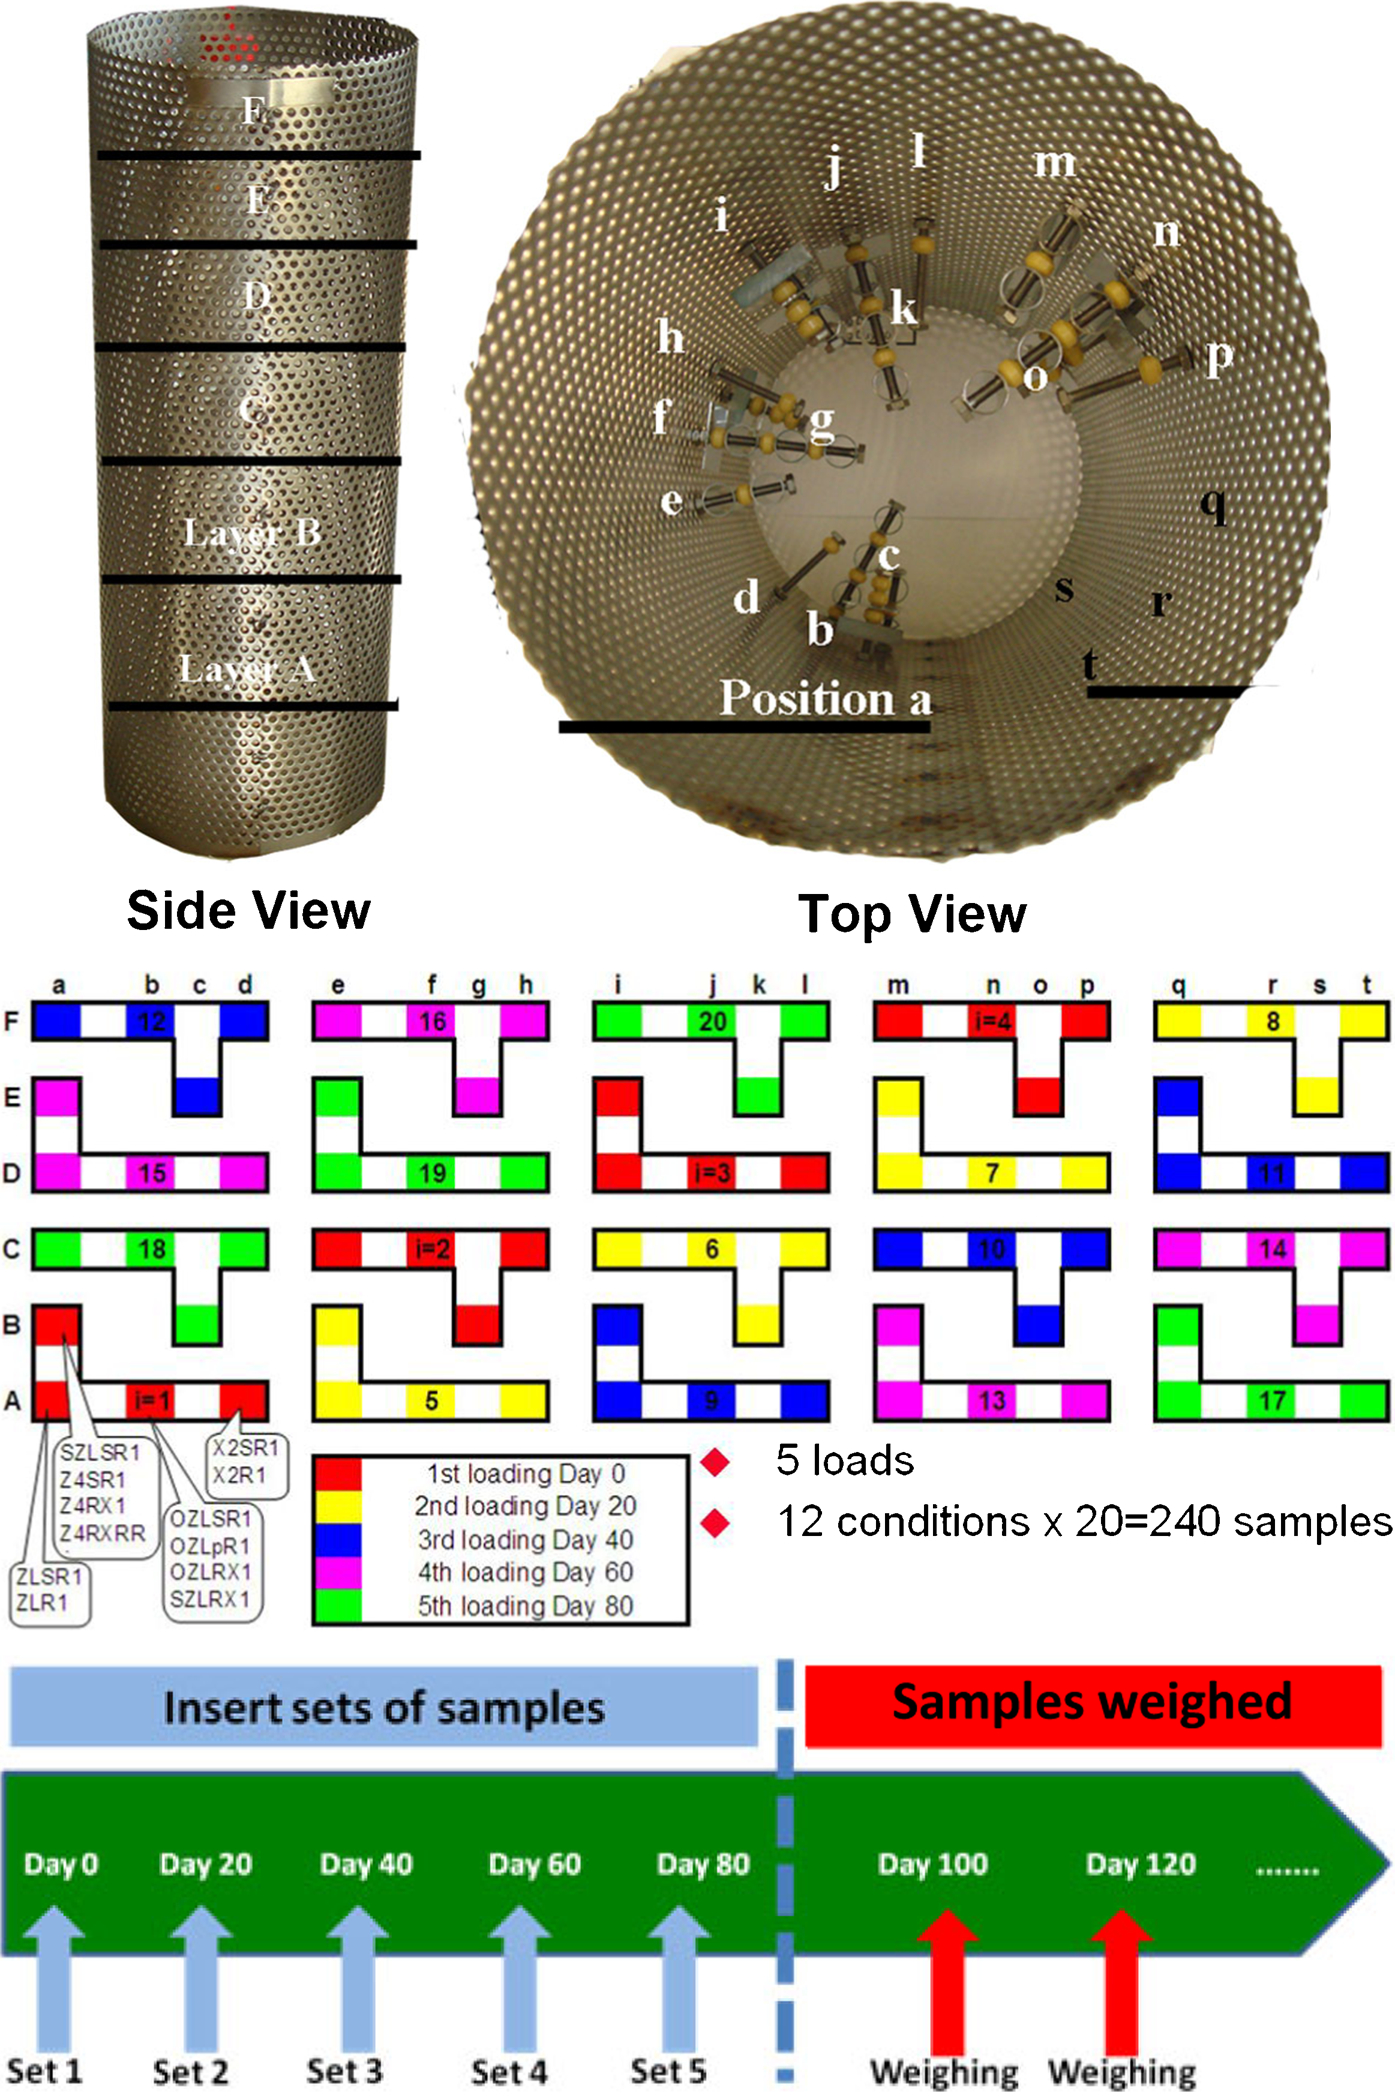
Sample allocation inside autoclave basket and autoclave test scheme
The corrosion exposures on non-hydrided (reference) materials aimed to provide samples and corrosion kinetic data from the early stage of corrosion up to and just exceeding the first transition, while exposures on hydrided materials aimed to provide similar data but including breakaway behaviour. The non-hydrided and hydrided samples were exposed in two separate autoclaves.
Results and discussion
Corrosion kinetics of non-hydrided reference material
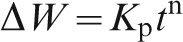
Figure 3 summarises the averaged pretransition corrosion weight gain plotted as a function of autoclave exposure time for all 12 non-hydrided materials. The pretransition corrosion kinetics can be described by
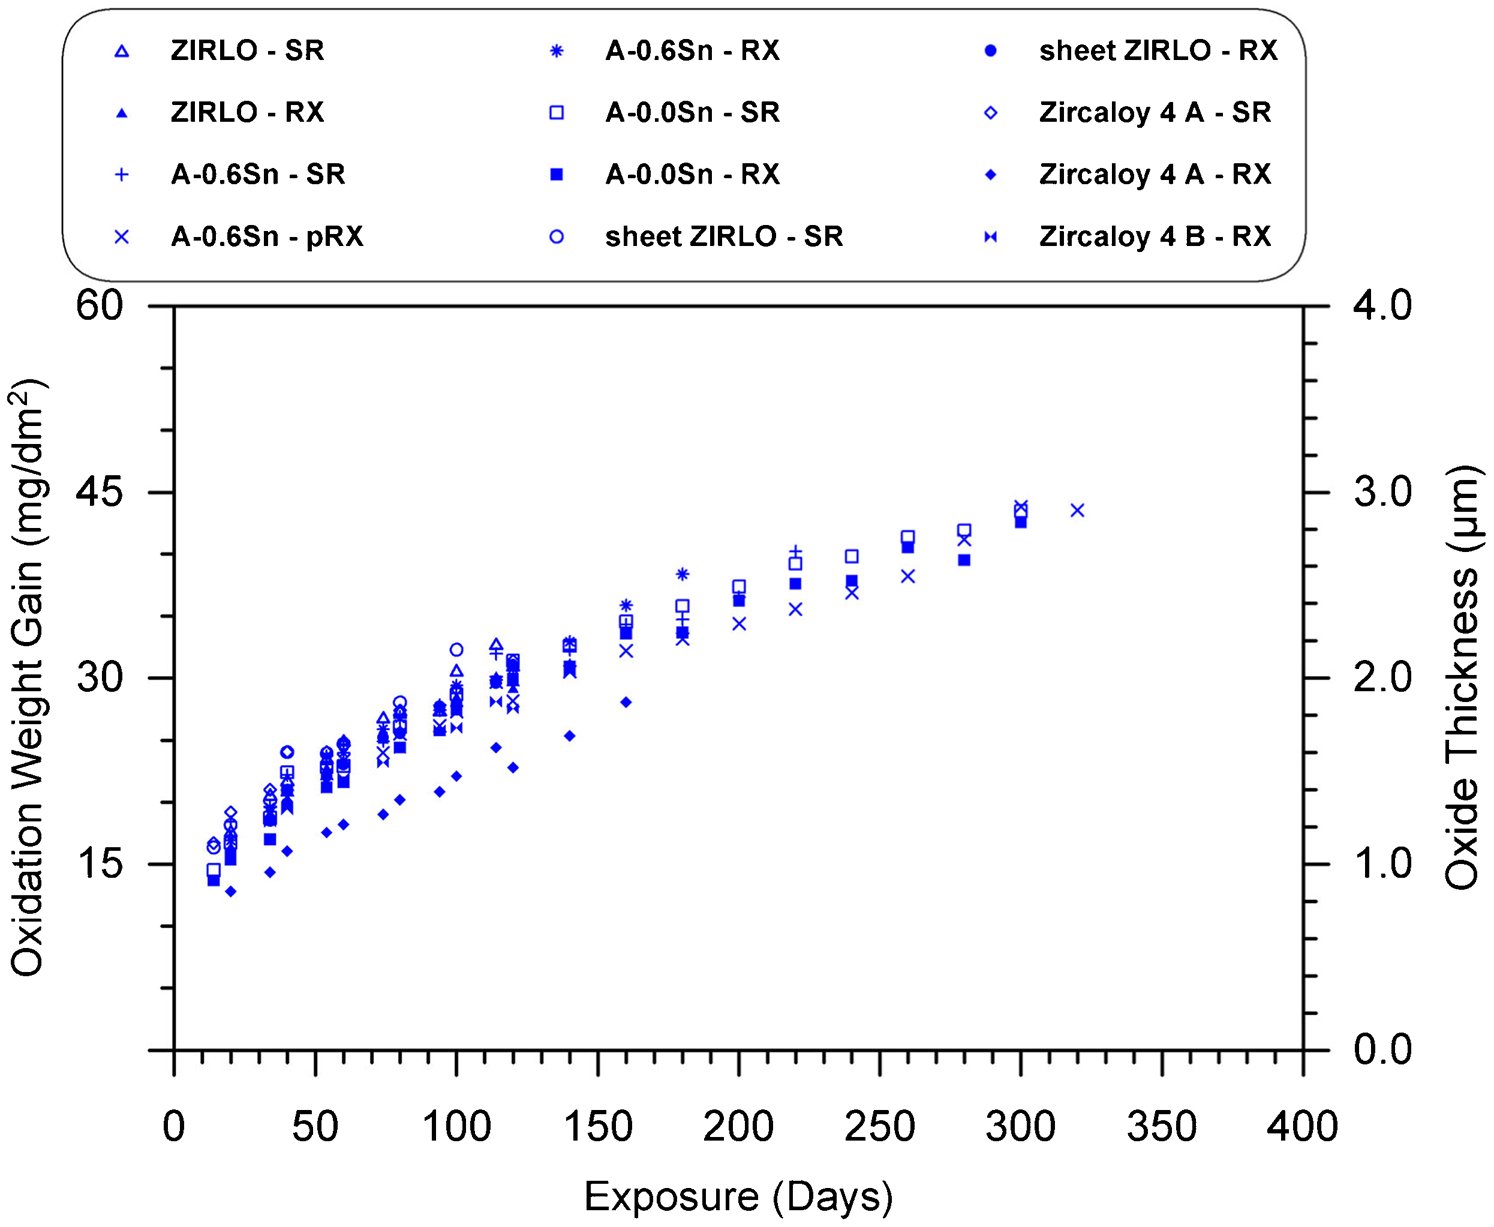
Summary of autoclave corrosion weight gain profiles showing averaged pretransition weight gain values for all 12 non-hydrided materials
Autoclave corrosion weight gain results of non-hydrided reference materials
*Measured on A-0·0Sn alloys exposed to a total 360 days with no sign of first transition.
Weight gain curves of for example alloys from each condition are shown in Figs. 4–9. Note that weight gain data for an individual measurement, instead for averaged ones, are plotted in Figs. 4–9, illustrating the level of scatter. Photographs of actual samples are also included, displaying the surface features of the pre-/post-transition oxide. A more detailed example of the change of oxide surface appearance before, during and after transition is given for sheet ZIRLO-SR in Fig. 10. It is clear that the onset of transition was accompanied by the appearance of small grey spots on the black oxide surface. The grey spots then grew bigger, spread across the surface and eventually formed a uniform layer of grey oxide covering the entire surface of the sample. Note that Fig. 10g was taken on a specimen with a further 440 days of exposure after reaching transition. Since the sheet ZIRLO-SR material reached its transition in 100 days, the sample shown in Fig. 10g is expected to have experienced at least five transitions. The oxide appearance at this stage was significantly lighter than that observed 40 days after the first transition.
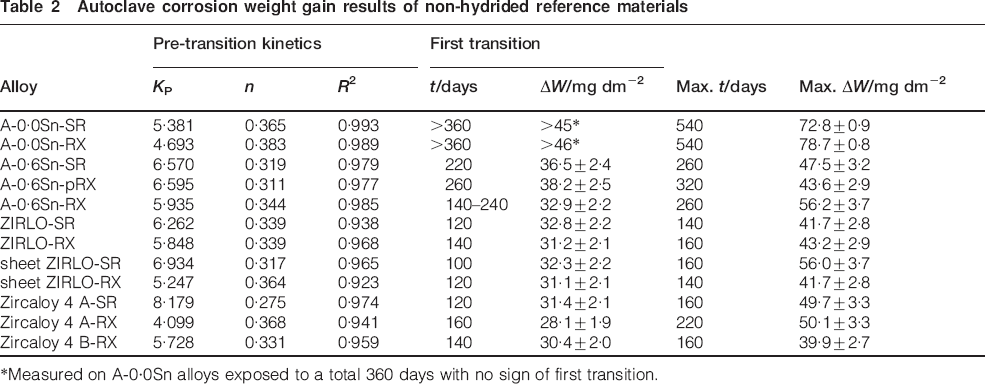
Autoclave corrosion weight gain profile of non-hydrided A-0·0Sn-SR and A-0·0Sn-RX materials: photographs of actual corrosion specimens included a non-hydrided A-0·0Sn-SR after 280 days of autoclave exposure, b non-hydrided A-0·0Sn-SR after 540 days, c non-hydrided A-0·0Sn-RX after 20 days, d non-hydrided A-0·0Sn-RX after 300 days and e non-hydrided A-0·0Sn-RX after 540 days of autoclave exposure

Autoclave corrosion weight gain profile of non-hydrided A-0·6Sn-SR, A-0·6Sn-pRX and A-0·6Sn-RX materials: photographs of actual corrosion specimens included a non-hydrided A-0·6Sn-SR after 180 days of autoclave exposure, b non-hydrided A-0·6Sn-SR after 260 days, c non-hydrided A-0·6Sn-pRX after 240 days, d non-hydrided A-0·6Sn-pRX after 320 days, e non-hydrided A-0·6Sn-RX after 180 days and f non-hydrided A-0·6Sn-RX after 200 days of autoclave exposure
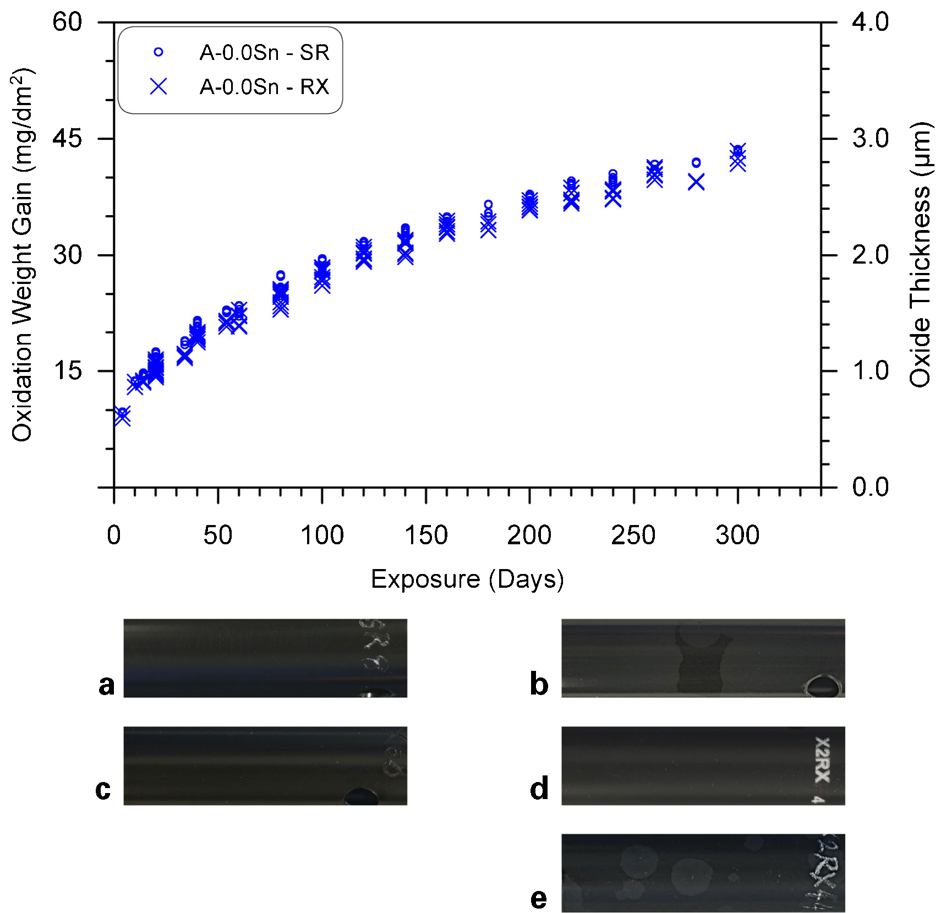
Autoclave corrosion weight gain profile of non-hydrided A-0·6Sn-RX material: highlighting differences between different sets of samples, only data from sets 1 and 3 are plotted here
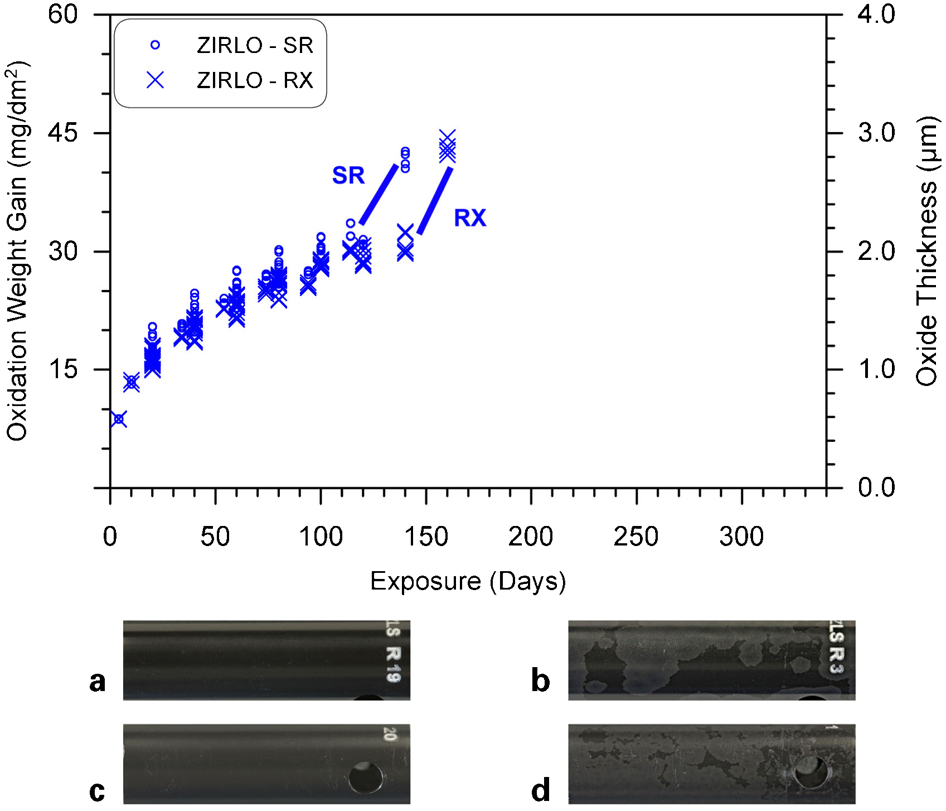
Autoclave corrosion weight gain profile of non-hydrided ZIRLO-SR and ZIRLO-RX materials: photographs of actual corrosion specimens included a non-hydrided ZIRLO-SR after 60 days of autoclave exposure, b non-hydrided ZIRLO-SR after 140 days, c non-hydrided ZIRLO-RX after 80 days and d non-hydrided ZIRLO-RX after 160 days
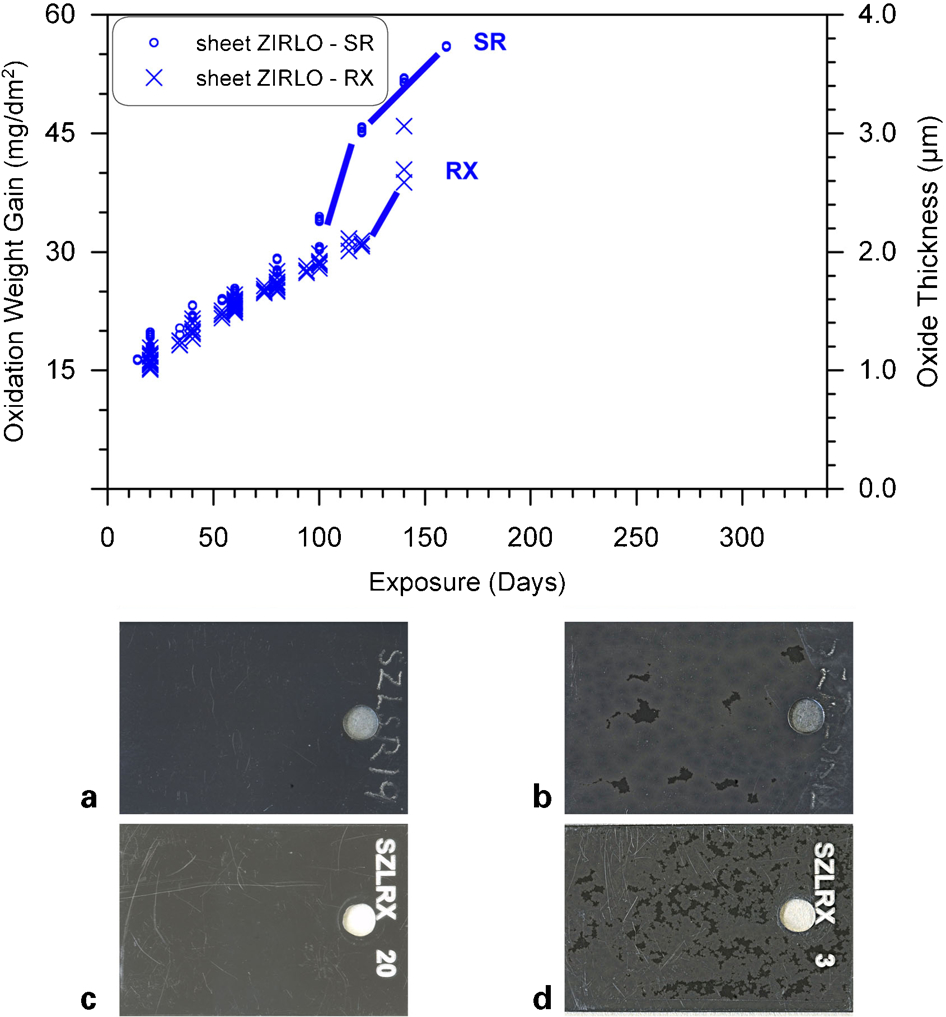
Autoclave corrosion weight gain profile of non-hydrided sheet ZIRLO-SR and ZIRLO-RX materials: photographs of actual corrosion specimens included a non-hydrided sheet ZIRLO-SR after 80 days of autoclave exposure, b non-hydrided sheet ZIRLO-SR after 120 days, c non-hydrided sheet ZIRLO-RX after 60 days and d non-hydrided sheet ZIRLO-RX after 140 days
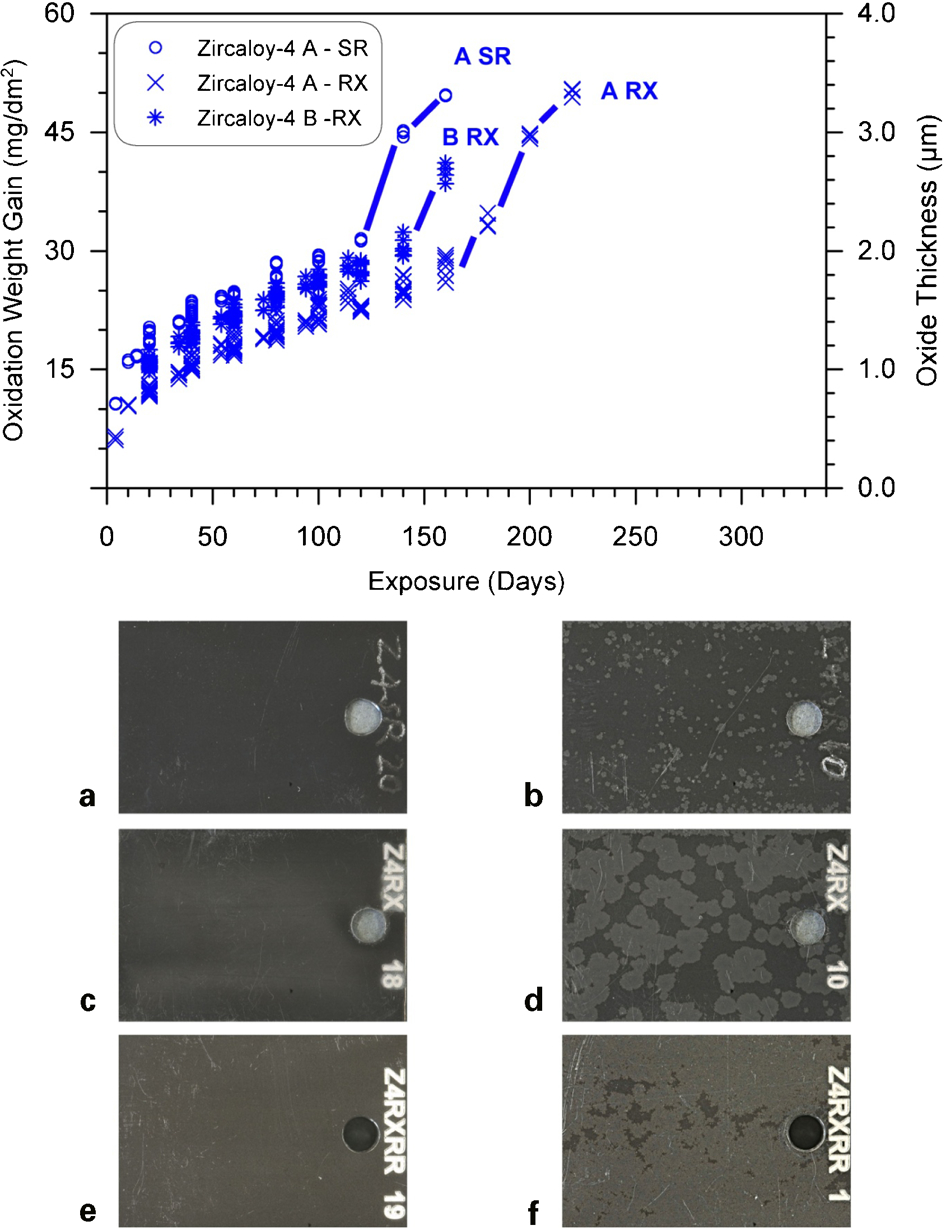
Autoclave corrosion weight gain profile of non-hydrided Zircaloy-4 A-SR, Zircaloy-4 A-RX and Zircaloy-4 B-RX materials: photographs of actual corrosion specimens included a non-hydrided Zircaloy-4 A-SR after 80 days of autoclave exposure, b non-hydrided Zircaloy-4 A-SR after 120 days, c non-hydrided Zircaloy-4 A-RX after 140 days, d non-hydrided Zircaloy-4 A-RX after 180 days, e non-hydrided Zircaloy-4 B-RX after 80 days and e non-hydrided Zircaloy-4 B-RX after 160 days of autoclave exposure
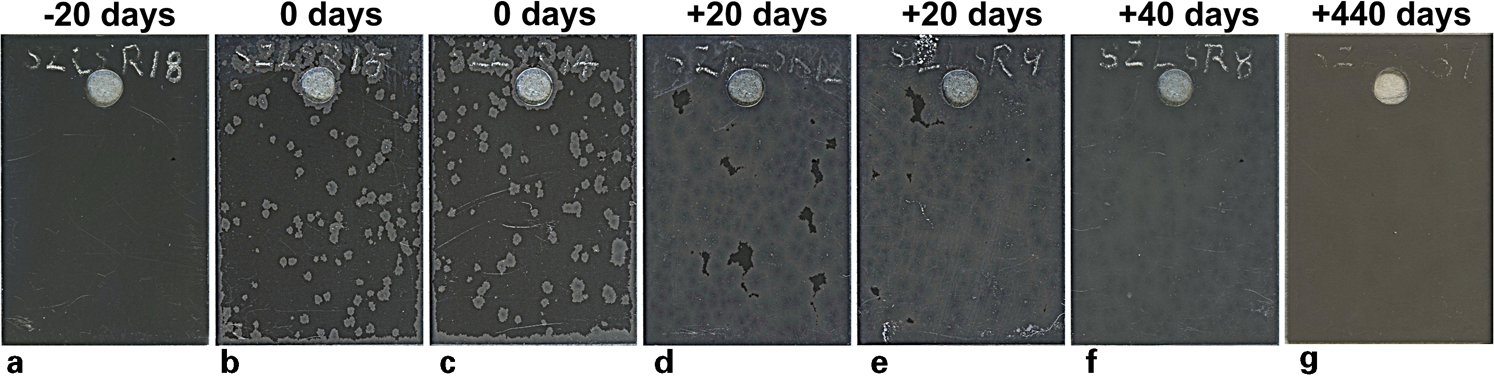
a transition –20 days; b, c onset of transition; d, e transition +20 days; f transition+40 days; g transition +440 days of autoclave exposure
With up to 300 days of autoclave exposure recorded, non-hydrided A-0·0Sn materials showed identical kinetics in both SR and RX conditions as demonstrated in Fig. 4. No trace of a transition was observed, and a black oxide was seen as early as after 20 days of corrosion and for all samples to 300 days of corrosion (Fig. 4a, c and d). A second batch of autoclave exposures, aimed at recording long term corrosion kinetics, was conducted on A-0·0Sn material. These tests confirmed that A-0·0Sn showed no sign of a transition up to 360 days of exposure and ∼45 mg dm−2 weight gain, but a dark and light patchy surface (Fig. 4b and e) after 540 days of exposure and ∼80 mg dm−2 weight gain. It is hence suggested that A-0·0Sn materials (both SR and RX conditions) will initiate transition between 360 and 540 days of exposure. Weight gain data collected during the second batch of autoclave exposures is not included since only two data points exist.
Similar pretransition corrosion kinetics was recorded for non-hydrided A-0·6Sn (Fig. 5). During transition, all samples displayed the expected patchy oxide surface of black and grey areas (Fig. 5b, d and f). The longest time to transition was achieved by the pRX material after ∼260 days of exposure. At this stage, the increase in corrosion rate was however only very modest. Pre- to post-transition was observed after 200 days of exposure in A-0·6Sn SR material with again only a modest increase in corrosion kinetics. In contrast, A-0·6Sn in the RX condition displayed a far more dramatic acceleration in corrosion ∼200 days of exposure. However, indications of transition were detectable from the change of surface oxide appearance from ∼140 days of exposure. The corrosion data also suggest (Fig. 5) that the RX material undergoes a long transition regime of ∼100 days. Figure 6 sheds more light onto this behaviour by presenting the corrosion data from two different sets. The four individual samples within each set were installed at different heights of the autoclave basket (Fig. 2) but displayed almost no variation in corrosion kinetics. However, there is a distinguishable difference in terms of sets 1 and 3 (i.e. sets that were put into the autoclave at a different time, see Fig. 2). Such variation is not observed in any other alloy or heat treatment condition. The root cause of such variation is currently not clear.
Of all the materials tested, transition occurred earliest on ZIRLO with the transition for tube material in the SR and RX conditions reached after 120 and 140 days respectively (Fig. 7). Similarly, sheet ZIRLO-SR material reached transition in 100 days, while RX material reached transition in 120 days (Fig. 8).
Corrosion kinetics for sheet Zircaloy-4 was similar to those for ZIRLO in terms of time to transition and the earlier occurrence for SR material (Fig. 9). However, a noticeably earlier transition was observed for the thicker of the RX materials, Zircaloy-4 (B), than for the thinner Zircaloy-4 (A). The pretransition corrosion rate also appeared to be lower for the RX material compared with the SR condition.
The data obtained for Zircaloy-4 and ZIRLO seem to point to a general trend for earlier transition in SR materials; however, the opposite is seen for A-0·6Sn. In the case of A-0·0Sn, no distinction between the two conditions can be made as the material did not undergo transition in the timeframe of detailed corrosion studies. No significant difference in corrosion kinetics during autoclave testing was observed between ZIRLO (sheet or tube) and Zircaloy-4 sheet. In contrast, a clear trend was found when comparing ZIRLO, A-0·6Sn and A-0·0Sn with very significant delays in the onset of transition as the tin content in the alloy is reduced. Other researchers have reported previously a similar effect of Sn53–57 for Zircaloys (not containing Nb), an experimental Zr–Sn–0·19Fe–0·10Cr alloy (not containing Nb) and Zr–Nb binary alloys with 0·1-1·0 wt-%Nb content. Usually, the differences in corrosion performance have been attributed to effect that tin has on the amount of tetragonal phase near the metal/oxide interface. Although some authors have suggested that increased tin levels in zircaloys destabilise tetragonal zirconia, 57 there is substantial evidence that tin is in fact a tetragonal phase stabilising element.53,54,58,59
Corrosion kinetics of hydrided material
Corrosion weight gains of both non-hydrided reference and hydrided alloys are plotted in Figs. 11–17 against exposure time. Photos of each hydrided alloy after 40 days of exposure are inserted, demonstrating the surface appearance of the oxide at this stage. After 80 days of autoclave exposure, all hydrided alloys showed evidence of faster corrosion kinetics than the non-hydrided reference samples apart from RX A-0·0Sn and pRX A-0·6Sn. The weight gain values after 80 days are compared with those recorded for non-hydrided samples in Table 3. Apart from the two conditions that did not show any accelerated corrosion at 80 days, the material with a hydride rim showed 30-60% increased weight gain compared with the reference non-hydrided conditions. It was also noticeable that samples that showed accelerated corrosion generally displayed a white oxide colour with small regions of black oxide, while alloys that showed no accelerated weight gain displayed a more uniform black oxide similar to their reference conditions. A-0·6Sn-RX experienced a moderate degree of acceleration and showed a grey oxide appearance. The exception is hydrided ZIRLO-SR, which displayed the highest weight gain and greatest acceleration, while the oxide surface was characterised by approximately equal amounts of black and white oxide present in patches (Fig. 16). It was also noticed that compared with the reference samples without a hydride rim, some hydrided alloy conditions showed relatively little oxide weight gain during the first 5 days, with a subsequent increase in their corrosion rate from 5 to 10 days.
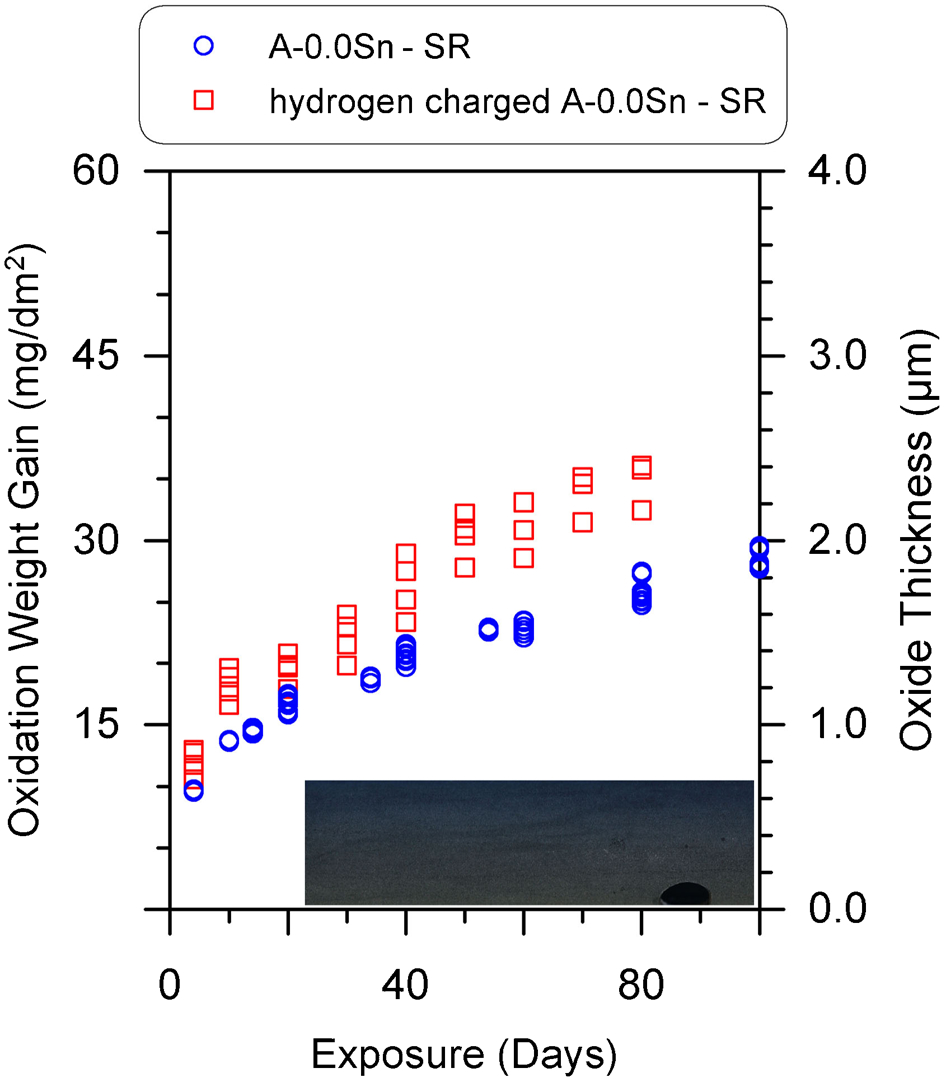
Autoclave corrosion weight gain profiles of hydrided A-0·0Sn-SR, overall [H] ∼700 wt ppm and non-hydrided A-0·0Sn-SR samples: photographs of actual corrosion specimens inserted: hydrided A-0·0Sn-SR after 40 days of autoclave exposure
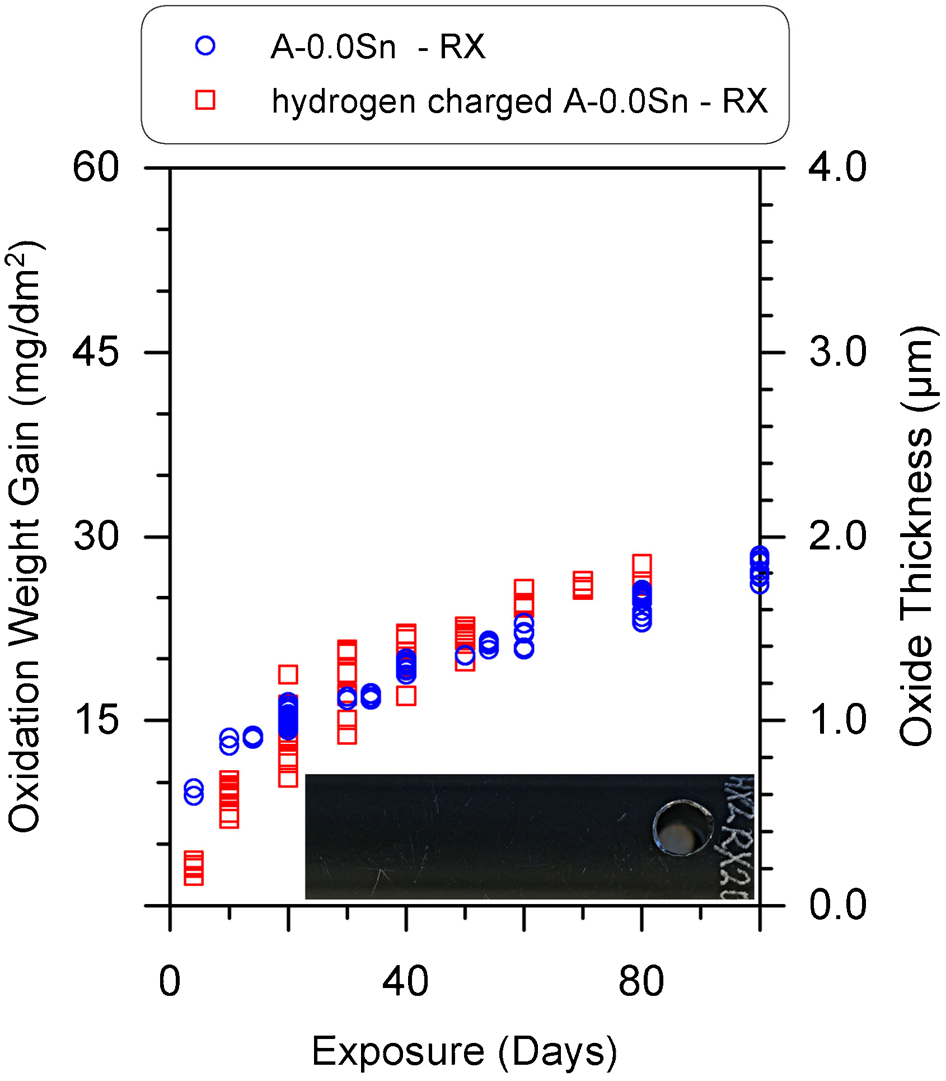
Autoclave corrosion weight gain profiles of hydrided A-0·0Sn-RX, overall [H] ∼600 wt ppm and non-hydrided A-0·0Sn-RX samples: photographs of actual corrosion specimens inserted: hydrided A-0·0Sn-RX after 40 days of autoclave exposure
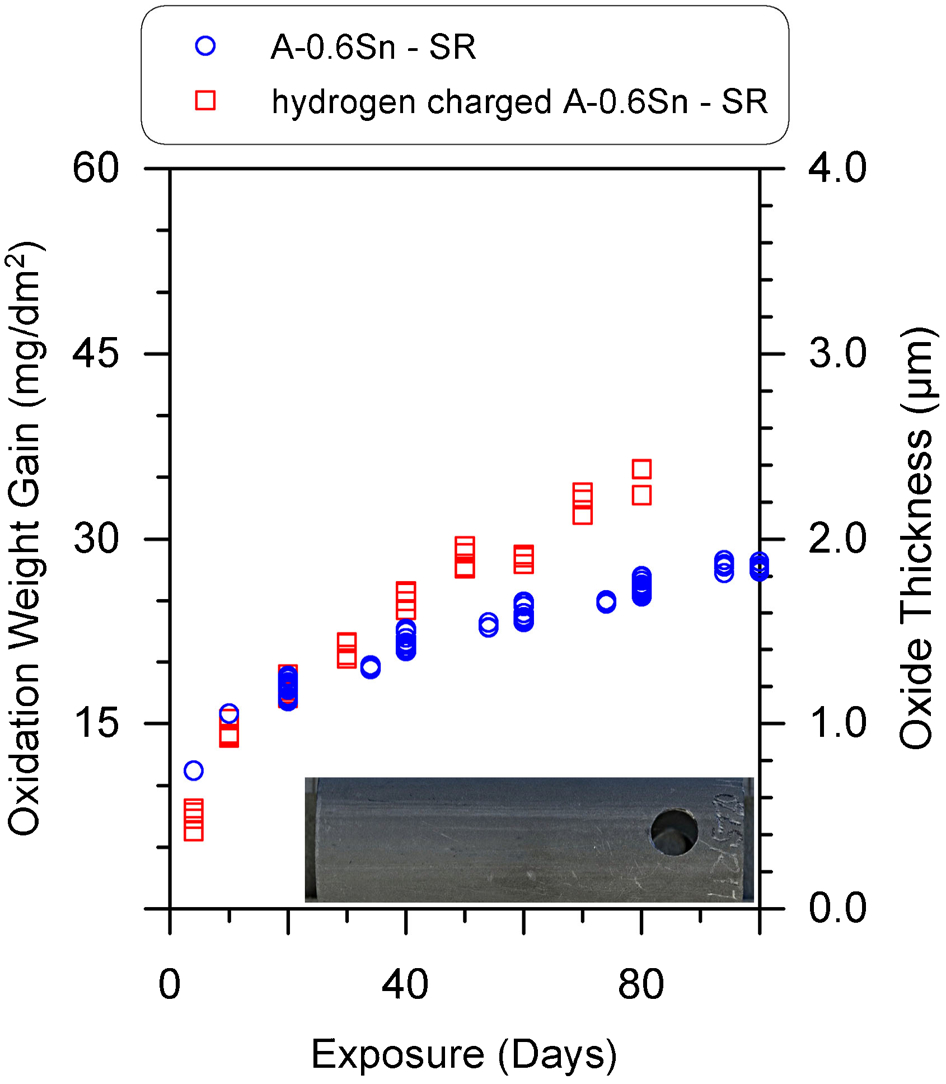
Autoclave corrosion weight gain profiles of hydrided A-0·6Sn-SR, overall [H] ∼700 wt ppm and non-hydrided A-0·6Sn-SR samples: photographs of actual corrosion specimens inserted: hydrided A-0·6Sn-SR after 40 days of autoclave exposure
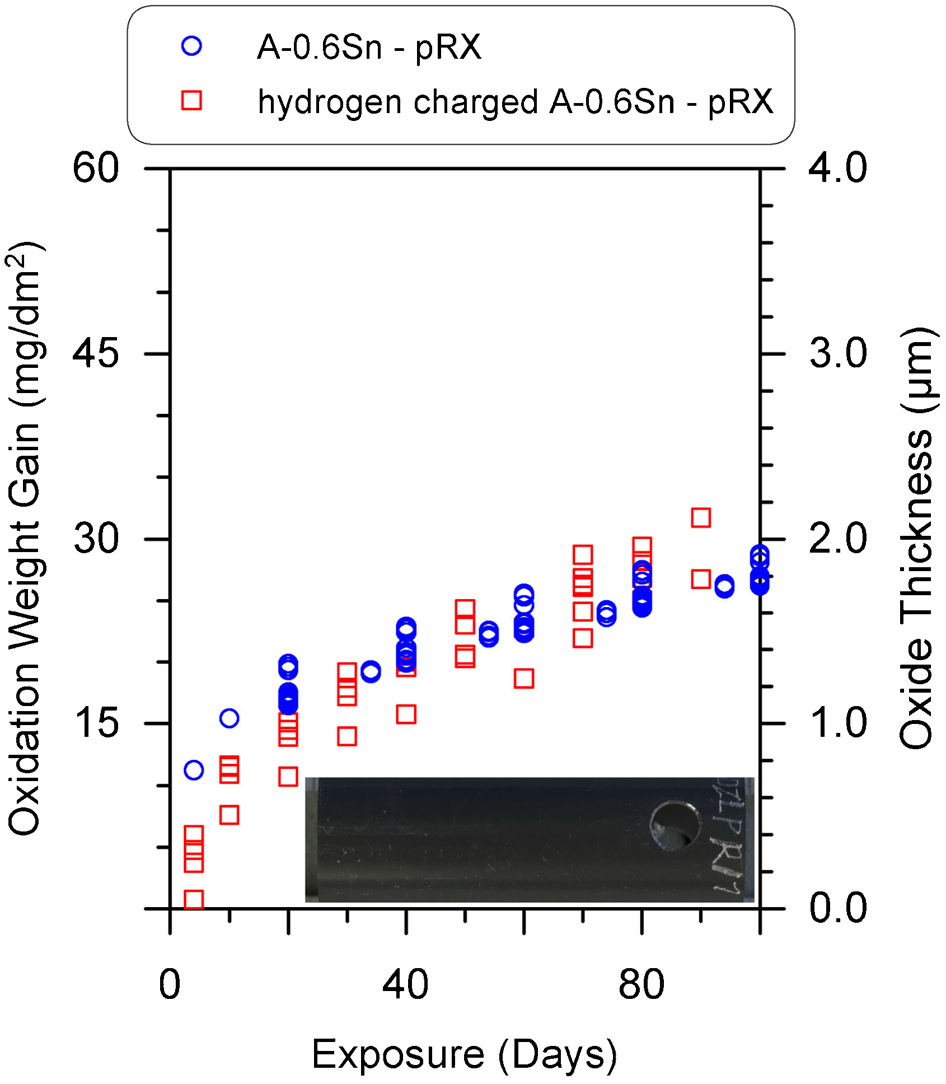
Autoclave corrosion weight gain profiles of hydrided A-0·6Sn-pRX, overall [H] ∼700 wt ppm and non-hydrided A-0·6Sn-pRX samples: photographs of actual corrosion specimens inserted: hydrided A-0·6Sn-pRX after 40 days of autoclave exposure
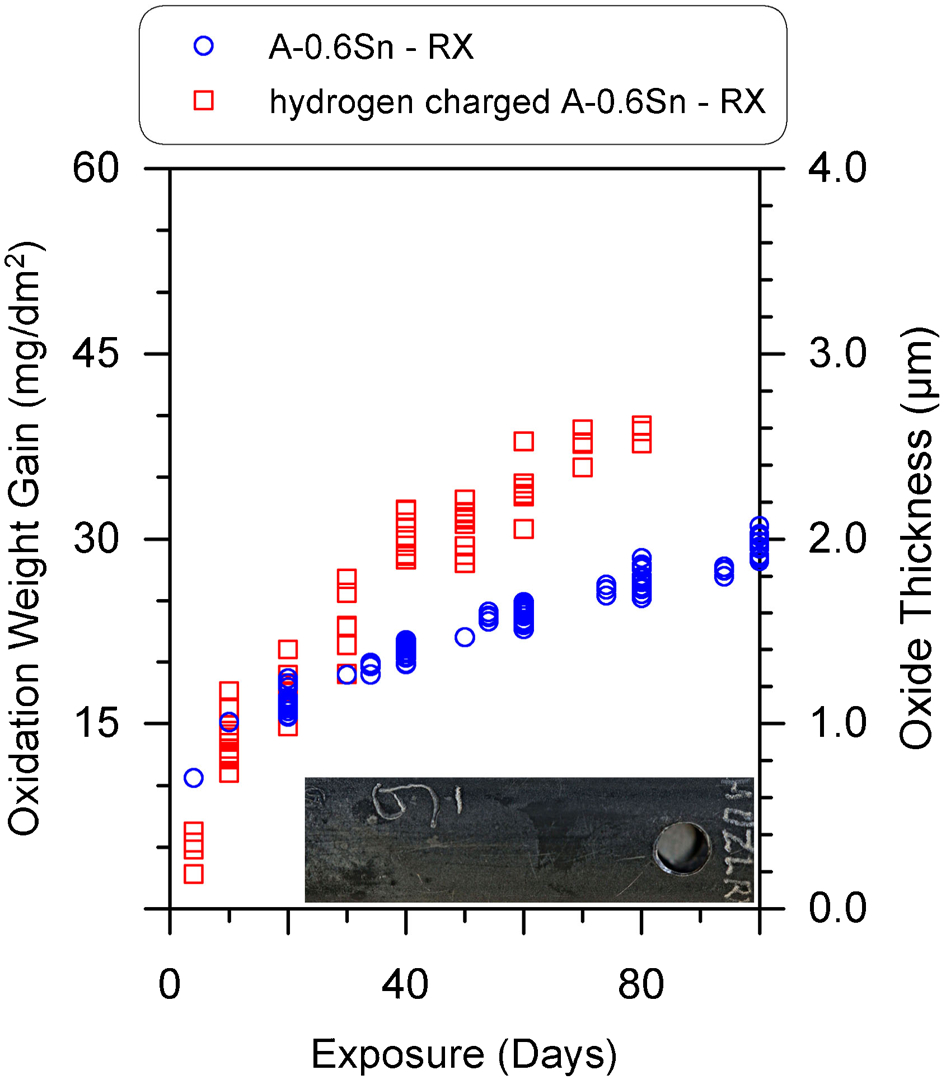
Autoclave corrosion weight gain profiles of hydrided A-0·6Sn-RX, overall [H] ∼650 wt ppm and non-hydrided A-0·6Sn-RX samples: photographs of actual corrosion specimens inserted: hydrided A-0·6Sn-RX after 40 days of autoclave exposure
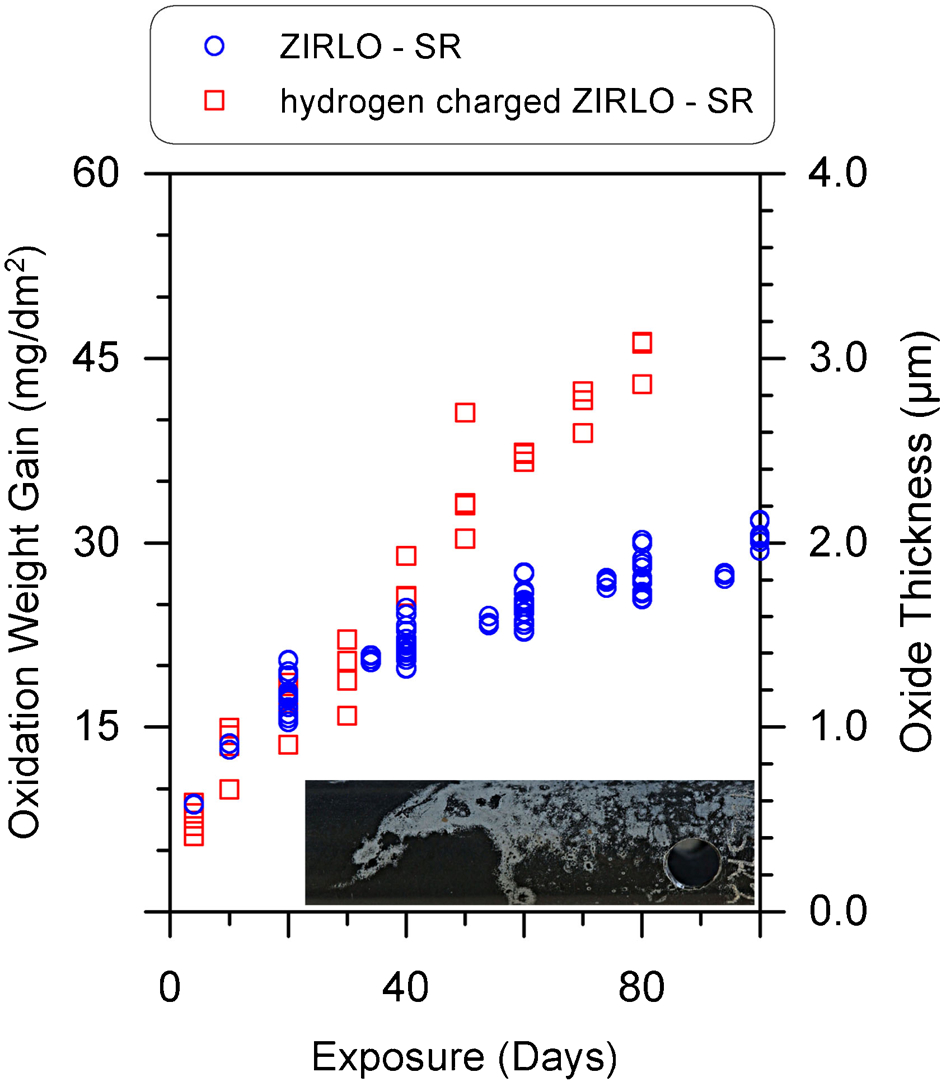
Autoclave corrosion weight gain profiles of hydrided ZIRLO-SR, overall [H] ∼700 wt ppm and non-hydrided ZIRLO-SR samples: photographs of actual corrosion specimens inserted: hydrided ZIRLO-SR after 40 days of autoclave exposure
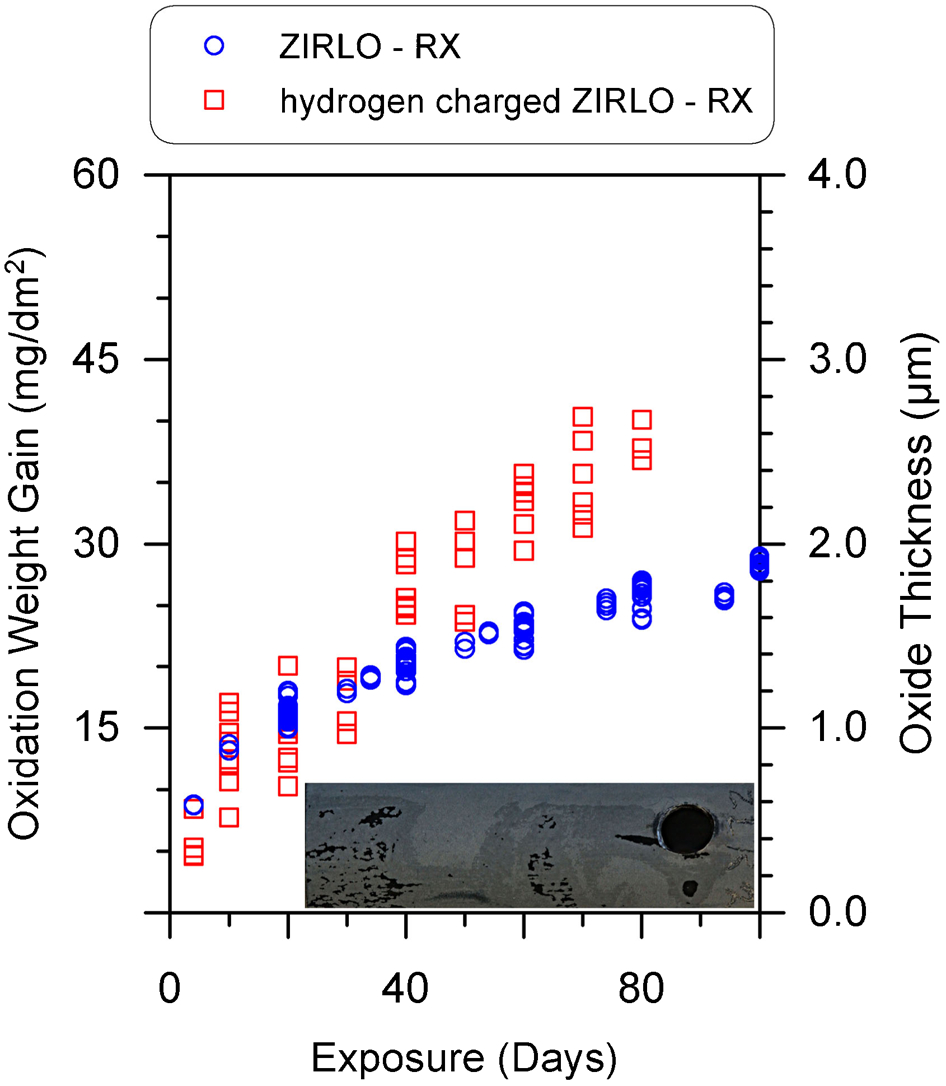
Autoclave corrosion weight gain profiles of hydrided ZIRLO-RX, overall [H] ∼700 wt ppm and non-hydrided ZIRLO-RX samples: photographs of actual corrosion specimens inserted: hydrided ZIRLO-RX after 40 days of autoclave exposure
Autoclave corrosion weight gain results of hydrided materials
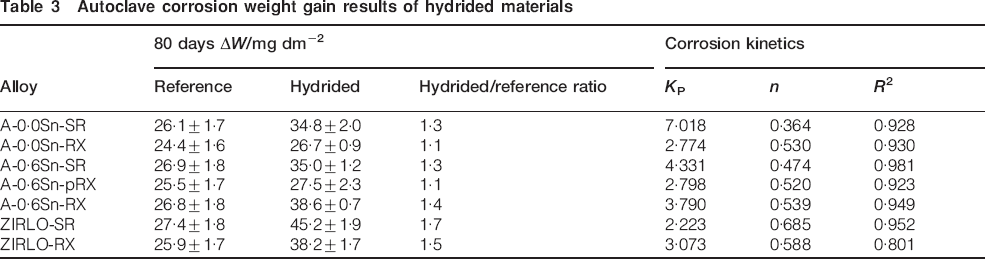
The corrosion kinetics exponent n, rate constants K p and R 2 fitted to the data for each alloy condition are presented in Table 3. In contrast to the non-hydrided reference material, the corrosion rates for most hydrided alloys follow a parabolic law. No correlations were established between n or K p and alloy chemistry or heat treatment conditions. A parabolic rate law is expected for a corrosion process controlled by either the bulk 7 or by grain boundary diffusion through a thickening barrier layer, which is more rapid than bulk diffusion and expected to take predominant role.60,61 It has been argued that the near cubic kinetics of the reference material arises from the reduction in grain boundary area as the oxide thickens, i.e. due to preferential growth of oxide grains. 5 This argument is supported by many studies on the evolution of oxide grain structure where columnar oxide grain is widely observed.62–67 As mentioned earlier, in most cases, the material with a hydride rim showed relatively slow early oxide growth. Figure 18 plots the rate constant K p as a function of the kinetic exponent n. It is interesting to note that there is a relationship between the two and that, in fact, the oxide seems to become more protective (n is smaller) when the diffusion rate of ionic species seems to be faster (larger K p), bearing in mind that the regression analysis process will produce K p and n values that are correlated. This is true not only when comparing between the reference and the hydrided material but also when comparing within each class of material. This behaviour confirms the differences in the oxidation mechanism between zirconium hydride and zirconium metal, with zirconium hydride showing close to classical diffusion controlled (parabolic behaviour). It also suggests that ionic species transport through the oxide is not the rate limiting step when the oxide has grown to a certain thickness.
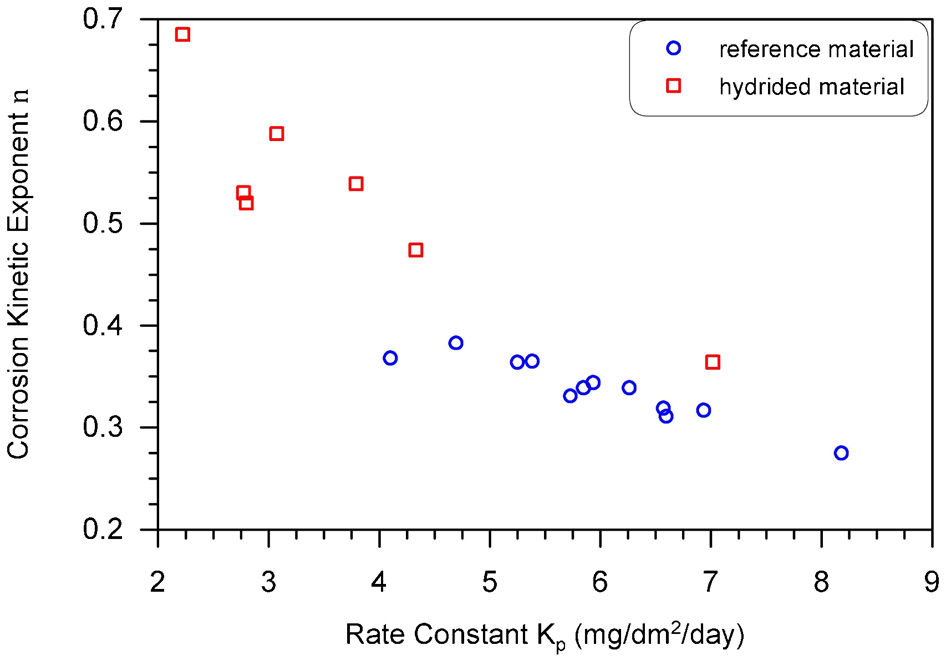
Corrosion kinetic exponent n plotted as function of rate constant K p: data involve all alloys and heat treatment conditions as well as their hydrogen charged counter parts
The observed corrosion acceleration and the general tendency of parabolic towards linear law oxide growth in hydrided material are difficult to explain in view that not all alloys show the same behaviour. Three possible explanations are suggested to account for the differences observed:
since the Pilling–Bedworth ratio is lower, lower compressive stress is expected for oxide grown on hydrided samples, 44 making inward diffusion of oxygen easier 68 as pores on grain oxide grain boundaries 69 might form a network for fast diffusion
oxide formed on hydrided material maintains a relatively uniform thickness and morphology as oxide thickens, providing a relatively constant grain boundary area for oxygen transport, i.e. the diffusion paths have constant tortuosity compared with the oxide formed on zirconium metal 66
transformation from tetragonal to monoclinic oxide happens earlier in hydrided material due to lower compressive stress at the oxide/hydride interface. The subsequent formation of cracks28,29 might enhance the transport of corrosion species to the metal hydride/oxide interface, which would be expected to reduce the protective nature of the oxide with potential parabolic or even linear rate ofcorrosion.
Further investigations such as electron microscopy are required before the last two explanations can be confirmed or rejected. It is possible that more than one route will be active in any given case.
In-pile corrosion performance of zirconium fuel cladding is dependent on the type of reactor, burn-up, coolant chemistry, in-pile location, etc. and should generally be treated on a case by case basis. The progression of corrosion in such case is generally presented as a function of burn-up rather than exposure time. Earlier studies concentrating on zircaloys showed that corrosion acceleration could occur at high burn-up over the range of 35-93 GWd/tU, corresponding to an acceleration factor of 1·5-3 in PWRs (the acceleration factor for in-reactor performance is extrapolated from weight gain of samples with and without breakaway).14,46,70–80 Similar acceleration was also observed in Nb containing alloys such as M5 (M5 is a registered trademark of Areva NP),14,71 ZIRLO, 47 Zr–1·2Bi–0·5Nb and modified Zircaloy-2 with 0·2%Nb, 77 where accelerating factors between 1 and 2·5 were recorded. The differences in corrosion acceleration observed for the alloys in the current study due to the presence of a hydride rim is consistent with data available in the literature for the observed in-pile corrosion acceleration, suggesting that hydrogen build-up may indeed play an important role. Extrapolating further from Refs. 14 and 47, the acceleration factor decreases with decreasing Sn content (<2 for ZIRLO and no acceleration for M5), which also seems to be in agreement with the trends shown in the present study. It must be stated that using weight gain as the sole metric to project in-reactor behaviour at high burn-up may lead to inaccurate comparisons as the weight gain reflects the average of the entire sample. Furthermore, second phase particle evolution due to irradiation damage is a major factor in in-PWR corrosion performance of zirconium alloys, which is not evaluated by autoclave testing.
This comparison of hydrided and non-hydrided material has demonstrated that, in most cases, the hydride rich rim has a detrimental effect on corrosion performance. However, the factor, by which the corrosion kinetics accelerates in the presence of a hydride rich rim, is different for each alloy. Most explanations to date for the accelerated rate of corrosion in the presence of hydride rich rims would suggest that acceleration should be independent of the alloy. This is clearly not the case from the data presented here. Detailed characterisation of the oxide and metal/oxide interface is necessary to identify the mechanisms by which the hydride rich rim affects corrosion.
Summary
Autoclave experiments were performed on Zircaloy-4, ZIRLO and two tin reduced variants of ZIRLO (A-0·6Sn and A-0·0Sn) with various heat treatment conditions. The corrosion weight gain was recorded as a function of the autoclave exposure time. In order to study the effect of a hydride rich rim, ZIRLO, A-0·6Sn and A-0·0Sn tubes were also cathodically charged with hydrogen before autoclave exposure. The main findings can be summarised as follows.
Standard Zr alloys exhibited typical corrosion kinetics with different times to reach transition depending on alloy type and metallurgical condition. The most significant difference was found among ZIRLO, A-0·6Sn and A-0·0Sn, where the time to transition increased systematically and significantly with decreasing Sn content. Sheet Zircaloy-4 exhibited similar transition time as sheet ZIRLO. Materials in an SR condition generally experienced the transition slightly earlier than materials in an RX condition.
The general corrosion kinetics before the transition was similar for most reference materials (i.e. cubic law); hence, the factor dominating the corrosion performance for a single material is the time to reach transition.
Cathodic hydriding facilitated the formation of a hydride rich rim at the outer surface of cladding tubes, simulating end of life conditions of actual reactor fuel cladding. The accumulation of hydrides near the hydride/oxide interface and local hydrogen concentration are in good agreement with the reported conditions of actual samples from nuclear reactors. 51
Most materials with a hydride rich rim exhibited accelerated corrosion, with the extent of the acceleration being dependent on the type of alloy. The differences observed appear to be consistent with data available for high burn-up zirconium cladding. For the RX materials, alloys with higher tin content suffer more from the detrimental effect of a hydride rich rim than low tin alloys. For ZIRLO and A-0·0Sn, it is also observed that SR materials are more sensitive to the accelerating effect than pRX and RX materials; however, this trend is not seen for A-0·6Sn. Despite the overall acceleration, in the initial stages of corrosion, the measured weight gain increased more slowly for hydrided materials than for the reference samples. A relationship between the rate constant K p and kinetic exponent n is observed in both hydrided and reference materials, regardless of the alloy chemistry and heat treatment.
Further investigations are required before mechanistic explanation can be given. Current results suggest that future studies should further investigate the effect of tin and the hydride rich rim on the corrosion kinetics of zirconium alloys.
Footnotes
Acknowledgements
The authors would like to thank the Engineering and Physical Science Research Council (EPSRC) and MoD in the UK for funding the research as part of the Materials for Energy call (research code no. EP/E036171/1). The project would not have been possible without the strong support of our industrial project partners (in alphabetical order): EDF, National Nuclear Laboratory, Rolls-Royce, Serco and Westinghouse, who have provided substantial in kind and financial support, and our academic project partners from the University of Oxford and the Open University.