
Abstract
The effect of alloying elements including aluminium, chromium, cobalt, indium, molybdenum, titanium and vanadium on the corrosion behaviour of a synthetic 90/10 Cu–Ni alloy in natural sea water and in artificial saline solutions (containing 2·86 wt-%NaCl and 0 or 2260 ppm sulphate) was investigated. Synthetic alloys were prepared in an induction furnace, under an Ar/7 vol.-%H2 atmosphere in cylindrical boron nitride crucibles and were heat treated in a tube furnace. The electrochemical measurements were conducted using aerated electrolytes at room temperature using a potential range between −1·5 and +2·5 V(SCE). Tafel extrapolation, cyclic polarisation, cyclic voltammetry and linear polarisation electrochemical techniques were applied in this investigation. It was concluded that the corrosion behaviour of the synthetic alloys depends on the alloying element added to the alloy. Cobalt was detected to be the most effective alloying element and aluminium may be used as an alloying element only in the absence of sulphate. Chromium could be used to some extent while the use of molybdenum, indium, vanadium or titanium as alloying elements did not improve the corrosion properties of 90/10 Cu–Ni alloy.
Keywords
Introduction
Commercial copper–nickel alloys contain iron as an alloying element. One such 90/10 Cu–Ni commercial alloy is the C70600. The electrochemical behaviour of C70600 has been investigated recently in the presence and absence of sulphate.1 Subsequently, the role of iron as an alloying element to provide corrosion protection to synthetic 90/10 Cu–Ni alloys in saline solutions and sea water was also studied.2
The addition of suitable amounts of alloying elements to improve the corrosion resistance and other properties of copper–nickel alloys even in aggressive environments is being investigated. Ismail et al.3 studied the effect of nickel content of the copper–nickel alloys in alkaline sulphate solutions (0·25M Na2SO4+0·1M NaOH; pH 12). It was concluded that the corrosion resistance is increased with increasing nickel content in such alloys, and the passive film resistance is increased as the immersion time increased.
McCafferty4 developed a mathematical model to explain the passivity mechanism of nickel binary alloys on the assumption of the formation of Ni–O–Ni bridge in the oxide film and its connectivity. The connectivity is based on the insertion of the second ion into the oxide film. To avoid discontinuity in the passive layer, the alloy should contain at least 27 wt-%Ni.
Many researchers5 – 11 studied the corrosion characteristics of iron modified 90/10 Cu–Ni alloys in an attempt to explain the role of iron and identify the mechanism by which the addition of iron increases the corrosion resistance.
Murakami et al.12 examined the effect of nickel and beryllium on flow induced localised corrosion behaviour of copper alloys. It has been reported that nickel increases the corrosion resistance of copper alloys, but too high nickel content causes pitting corrosion. Addition of beryllium leads to formation of a dense protective film on the alloy surface and the maximum erosion depth decreased.
Burleigh and Waldeck13 studied the effect of alloying elements on the resistance of a 90/10 Cu–Ni alloy to sea water, and compared their effects with the effect of iron addition. Gampbell14 compared the corrosion resistance between copper and aluminium alloys and investigated additions of silicon, niobium and iron. Callcut15 reported that when manganese is added to copper–nickel alloys as deoxidant and desulphuriser, it improves the corrosion resistance in sea water. Chromium is one of the alloying elements used in copper–nickel alloys. The purpose of chromium is to replace the iron in the alloy in order to further increase the impingement corrosion resistance. The other purpose of adding chromium in these alloys is to improve the mechanical properties.16
Impurities with minor amounts of carbon, sulphur and phosphorus have no effect on the corrosion behaviour of copper–nickel alloys,16 but Zhu et al.17 found that the impurities affect the Cu2O scale by introducing porosity in the oxide scale and decrease the stability of this oxide.
In other studies,2,18 the corrosion rates for copper–nickel alloy without iron content were 0·0607, 0·0425 and 0·0495 mm/year in 0 ppm sulphate artificial saline solution, 2260 ppm sulphate artificial saline solution and Nova Scotia (N.S.) sea water respectively. Also, the microstructure of the corrosion product formed on the surface of the alloy shows a porous and cracked outer layer. By adding even a small amount of iron (0·25 wt-%), the corrosion rate drops to lower values in all three solutions. Then the corrosion rates were 0·0560, 0·0401 and 0·0470 mm/year in 0 ppm sulphate artificial saline solution, 2260 ppm sulphate artificial saline solution and N.S. sea water respectively. The corrosion rate values continued to drop as the amount of iron in the alloy increased. Also, the microstructure of the corrosion product formed on the surface of the alloy shows a cracked layer, but it has less porosity and better integrity when iron is added.
From all previous studies, the different behaviours of the various elemental additions to 90/10 Cu–Ni alloys beg the question why some of the addition elements follow the n-type dopant theory while for other elements the theory does not work.
The following new concepts are introduced in the present work:
transition metals that include the three elements in Cu–Ni–Fe alloys have a unique characteristic, which is that they have incompletely filled d subshells or give rise to ions with incompletely filled d subshells
because of the electron configuration in these transition metals, each row of transition metals across the periodic table, the atomic number increases, but the ionic and atomic radii change less dramatically, especially for Cr, Mn, Fe, Co, Ni and Cu, which have approximately the same atomic and ionic radii19
the ionisation energies increase slightly from left to right in each series of transition metals, which is also related to the electron configuration (reading from left to right, the electrons added to the inner 3d subshell shield the 4s electrons from the increasing nuclear charge somewhat more effectively than outer shell electrons can shield one another).
Based on the above concepts, for the present study, seven alloying elements were selected to replace iron and to study their effects on the corrosion behaviour of 90/10 Cu–Ni alloys in marine environments. The selected elements are cobalt (Co), chromium (Cr), titanium (Ti), molybdenum (Mo), vanadium (V), aluminium (Al) and indium (In).
Experimental
Synthetic alloys were prepared from the two main elements (copper and nickel) which were further alloyed with other elements. The alloying elements used along with the Cu–Ni master alloy are chromium (Cr), aluminium (Al), cobalt (Co), titanium (Ti), molybdenum (Mo), vanadium (V) and indium (In). An addition of 2 wt-% of each of these alloying elements was made to 88 wt-%Cu and 10 wt-%Ni to form seven different alloys. The alloying elements were mixed and were placed in a cylindrical boron nitride crucible which was placed in an induction furnace. The furnace chamber was evacuated and was purged using argon that contained 7% hydrogen. The advantage of using this reduction atmosphere is to avoid oxidation as was proven by a previous research in this laboratory.18 The melting temperature in the induction furnace ranged from 1375 to 1525°C depending on the melting temperature of the alloy under preparation, and the time holding the crucible at the predetermined temperature was 30 min to ensure good homogeneity. The alloy then was rapidly cooled to room temperature by removing the crucible from the induction zone of the furnace to a cool section. All the synthetic alloys were homogenised after the alloying process for 10 h at 950°C in a tube furnace under the same protective atmosphere that was used in the alloying process.
The synthetic alloyed samples were cut to small pieces of ∼2 mm in thickness and 14 mm in diameter. The surfaces of synthetic alloy samples were ground using 240, 320, 400 and 600 grit SiC papers and polished using 1 and 0·05 μm alumina suspensions followed by cleaning ultrasonically in a distilled water bath.
Artificial saline solutions were prepared using distilled water with 2·86 wt-%NaCl and 0 and 2260 ppm sulphate. Also natural sea water collected from the open Atlantic Ocean in Nova Scotia was used as an electrolyte. All experiments were carried out in aerated electrolytes (the average oxygen dissolved was about 8·2 mg L−1) and at room temperature (22±1·1°C). The pH of the natural sea water was 6·8, and for the synthetic saline solution, the pH ranged between 4·76 and 6·76 depending on the sulphate content.
A potentiostat model 273A (EG & G PARC, Princeton Applied Research) was used for electrochemical measurements applying electrochemical techniques such as Tafel extrapolation (TE), linear sweep polarisation, cyclic voltammetry (CV) and cyclic polarisation (CP) were used. The potentiostat was controlled by Corrware software. A three electrode electrochemical cell was used (the standard commercial type) for all the electrochemical measurements. Only 1 cm2 of the sample polished surface was exposed to the electrolyte through a hole by mounting the sample in a teflon holder. The counter electrode was made of a graphite rod having a surface area of 16·32 cm2. A saturated calomel electrode (SCE) was used as a reference electrode equipped with a Luggin capillary.
After securing the samples in the electrochemical cell and achieving an equilibrium potential value, a potential scan in the range between −0·25 and +0·75 V(SCE) was applied in the linear polarisation (LP) experiments at a scan rate of 1·0 mV s−1. The corresponding current density was measured and the purpose of the LP experiments is to determine the passivation and transpassive potential values. A potential range between −1·50 and +0·8 V(SCE) and a scan rate of 1 mV s−1 were used for CP measurements. The purpose of the CP experiments is to get the corrosion and protection potentials. A potential range between −0·5 and +0·02 V(SCE) was used for TE measurements. The purpose of the TE experiments is to calculate the corrosion rates from the i corr, anodic and cathodic slopes data produced by such experiments. A potential range between −1·50 and +1·50 V(SCE) and a scan rate of 10 mV s−1 were used for CV measurements. The corresponding current density was measured and used to determine the nature of electrochemical reactions.
Results and discussion
The methodology in presenting the results consists of obtaining experimental evidence for Cu–Ni synthetic alloys that contain 2 wt-% of the alloying element and comparing the results with those that contain iron. However, the only way that a 90/10 Cu–Ni alloy can contain iron in a single phase is by quenching these alloys. This has been done in a previous study in this laboratory.2
Potentiodynamic (linear) polarisation
The potentiodynamic (linear) polarisation plots for the seven synthetic alloys and that of the Cu–Ni–2·0 wt-%Fe[Q] alloy (results from a previous study2) in the 0 ppm, the 2260 ppm sulphate artificial saline solution and N.S. sea water are shown in Figs. 1–3 respectively.
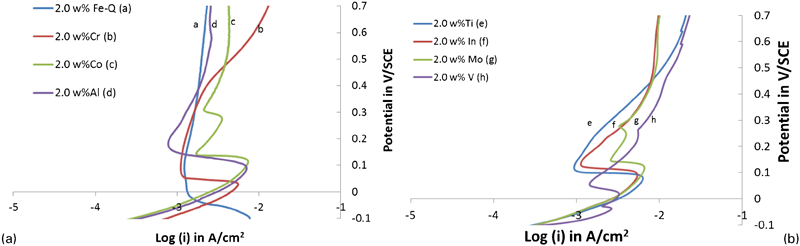
Linear sweep polarisation plots for synthetic alloys in 0 ppm sulphate artificial saline solution
Linear sweep polarisation plots for synthetic alloys in 2260 ppm sulphate artificial saline solution
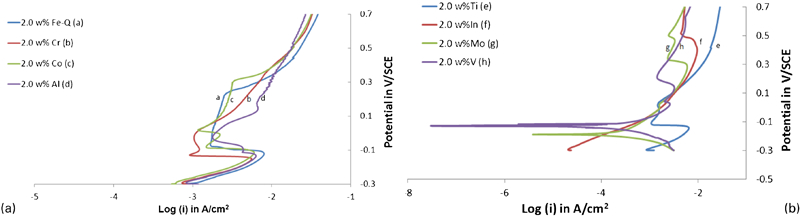
Linear sweep polarisation plots for synthetic alloys in N.S. sea water
The LP plots in the 0 ppm sulphate artificial saline solution (Fig. 1) show that the behaviours of Cu–Ni–2·0 wt-%Co, Cu–Ni–2·0 wt-%Mo, Cu–Ni–2·0 wt-%In and Cu–Ni–2·0 wt-%Al alloys were similar to that of the Cu–Ni–2·0 wt-%Fe[Q] alloy. The plots for all of these alloys show three regions, which are the active dissolution region, the prepassivation region and the passivation region. In other words, there is no transpassive region in the plots in the absence of sulphate. This indicates that the passive film formed on the surface of the alloys has good integrity and no breakdown occurred. It can also be seen that Cu–Ni–2·0 wt-%Fe[Q] has better passivity than all the other alloys since it exhibited the lowest current density value in the passivation region. The Cu–Ni–2·0 wt-%Co has an intermediate passivation current density value, and Cu–Ni–2·0 wt-%Mo and Cu–Ni–2·0 wt-%In have the highest passivation current density among these alloys. The behaviour of Cu–Ni–2·0 wt-%Al alloy in the 0 ppm sulphate artificial saline solution shows that this alloy is less protected than Cu–Ni–2·0 wt-%Fe[Q] alloy, but it was very close to it and better than all the other alloys.
Cu–Ni–2·0 wt-%Ti, Cu–Ni–2·0 wt-%V and Cu–Ni–2·0 wt-%Cr alloys exhibited satisfactory corrosion resistance, but were less protected than the other five alloys in the 0 ppm sulphate artificial saline solution. The Cu–Ni–2·0 wt-%Cr alloy had a passivation range where the passive film was stable [between 0·1 and 0·4 V(SCE)]. The Cu–Ni–2·0 wt-%V alloys had a very limited range of passivation potential at a relatively high current density value, as can be seen in Fig. 1. Thus, the vanadium and titanium containing alloys were the least protected alloys in this environmental condition (0 ppm sulphate artificial saline solution).
In the artificial saline solution that contained 2260 ppm sulphate as an electrolyte, the LP plots of the seven synthetic alloys along with that of Cu–Ni–2·0 wt-%Fe[Q] alloy for comparison are shown in Fig. 2 and consisted of four regions, including the transpassive region. It can be observed that the prepassivation potential values for both the Cu–Ni–2·0 wt-%Co and Cu–Ni–2·0 wt-%In alloys were higher than those of the other six alloys. For the Cu–Ni–2·0 wt-%In alloy, the potential was +0·17 V(SCE). The prepassivation potential value for the Cu–Ni–2·0 wt-%Co alloy was +0·14 V(SCE), and the value ranged between +0·09 and +0·12 V(SCE) for the other six alloys, including the Cu–Ni–2·0 wt-%Fe[Q] alloy.
As can be seen from Fig. 2, Cu–Ni–2·0 wt-%Co alloy was the most protected alloy in the 2260 ppm sulphate artificial saline solution. It showed the lowest current density value in the passivation region, and the passivation potential range is the largest compared with the other alloys. The Cu–Ni–2·0 wt-%Co alloy is the only one which had an advantage over the Cu–Ni–2·0 wt-%Fe[Q] alloy. While all the alloys showed a good corrosion resistance in this environment, Cu–Ni–2·0 wt-%Cr, Cu–Ni–2·0 wt-%Al and Cu–Ni–2·0 wt-%Ti had the narrowest passivation potential range.
The LP plots for the synthetic alloys in N.S. sea water showed comparable results with those in the 2260 ppm sulphate artificial saline solution, with some slight differences, most likely due to the fact that the sea water contains, is addition to sodium sulphate and sodium chloride which were used to prepare the artificial saline solutions, other substances, such as potassium, magnesium and many others.1
In the N.S. sea water, the behaviour of the Cu–Ni–2·0 wt-%Co alloy was similar to that of the Cu–Ni–2·0 wt-%Fe[Q] alloy. The behaviour of both Cu–Ni–2·0 wt-%Ti and Cu–Ni–2·0 wt-%Al was similar to that one for Cu–Ni–2·0 wt-%Cr alloys. They showed low passivation current density values, but the passivation potential range was lower than that of Cu–Ni–2·0 wt-%Co alloy as can be seen in Fig. 3. It also can be recognised from the behaviour of these alloys in N.S. sea water environment that the remaining three alloys (Cu–Ni–2·0 wt-%V, Cu–Ni–2·0 wt-%Mo and Cu–Ni–2·0 wt-%In) are not suitable as alternatives for Cu–Ni–2·0 wt-%Fe[Q] alloy because of their weak passivity.
Based on the LP plots in the three different environments, it can be concluded that Cu–Ni–2·0 wt-%Co was the most protected alloy in both the 2260 ppm sulphate artificial saline solution and the N.S. sea water, and it could replace the Cu–Ni–2·0 wt-%Fe[Q] alloy. Also, it can be concluded that the Cu–Ni–2·0 wt-%Co alloy may be used in the 0 ppm artificial saline solution because of its comparable behaviour with the Cu–Ni–2·0 wt-%Fe [Q] alloy. The Cu–Ni–2·0 wt-%Al alloy may be used only in clean sea water (without sulphate content) because it exhibited better protection than the Cu–Ni–2·0 wt-%Co alloy. The use of Cu–Ni–2·0 wt-%Mo, Cu–Ni–2·0 wt-%In, Cu–Ni–2·0 wt-%V or Cu–Ni–2·0 wt-%Ti alloys in any of the three environments is not suitable. The behaviour of Cu–Ni–2·0 wt-%Cr alloy indicated that this alloy could be used to some extent.
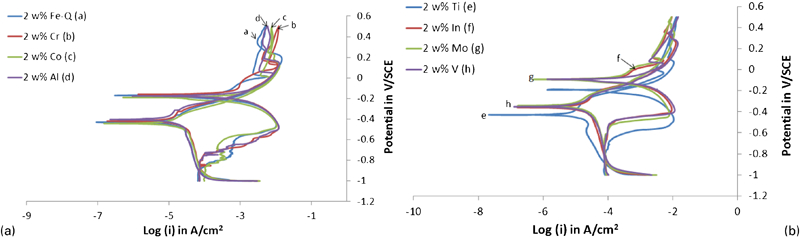
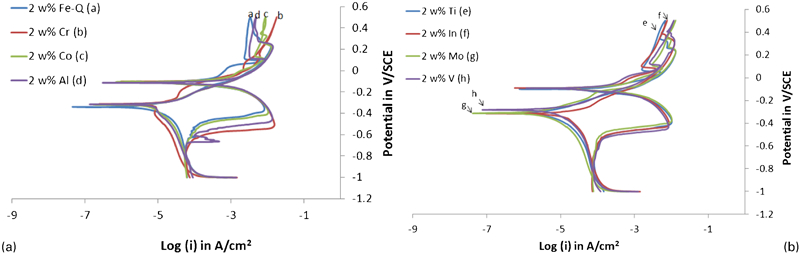
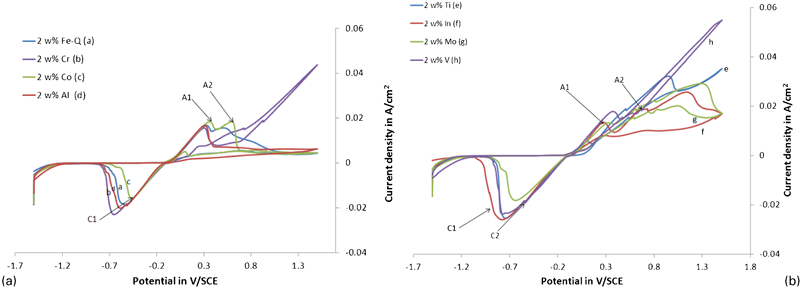
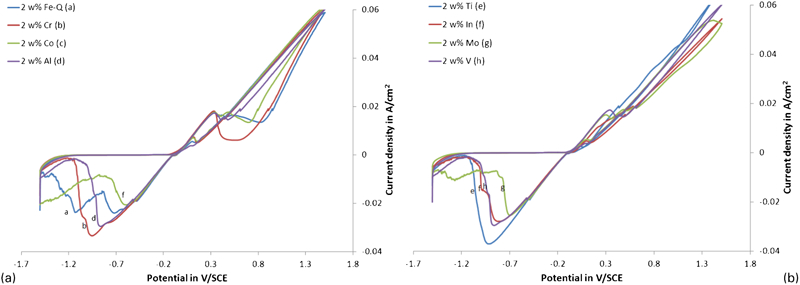
Cyclic polarisation
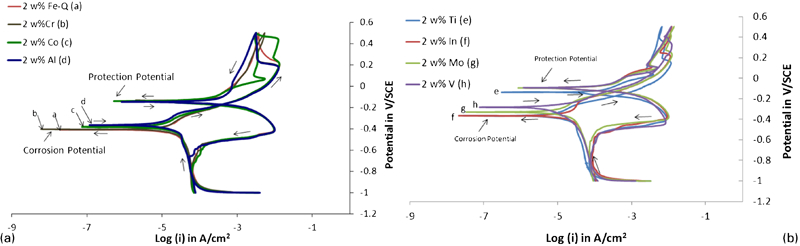
Figures 4–6 show the CP plots for Cu–Ni synthetic alloys with 2 wt-% of different alloying elements (Co, Al, Mo, In, Ti, V and Cr) and that of Cu–Ni–2·0 wt-%Fe[Q] alloy, in 0 ppm sulphate artificial saline solution, 2260 ppm sulphate artificial saline solution and N.S. sea water respectively. The protection potential denotes the susceptibility of an alloy to pitting or crevice corrosion and it is defined as the potential at which the current density becomes equal to the passive current density during a CP test.20 The magnitude of the hysteresis loop formed between the forward and the reverse scans also determines the susceptibility of the alloy to pitting and crevice corrosion.21 In the event that the reverse scanning is located in more positive potentials than the forward potential scanning, the alloy is totally free of pitting and crevice corrosion.22 This behaviour usually occurs in the case of iron, nickel or cobalt based alloys and it is observed in Figs. 4–6. The protection potential is clearly obtained and it is more positive than the corrosion potential for the same alloy.
Cyclic polarisation plots for synthetic alloys in 0 ppm sulphate artificial saline solution
Cyclic polarisation for synthetic alloys in 2260 ppm sulphate artificial saline solution
Cyclic polarisation plots for synthetic alloys in N.S. sea water
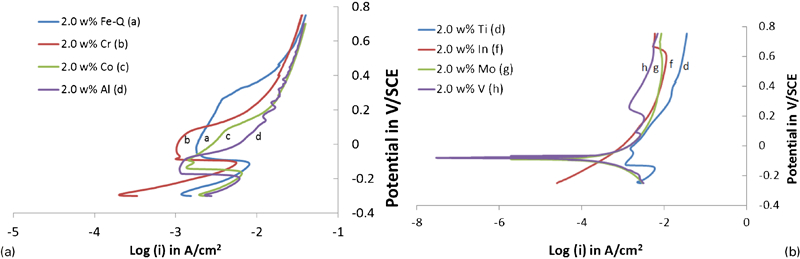
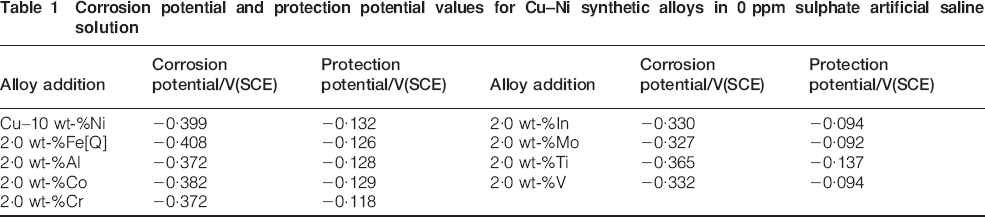
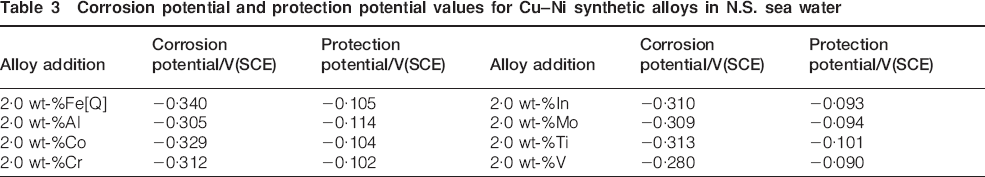
In the absence of sulphate in the solution (0 ppm sulphate artificial saline solution; Fig. 4), the difference between the corrosion potential and the protection potential was the largest for the Cu–Ni–2·0 wt-%Fe[Q] synthetic alloy. It can be seen from Table 1 that the Cu–Ni–2·0 wt-%Al, the Cu–Ni–2·0 wt-%Cr and the Cu–Ni–2·0 wt-%Co alloys can be used as alternative alloys instead of the Cu–Ni–2·0 wt-%Fe[Q] alloy because of the reasonable potential difference between their protection potential and corrosion potential values. These results are consistent with the results obtained from the LP plots. The Cu–Ni–2·0 wt-%Ti alloy was observed to be the least protected alloy because of its limited protection range. This result is also consistent with the results obtained by the LP technique. This technique showed an increase in the current density for this alloy and the transpassive region appearing after a very limited passivation potential range. The alloys Cu–Ni–2·0 wt-%Mo, Cu–In–2·0 wt-%In and Cu–Ni–2·0 wt-%V exhibited small potential difference values, but still higher than those of the Cu–Ni–2·0 wt-%Ti alloy.
Corrosion potential and protection potential values for Cu–Ni synthetic alloys in 0 ppm sulphate artificial saline solution
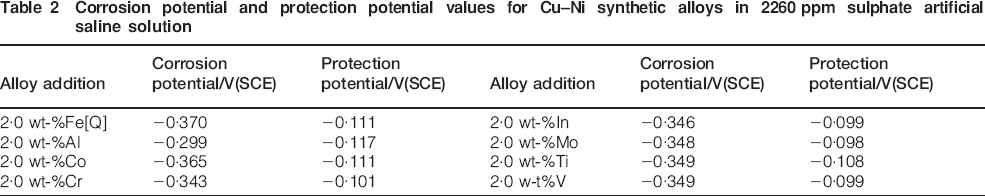
In the artificial saline solution which contained 2260 ppm of sulphate (Fig. 5), the only alloy which was able to compete with the Cu–Ni–2·0 wt-%Fe[Q] alloy was the Cu–Ni–2·0 wt-%Co alloy, because of the similar differences between their respective corrosion potential and protection potential values. This result is consistent with the results of the LP technique, which shows the similarity in behaviour of both alloys. It appears that Cu–Ni–2·0 wt-%Al and Cu–Ni–2·0 wt-%Cr alloys are not suitable for use in a 2260 ppm sulphate artificial saline solution, as it was also the case in the 0 ppm sulphate artificial saline solution.
The corrosion potential and the protection potential results for the synthetic alloys in the 2260 ppm sulphate artificial saline solution are shown in Table 2. The results show that by adding sulphate to the artificial saline solution, the corrosion potential is shifted to less negative values for Cu–Ni–2·0 wt-%Fe[Q], Cu–Ni–2·0 wt-%Co, Cu–Ni–2·0 wt-%Al, Cu–Ni–2·0 wt-%Cr and Cu–Ni–2·0 wt-%Ti. On the other hand, the corrosion potential values were shifted to more negative values for the other three alloys (Cu–Ni–2·0 wt-%V, Cu–Ni–2·0 wt-%In and Cu–Ni–2·0 wt-%Mo). A significant change was observed for the Cu–Ni–2·0 wt-%Al alloy in the 2260 ppm sulphate artificial saline solution. The corrosion potential value shifted from −0·370 to −0·299 V(SCE).
Corrosion potential and protection potential values for Cu–Ni synthetic alloys in 2260 ppm sulphate artificial saline solution
In N.S. sea water (Fig. 6), similar results to those obtained in the 2260 ppm sulphate artificial saline solution environment were observed. The only alloy which is competitive, in this environment, with the Cu–Ni–2·0 wt-%Fe[Q] alloy is the Cu–Ni–2·0 wt-%Co alloy, because the latter exhibited larger difference between its corrosion potential and protection potential values among all the alloys except the Cu–Ni–2·0 wt-%Fe alloy. This result is also consistent with the results of the LP technique, which showed the similar behaviour of the two alloys in the sea water environment. It appears that the other six alloys are not suitable for use in the N.S. sea water because of the limited difference between their corrosion potential and their protection potential values for these alloys.
The corrosion potential and the protection potential results for the synthetic alloys in the N.S. sea water are shown in Table 3. The results show that even if the behaviour of these synthetic alloys is very similar in both the 2260 ppm sulphate artificial saline solution and the N.S. sea water, there is a difference in the corrosion potential values. The corrosion potential values shifted to less negative values when N.S. sea water was used instead of the 2260 ppm sulphate artificial saline solution. Again the reason for this slight shift is probably the contribution of other substances along with the sodium sulphate and the sodium chloride that are contained in the N.S. sea water.1
Corrosion potential and protection potential values for Cu–Ni synthetic alloys in N.S. sea water
Cyclic voltammetry
It is important to know what kind of reactions leads to the formation of the corrosion films on the surface of the synthetic alloys. For this reason, CV was performed for all the synthetic alloys in the three electrolytes. Figure 7 shows the cyclic voltammograms of the Cu–Ni synthetic alloy containing 2 wt-% of various alloying elements (Co, Al, Mo, In, Ti, V and Cr), and of the Cu–Ni–2·0 wt-%Fe[Q] alloy, in a 0 ppm sulphate artificial saline solution. The results clearly show that the reactions taking place with the eight different alloys are not ideally reversible as the anodic current peaks are not equal to the cathodic current peaks and the separation between the anodic and the cathodic potentials (E pa–E pc) at room temperature is not equal to 59/n mv. There was overlapping between the anodic and the cathodic paths for some alloys in their voltammograms (Cu–Ni–2·0 wt-%Co, Cu–Ni–2·0 wt-%Cr and Cu–Ni–2·0 wt-%V).
Cyclic voltammogram for different Cu–Ni synthetic alloys in 0 ppm sulphate artificial saline solutions at scan rate of 10 mV s−1
It can be observed that there is more than one anodic peak in the area of the anodic polarisation region and more than one peak in the area of the cathodic polarisation region for all the synthetic alloys, except for the Cu–Ni–2·0 wt-%Al alloy, which has only one peak in the anodic region and one peak in the cathodic region. There was one anodic peak for the Cu–Ni–2·0 wt-%Al alloy, which had a potential value of +0·31 V(SCE), and one cathodic peak which had a potential value of −0·58 V(SCE). The anodic peak could be attributed to the formation of Al2O3 and the cathodic peak could be attributed to the following reaction


Titanium containing synthetic alloys showed two anodic peaks for the voltammogram of Cu–Ni–2·0 wt-%Ti alloy in the 0 ppm sulphate artificial saline solution, which had potential values of +0·51 and +0·95 V(SCE). There were also four cathodic peaks in the voltammogram which had the following potential values: +0·54, +0·15, −0·54 and −0·75 V(SCE). The peaks that appeared at potential values of +0·51 and −0·54 V(SCE) could be attributed to both reactions (3) and (1) respectively.
In the case of indium containing synthetic alloys, there were four anodic peaks in the voltammogram of Cu–Ni–2·0 wt-%In alloy in the 0 ppm sulphate artificial saline solution which had potential values of +0·27, +0·68, +0·73 and +1·14 V(SCE). There were three cathodic peaks in the voltammogram which had the following potential values: +0·38, −0·54 and −0·75 V(SCE). The peaks that appeared at potential values of +0·27, +0·68 and −0·54 V(SCE) could be attributed to reactions (2), (3) and (1) respectively.
Examination of molybdenum containing alloy (Cu–Ni–2·0 wt-%Mo) shows four anodic peaks for the voltammogram of the alloy in the 0 ppm sulphate artificial saline solution which had potential values of +0·33, +0·60, +0·79 and +1·30 V(SCE). There were five cathodic peaks in the voltammogram which had the following potential values: +0·86, +0·75, +0·59, −0·63 and −0·78 V(SCE). This indicates that the reactions are becoming more complex. However, the peaks that appeared at potential values of +0·33, +0·60 and −0·63 V(SCE) could be attributed to reactions (2), (3) and (1) respectively.
There were three anodic peaks for the voltammogram of Cu–Ni–2·0 wt-%V alloy in the 0 ppm sulphate artificial saline solution which had potential values of +0·37, +0·57 and +0·66 V(SCE). There were also three cathodic peaks in the voltammogram which had the following potential values: +0·48, −0·54 and −0·78 V(SCE). From all the peaks that were present, those that appeared at potential values of +0·37, +0·57 and –0·54 V(SCE) could be attributed to reactions (2), (3) and (1) respectively.
Figure 8 shows the cyclic voltammograms of the Cu–Ni synthetic alloy containing 2 wt-% of various alloying elements (Co, Al, Mo, In, Ti, V and Cr), along with the Cu–Ni–2·0 wt-%Fe[Q] alloy, in a 2260 ppm sulphate artificial saline solution.
Cyclic voltammogram for different Cu–Ni synthetic alloys in 2260 ppm sulphate artificial saline solutions at scan rate of 10 mV s−1
In the 2260 ppm sulphate artificial saline solution, the peaks became more complicated and distorted for all the synthetic alloys, as happened also for Cu–Ni–Fe synthetic alloys, which made it difficult to separate these peaks from one another. It can be noted that the current density values of most of the anodic peaks for the different synthetic alloys increased to more positive values in a 2260 ppm sulphate artificial saline solution. Also, when immersed in this solution, the current density values of the cathodic peaks changed to more negative values. This increase in the current density values can be explained by increases in the corrosion rates under these conditions.
It can be concluded from the CV results that the reactions taking place on the surface of the Cu–Ni synthetic alloys in the 0 ppm sulphate artificial saline solution and the 2260 ppm sulphate artificial saline solution are complicated to allow interpretation of the mechanism of corrosion.
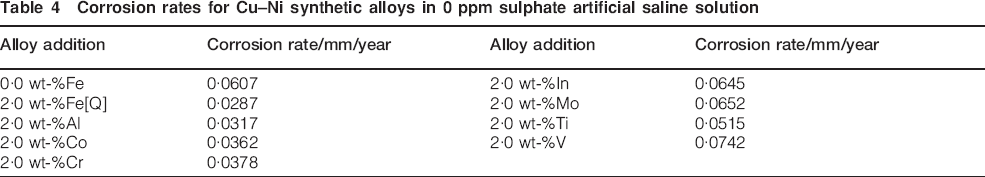
Corrosion rates
The corrosion rate was calculated for samples in the three different electrolytes using the TE technique. It was observed that the corrosion rate of the Cu–Ni–2%Al alloy was the lowest among the alloys in the 0 ppm sulphate saline solution (0·0317 mm/year) as can be seen in Table 4. However, it was not lower than the corrosion rate of Cu–Ni–2·0 wt-%Fe[Q], which was calculated in previous investigation2 in this laboratory, although it was better than Cu–10 wt-%Ni without any iron content. The alloys Cu–Ni–2%Co and Cu–Ni–2%Cr exhibited corrosion rate values of 0·0362 and 0·0378 mm/year respectively. The highest corrosion rate in this environment was recorded for Cu–Ni–2%V alloy which was 0·0742 mm/year. The corrosion rate of the other three alloys ranged between 0·0515 and 0·0652 mm/year.
Corrosion rates for Cu–Ni synthetic alloys in 0 ppm sulphate artificial saline solution
The corrosion rate results are illustrated in Fig. 9. The results show that the corrosion rates were high for four of these alloys (Cu–Ni–2·0 wt-%In, Cu–Ni–2·0 wt-%Mo, Cu–Ni–2·0 wt-%Ti and Cu–Ni–2·0 wt-%V), where it ranged between 0·0515 mm/year for Cu–Ni–2·0 wt-%Ti and 0·0742 mm/year for Cu–Ni–2·0 wt-%V alloy. On the other hand, the corrosion rates for Cu–Ni–2·0 wt-%Al, Cu–Ni–2·0 wt-%Co and Cu–Ni–2·0 wt-%Cr were not as high, which indicates that these three alloys can be used as alternative alloys for Cu–Ni–2·0 wt-%Fe[Q] in a 0 ppm sulphate artificial saline solution.
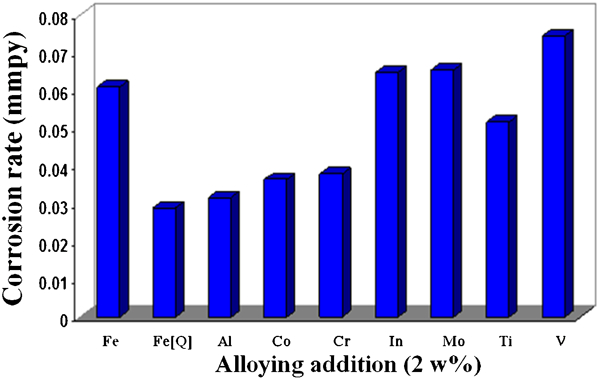
Corrosion rates of Cu–Ni synthetic alloys in 0 ppm sulphate artificial saline solution
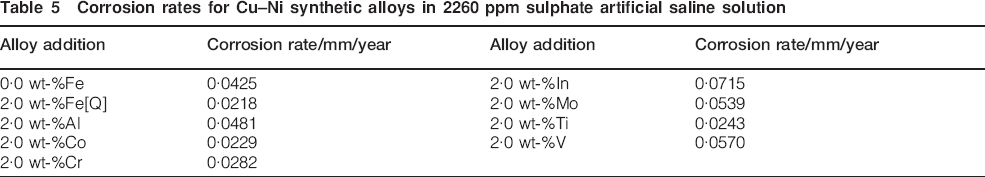
The effect of the sulphate addition to the electrolyte is shown in Table 5 and Fig. 10 which show the corrosion rate results for the Cu–Ni synthetic alloys along with both the Cu–Ni–0 wt-%Fe and the Cu–Ni–2·0 wt-%Fe[Q] alloys in a 2260 ppm sulphate artificial saline solution. It was found that the corrosion rate ranged from 0·0218 mm/year in the case of the Cu–Ni–2·0 wt-%Fe[Q] alloy to 0·0715 mm/year in the case of the Cu–Ni–2·0 wt-%In alloy. The corrosion rate of the Cu–Ni–2·0 wt-%Co alloy (0·0229 mm/year) was very close to the corrosion rate of the Cu–Ni–2·0 wt-%Fe[Q] alloy, which would allow the former to be used as an alternative alloy in this environment. Alloys Cu–Ni–2·0 wt-%Ti and Cu–Ni–2·0 wt-%Cr can be used in this environment to some extent because of their relatively low corrosion rates while Cu–Ni–2·0 wt-%In, Cu–Ni–2·0 wt-%Mo, Cu–Ni–2·0 wt-%Al and Cu–Ni–2·0 wt-%V alloys are not recommended to be used in a 2260 ppm sulphate artificial saline solution because of their high corrosion rate values.
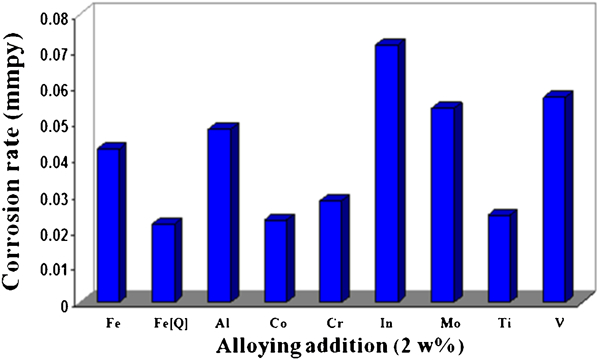
Corrosion rates of Cu–Ni synthetic alloys in 2260 ppm sulphate artificial saline solution
Corrosion rates for Cu–Ni synthetic alloys in 2260 ppm sulphate artificial saline solution
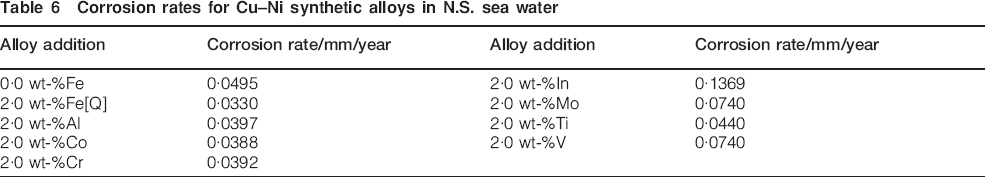
Corrosion rates in N.S. sea water are displayed in Table 6 and Fig. 11 which show the corrosion rate results for the Cu–Ni synthetic alloys with alloying elements other than iron, along with the Cu–Ni–0 wt-%Fe and the Cu–Ni–2·0 wt-%Fe[Q] alloys in N.S. sea water. It was observed that the corrosion rate ranged from 0·0330 mm/year in the case of the Cu–Ni–2·0 wt-%Fe[Q] alloy to 0·1369 mm/year in the case of the Cu–Ni–2·0 wt-%In alloy. The corrosion rate value of the Cu–Ni–2·0 wt-%Co alloy was calculated to be 0·0388 mm/year, which was close to the corrosion rate of the Cu–Ni–2·0 wt-%Fe[Q]. Synthetic alloys Cu–Ni–2·0 wt-%Al and Cu–Ni–2·0 wt-%Cr can be used in this environment to some extent because of their relatively low corrosion rate values while Cu–Ni–2·0 wt-%In, Cu–Ni–2·0 wt-%Mo, Cu–Ni–2·0 wt-%Ti and Cu–Ni–2·0 wt-%V alloys are not recommended to be used in N.S. sea water because of their high corrosion rate values.
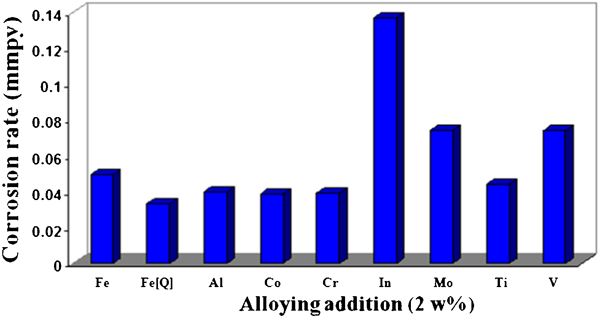
Corrosion rates of Cu–Ni synthetic alloys in N.S. sea water
Corrosion rates for Cu–Ni synthetic alloys in N.S. sea water
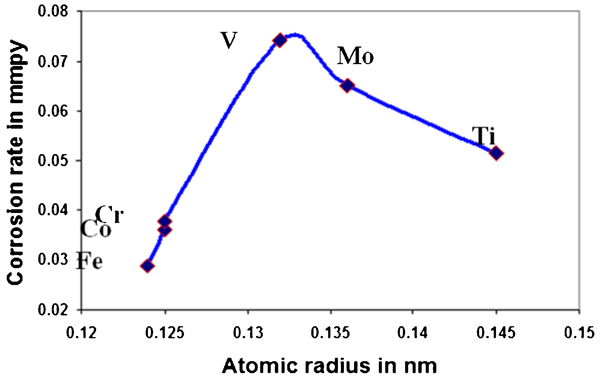
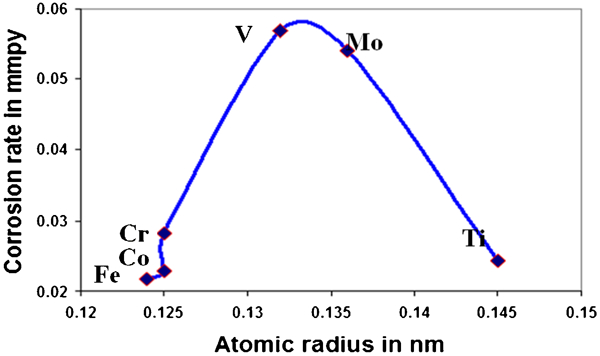
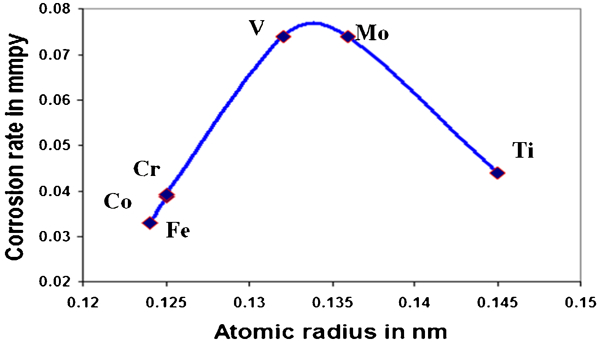
Figures 12–14 show the relationship between the atomic radii of the transition metal alloying addition used in this investigation and the corrosion rate of the resulting synthetic alloys in 0 ppm sulphate artificial saline solution, 2260 ppm sulphate artificial saline solution and in N.S. sea water respectively.
Relation between atomic radii of alloying elements and corrosion rate in 0 ppm sulphate saline solution
Relation between atomic radii of alloying elements and corrosion rate in 2260 ppm sulphate saline solution
Relation between atomic radii of alloying elements and corrosion rate in N.S sea water
The three plots in the three different electrolytes exhibit similar behaviour. The corrosion rate was increasing with atomic radius of the alloying elements up to the use of vanadium (V) as an alloying element. The corrosion rate decreased significantly using titanium (Ti) as alloying element although this element has larger atomic radius. This can be explained by the relatively high titanium solubility in Cu–90 wt-%Ni alloys at room temperature to form a single phase compared with the other alloying elements as discussed previously. This indicates that the effect of alloying elements to Cu–90 wt-%Ni alloys is not only a function of the atomic radius, but also of the ability of the alloying element to form a single phase in this alloy (note that the atomic radius is one of the variables which plays an important role in the solubility process, but it is not the only one).
Conclusions
The electrochemical behaviour of the synthetic Cu–Ni alloys containing 2 wt-% of alloying additions was found to depend on the amount of sulphate in the solution. Addition of sulphate to the artificial saline electrolyte limits the ability of the passive film to protect the alloy and the passivation potential range decreased.
The behaviour of the synthetic alloys in sea water was similar to the behaviour in a 2260 ppm sulphate artificial saline solution, but differed slightly as the N.S. sea water contains more elements than the artificial saline solution.
The alloy Cu–Ni–2·0 wt-%Co is the most protected alloy compared with Cu–Ni synthetic alloys that contain 2 wt-% other alloying elements such as Al, Cr, Ti, Mo, In or V in both the 2260 ppm sulphate artificial saline solution and N.S. sea water, and it can replace the Cu–Ni–2·0 wt-%Fe[Q] alloy in marine applications. Also, the Cu–Ni–2·0 wt-%Co alloy can be used in a 0 ppm artificial saline solution because of its comparable behaviour with the Cu–Ni–2·0 wt-%Fe [Q] alloy. The Cu–Ni–2·0 wt-%Al alloy may be used only in clean sea water (without sulphate content). It appears that the alloys Cu–Ni–2·0 wt-%Mo, Cu–Ni–2·0 wt-%In, Cu–Ni–2·0 wt-%V or Cu–Ni–2·0 wt-%Ti are not suitable for use in any of the three environments. The behaviour of Cu–Ni–2·0 wt-%Cr alloy indicates that this alloy could be used to some extent.
Footnotes
Acknowledgements
The authors wish to acknowledge the Atlantic Innovation Found (AIF) and the Natural Science and Engineering Research Council (NSERC) for financial support. One of the authors (AT) would also like to acknowledge the financial support of the Libyan Education Ministry (LEM). The contribution of the Minerals Engineering Centre (MEC) in the chemical analyses is also acknowledged.