
Abstract
The objective of this work is to study the effect of sulphide ion on the corrosion behaviour of X52 steel in the simulated solution containing sulphate reducing bacteria metabolic products species. Linear polarisation resistance and electrochemical impedance spectroscopy results show that the addition of 50 ppm sulphide ions increased the rate of X52 steel corrosion. However, with addition of 200 and 400 ppm sulphide, the corrosion rate decreased. The increase in corrosion rate is due to the increase in the cathodic reaction in the presence of sulphide, while the corrosion protection was related to FeS film formed, typically mackinawite and pyrite.
Introduction
Microbiologically influenced corrosion (MIC) is the deterioration of material caused or accelerated by the presence of bacteria and other microorganisms and their metabolic activities. MIC was reported to account for 20% of the damage caused by corrosion.1 In the oil and gas industry, the overall loss caused by MIC is estimated to be over US$100 million per annum.2 Sulphate reducing bacteria (SRB) have been the most commonly studied group because of their detrimental effects and frequent occurrence in a variety of industrial environments. Examples of failure due to SRB were given by Tiller3 and Abedi et al.4
The classical corrosion theory of electrochemical reactions influenced by SRB was first suggested by von Wolzogen Kuhr and van der Vlught,5 known as cathodic depolarisation theory (CDT). According to CDT, SRB accelerate corrosion of iron by removing atomic hydrogen from the iron surface through the bacterial enzyme hydrogenase. The removed hydrogen reacts with sulphide produced by the SRB forming H2S, which is known to be a toxic and corrosive gas.
In 1992, Newman et al.6 conducted an experiment using abiotic sulphide on the corrosion of mild steel as related to corrosion caused by SRB. Their results showed that the corrosion rates obtained by abiotic sulphide and SRB experiments have striking similarity. However, one difference resulted from an abiotic experiment to simulate the massive deposition of FeS when SRB grew in a culture containing Fe2+. The abiotic experiment could only form FeS as a result of corrosion.
In 2007, Kuang et al.7 showed that the electrochemical behaviour of SRB experiments has consistent results with the electrochemical behaviour of abiotic sulphide. They concluded that the electrochemical corrosion behaviour of carbon steel was dependent on the concentration of sulphide generated by the SRB metabolism and is hardly related to the biological activity of SRB and the SRB itself.
Sherar et al.8 concluded that the abiotic sulphide experiment is sufficient to predict the steel corrosion rate. However, this simplistic approach does not account for the heterogeneity that exists in the bacterial system.
Recent studies have shown that the abiotic sulphide experiments have similarity with SRB experiments. However, in the SRB biological activity, other metabolic products are also produced that could alter the kinetic and mechanism of steel corrosion. As for example, CO2 and acetate produced by SRB also have contribution on the corrosion of mild steel pipeline.9,10 In addition, Dominique and Wolfgang11 argued that CDT cannot fully explain the corrosion mechanism caused by SRB. One reason is that it does not capture other effects of SRB metabolic products that might contribute to the corrosion process. Considering these limitations, it is important to investigate the behaviour of abiotic sulphide incorporate with other SRB metabolic products on the corrosion behaviour of carbon steel.
Experimental
Experimental set-up
Experiments were conducted in a glass cell at atmospheric pressure and room temperature of ̃25°C (±3°C). A typical three-electrode cell was used with an Ag/AgCl (3M KCl) as reference electrode, a graphite as the counter electrode and a X52 steel specimen as the working electrode.
Material and specimen preparation
The specimens used in this study were made of X52 pipeline steel with the elemental composition of Fe–0·16C–1·32Mn–0·017P–0·006S–0·31Si–0·02Nb–0·01Cr–0·01Ni–0·03Al (wt-%).12 X52 steel was chosen as an observed sample as it is widely used in the pipeline transport of oil and gas industry. The X52 specimen was connected to copper wire and covered with epoxy resin with an exposed area of 0·5 cm2. The specimens were ground with wet silicon carbide paper to 600 grade, rinsed with deionised water, degreased in acetone and dried in a compressed hot air flow.
Electrolyte solutions preparation
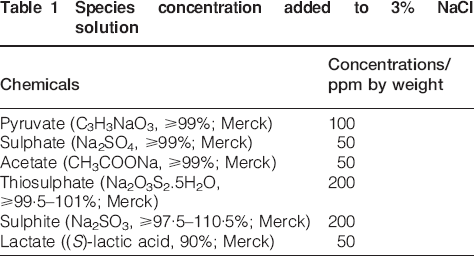
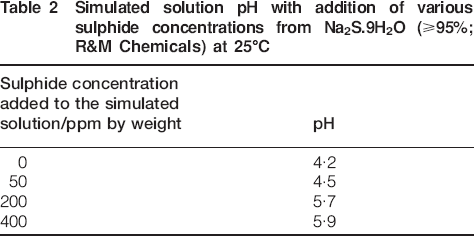
Test solution was prepared to simulate water containing SRB metabolic products species. The species selected are based on metabolic products of Desulfovibrio thermophilus that consists of sulphate, sulphite, lactate, thiosulphate and pyruvate.13 Acetate was also selected as it is consumed14 and produced by SRB in anaerobic environments under a variety of electron accepting conditions.10 A 3% NaCl solution added with various species listed in Table 1 were used as the simulated solution. Various sulphide concentrations were then added to the simulated solution and purged with CO2 (the flowrate is ̃0·2 L min−1) for 1 h before the exposure of an electrode. CO2 purging was maintained throughout the test to minimise the ingression of air. The simulated solution pH with the addition of various sulphide concentrations is shown in Table 2.
Species concentration added to 3% NaCl solution
Simulated solution pH with addition of various sulphide concentrations from Na2S.9H2O (≥95%; R&M Chemicals) at 25°C
Electrochemical measurements
The linear polarisation resistance (LPR) tests were conducted with a scan rate of 10 mV min−1 and a scan range of −10 to +10 mV from the corrosion potential and repeated twice for each case. Potentiodynamic polarisation was conducted from −400 to +200 mV from the corrosion potential with a scan rate of 30 mV min−1. Electrochemical impedance spectroscopy (EIS) was measured under a sinusoidal excitation potential of 10 mV in the frequency range of 0·5 mHz to 10 kHz. The EIS curves were fitted using an open available software, namely, EIS spectrum analyser beta version. All electrochemical measurements were conducted after 90 min immersion times of the electrode.
For the LPR test, polarisation resistance R p was given by Stern and Geary's equation15

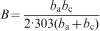
The Stern–Geary constant B was calculated using cathodic and anodic Tafel slope based on Tafel analysis of the polarisation curve. A value of 26 mV/decade is considered.
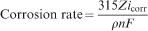
The corrosion current density can be related directly to the corrosion rate (mm/year) from Faraday's law
Surface morphology observation and corrosion product analysis
After the experiment, the specimen was used for additional ex situ analyses. The morphology and composition of each product were analysed using field emission scanning electron microscope (FESEM), energy dispersive X-ray spectroscopy (EDAX) and X-ray photoelectron spectroscopy (XPS) analysis. To observe the corrosion morphology under the corrosion products, the corrosion products were removed using the chemical product cleanup method as mentioned by Finnegan and Corey.16
Results
Linear polarisation resistance
The effect of sulphide concentrations on the corrosion of X52 steel in the simulated solution saturated with CO2 is shown in Fig. 1. As can be seen, the corrosion rate increased insignificantly to 1·33 mm/year with the addition of 50 ppm sulphide. However, corrosion rate decreased with addition of 200 and 400 ppm sulphide. The corrosion rate decreased to 0·54 mm/year in the solution with 400 ppm sulphide, which was twofold lower than that of X52 steel in sulphide free solution (1·13 mm/year).
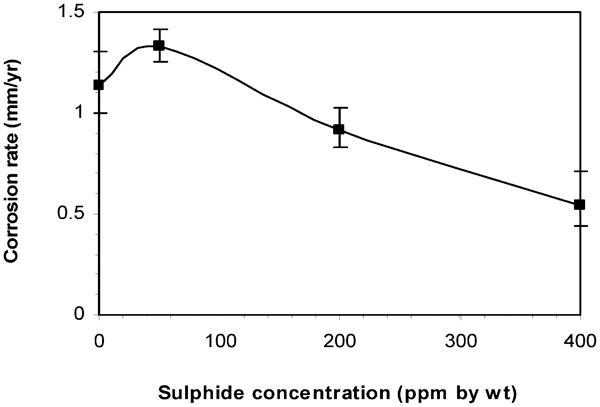
Effect of sulphide on corrosion rates of mild steel in simulated solution at 25°C after 90 min immersion time
Polarisation curve measurements
Figure 2 shows the polarisation curves of X52 steel in the simulated solution saturated with CO2 at 25°C.
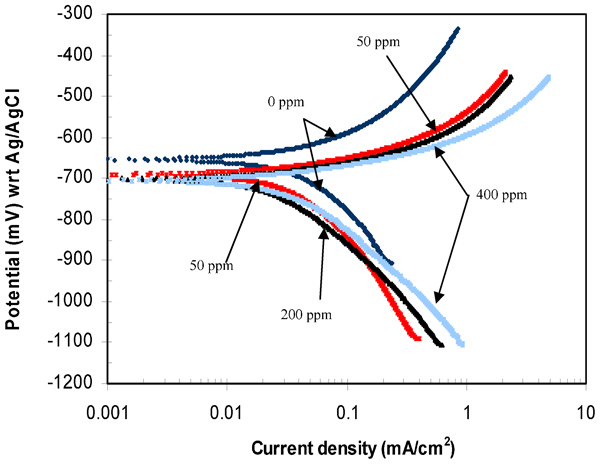
Polarisation curve of X52 steel with various sulphide concentrations in simulated solution at 25°C after 90 min immersion time
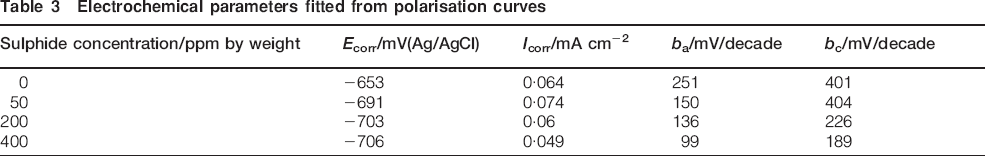
The electrochemical parameters, e.g. corrosion potential E corr, corrosion current density i corr and anodic and cathodic Tafel slopes b a and b c, are shown in Table 3. It is evident from Table 3 that the addition of 50 ppm sulphide increased the corrosion current i corr. However, with addition of 200 and 400 ppm sulphide, the corrosion current decreased.
Electrochemical parameters fitted from polarisation curves
Even though the experimental anodic polarisation curve does not display an extensive Tafel region, it is possible to calculate the anodic Tafel line from the experimental data. The Tafel line of the cathodic polarisation curve is first extended to electrode potential below the corrosion potential, and then the anodic current density i a (net experimental) is calculated from17,18


Measurements using EIS
Figure 3 shows the Nyquist diagrams and Bode plots measured on X52 steel in the simulated solution saturated with CO2 at 25°C. All impedance spectra showed a depressed capacitive loop at high frequencies, indicating a double layer capacitance. The depressed semicircle might be related to surface roughness of solid electrode, the inherent physical heterogeneous nature of the solid surface and the non-uniform distribution of current density.19,20 In addition, for 0, 200 and 400 ppm sulphide, a spurious capacitive loop was observed in the frequency range of 103–105 Hz, which was shown by a small peak in the Bode plot. The spurious capacitive loop at high frequency is not an artefact, but it probably comes from a genuine measurement of the capacitance of the solution.21 Moreover, an inductive loop at high frequencies for solution with 50 ppm sulphide was also observed. The inductance at high frequency arises either from the inductance of the leads to the cell or from cell–potentiostat interactions.21
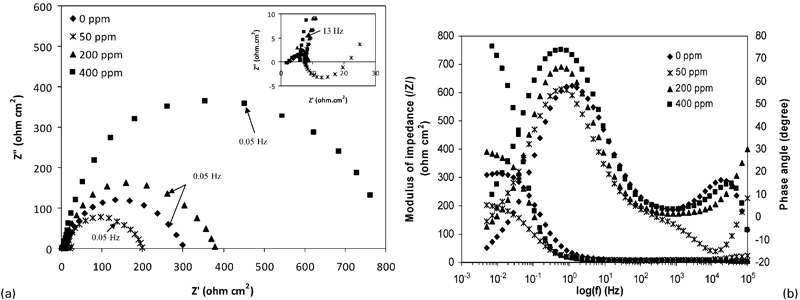
a Nyquist diagram and b Bode plots of X52 steel with various sulphide concentrations in simulated solution at 25°C
An equivalent circuit, as shown in Fig. 4, was used to fit the measured impedance data, where R s is the electrolyte resistance, R t is the charge transfer resistance and CPE is a constant phase element. Typical fitting results are shown in Fig. 5, where the EIS plots were measured on X52 steel with the addition of 400 ppm sulphide in the simulated solution. It is seen that the measured data and the fitted result matched very well. The CPE represents a non-ideal behaviour caused by the roughness of the corrosion product layer.22 The impedance of the CPE is given by equation (6)23


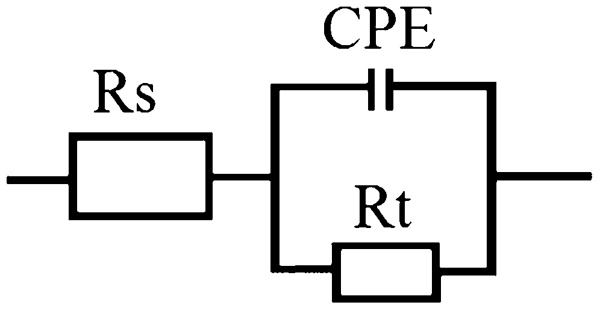
Equivalent circuit used to simulate EIS diagram
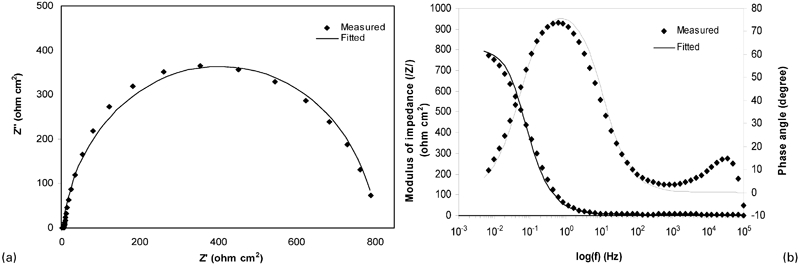
a Nyquist diagrams and b Bode plot of X52 steel with presence of 400 ppm sulphide in simulated solution (comparison of experimental data with fitted results)
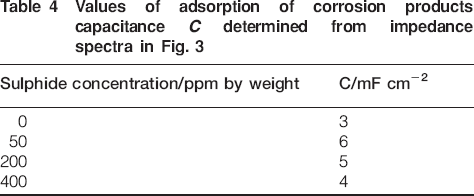
The calculated values of C are shown in Table 4. It is observed that the C values increased with the addition of 50 ppm sulphide concentration. However, the calculated values of C decreased with addition of 200 and 400 ppm sulphide. This behaviour suggested that the quantity of adsorbed species on the X52 steel depends on the concentration of sulphide ion and influences the corrosion rate.
Values of adsorption of corrosion products capacitance C determined from impedance spectra in Fig. 3
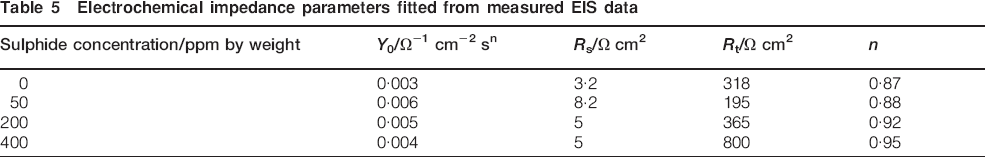
It is also seen from Table 5 that values of R t decreased with the presence of 50 ppm sulphide and increased with the presence of 200 and 400 ppm sulphide. This suggests that corrosion resistance of X52 steel decreased with the presence of 50 ppm sulphide and increased with the presence of 200 and 400 ppm sulphide ion concentration. These results were in good agreement with the results of the LPR tests as shown in Fig. 1 and the potentiodynamic polarisation curves as shown in Fig. 2.
Electrochemical impedance parameters fitted from measured EIS data
Corrosion morphology
Analysis using FESEM and EDAX
The morphology of X52 steel surface after 90 min immersion with addition of various concentrations of sulphide ion in the simulated solution at 25°C is shown in Fig. 6. As shown in Fig. 6a, a flat and compact film was observed in the simulated solution without the addition of sulphide.
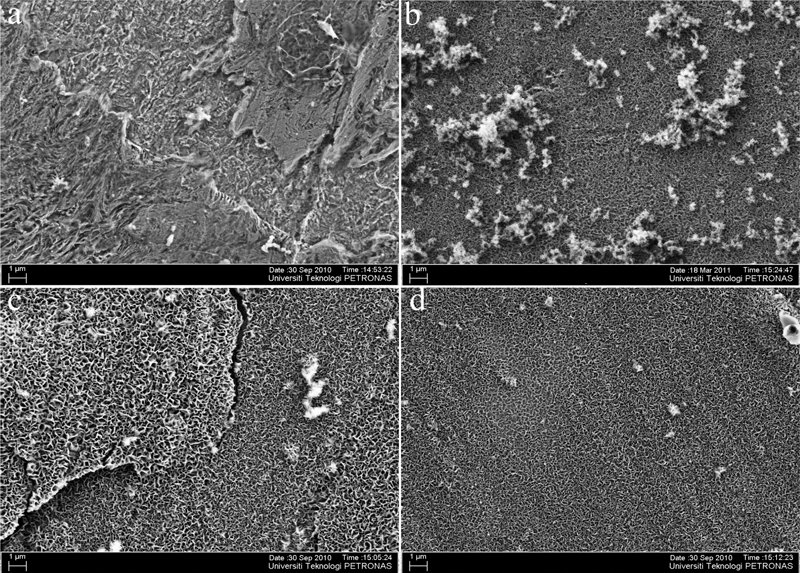
a 0 ppm; b 50 ppm; c 200 ppm; d 400 ppm
With the addition of 50 ppm sulphide into the simulated solution, the small crystal grains (in the form like a cloud) were observed on the film scale (Fig. 6b). However, with increasing sulphide concentration, the small crystal grains tended to disappear and the FeS film (in fragmented form) was seen obviously. It is suspected that the small crystal grain is FeCO3 film and the base scale is FeS film. In the environment containing sulphide, FeS film is likely to form than FeCO3 film. In addition, it is observed that the FeS film appeared to be more visible in high sulphide concentration (200 and 400 ppm) (Fig. 6c and d) than that in low sulphide concentration (Fig. 6b).
The EDAX results of X52 steel with addition of various concentrations of sulphide ion in the simulated solution at 25°C are shown in Fig. 7. It is observed that there was no peak of S element detected in the simulated solution without sulphide and containing 50 ppm sulphide (Fig. 7a and b). Meanwhile, a peak of S element was detected in the simulated solution containing 200 and 400 ppm sulphide (Fig. 7c and d) that may indicate sulphide related corrosion products. However, the EDAX results only show an indication of typical elements and could not justify the typical film formed, and therefore, further corrosion product analysis, i.e. XPS test, was conducted in this study.
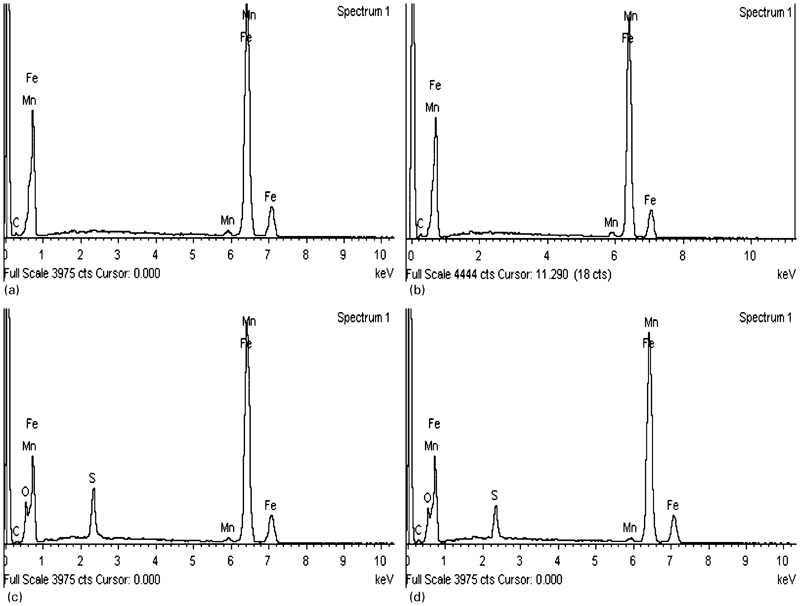
a 0 ppm; b 50 ppm; c 200 ppm; d 400 ppm
After removing the corrosion products on the carbon steel surface, pitting corrosion was observed on all samples. However, with the increase in sulphide concentration, the pitting's diameter decreased (Fig. 8).
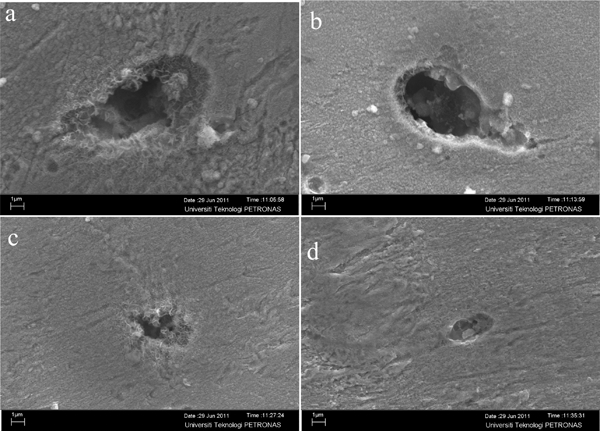
a 0 ppm; b 50 ppm; c 200 ppm; d 400 ppm
As shown in Fig. 9a and b, cross-sectional view results show that there is not much difference in the film thickness with the sulphide concentration range between 0 and 50 ppm sulphide. The film thickness is ̃220 nm. However, with addition of 400 ppm sulphide, the film thickness increased significantly to 7·45 μm (Fig. 9c). This result is in good agreement with electrochemical studies that showed a decreasing of corrosion rate with the presence of 400 ppm sulphide.
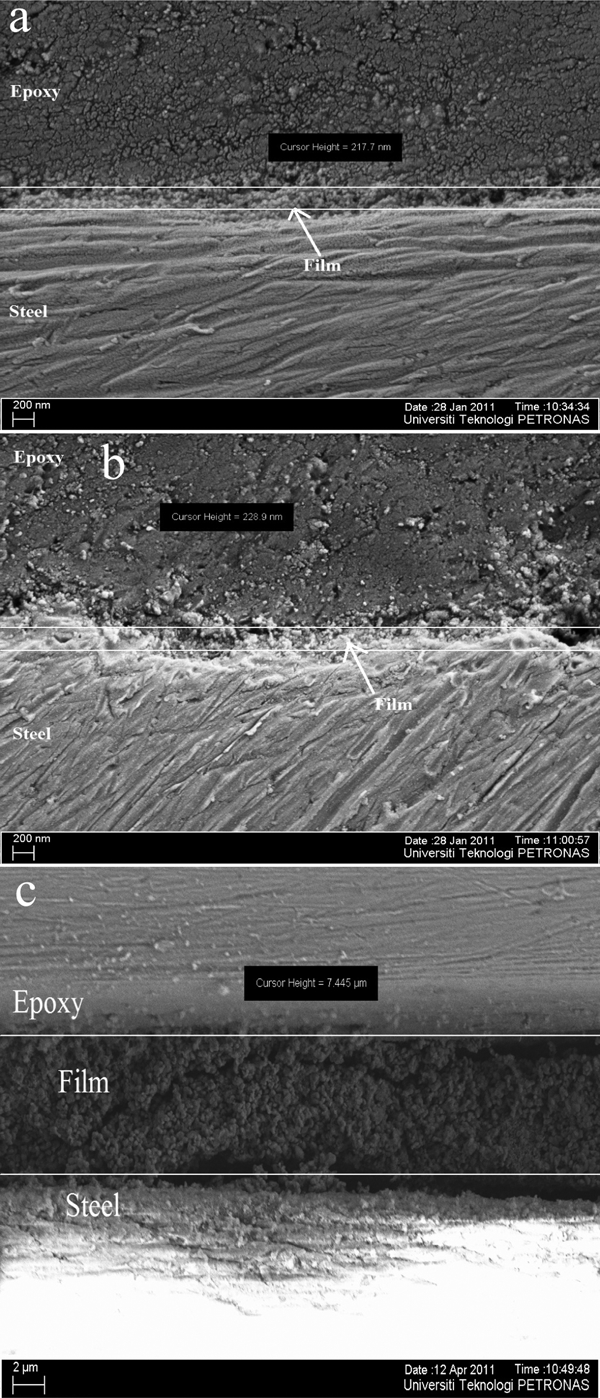
a 0 ppm; b 50 ppm; c 400 ppm
Analysis using XPS
Analysis using XPS was performed on the corrosion product of the sample surface. The analysis focused on examining the existence of FeCO3 and FeS as detected by EDAX. For this purpose, Fe, C, O and S were registered in the XPS examination to get their spectra. X-ray photoelectron spectroscopy analysis in this study was conducted in sulphide free solution and solution with 400 ppm sulphide.
Figure 10a shows that three peaks of S 2p were observed in the spectra. Those are at 161·52, 163·01 and 168·2 eV. The peak at 161·52 eV corresponds to pyrite.25 The peak at 163·01 eV is close to 163·1 eV, which corresponds to polysulphide.26,27 The peak at 168·2 eV is close to 168·3 eV, which corresponds to sulphate ( ).28
).28
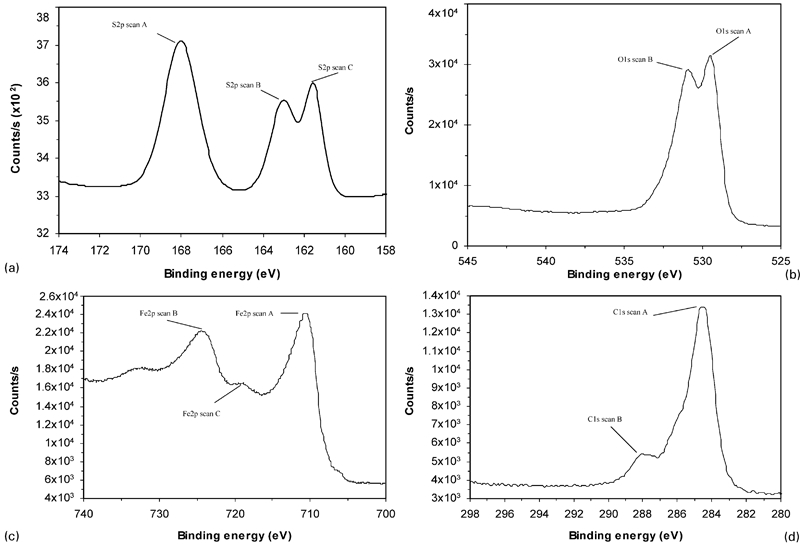
a S 2p; b O 1s; c Fe 2p; d C 1s
Two peaks of O 1s were observed in the spectra as shown in Fig. 10b. Those are at 529·48 and 530·98 eV. The peak at 529·48 eV corresponds to Fe3O4,29 and the peak at 530·98 eV corresponds to FeCO3.30 – 32
In addition, the scan of Fe 2p binding energies reveals three peaks as shown by Fig. 10c. Those are at 710·64, 724·19 and 718·88 eV. The peak at 710·64 eV corresponds to Fe3O4.33,34 The peak at 718·88 eV is close to 719·9 eV, which corresponds to Fe°.35,36 The peak at 724·19 eV is close to 724·3 eV, which corresponds to Fe3O4.37
Lastly, Fig. 10d shows two peaks of C1s observed in the spectra. Those are at 284·5 and 288 eV. The peak at 284·5 eV corresponds to hydrocarbon, and the peak at 288 eV corresponds to FeCO3.30,38
In summary, in sulphide free solution, it is proven that the FeCO3 and FeS (typically pyrite) films were formed on the electrode surface.
For simulated solution with the presence of 400 ppm sulphide, the XPS spectra are shown in Fig. 11. Figure 11a shows that one peak of S 2p was observed in the spectra at 161·2 eV. The peak at 161·2 eV corresponds to mackinawite FeS and more likely to nanocrystalline mackinawite (FeSn).39
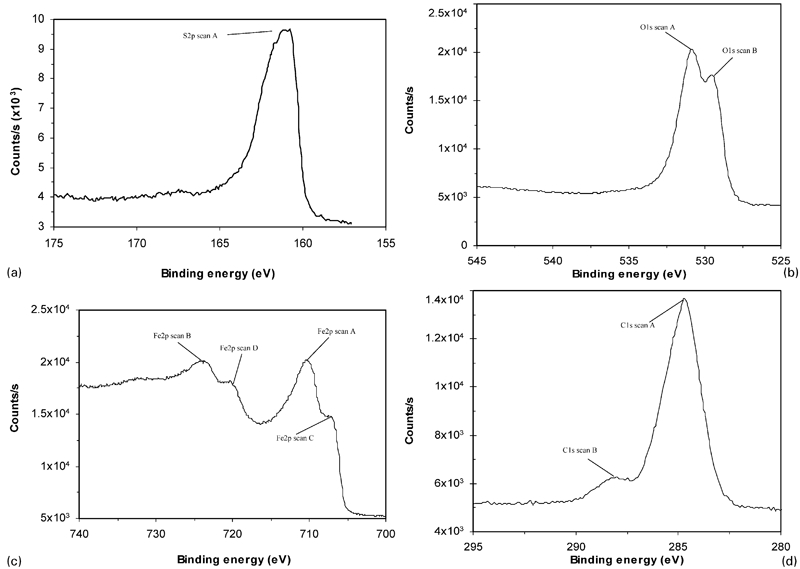
a S 2p; b O 1s; c Fe 2p; d C 1s
Two peaks of O 1s were observed in the spectra as shown in Fig. 11b. Those are at 529·5 and 530·8 eV. The peak at 529·5 eV corresponds to Fe3O4,29 and the peak at 530·8 eV corresponds to FeCO3.30 – 32
In addition, Fig. 11c shows that four peaks of Fe 2p were observed in the spectra. Those are at 707·09, 710·29, 723·7 and 720·08 eV. The peak at 707·09 eV is close to 707·3 eV, which corresponds to pyrite.39,40 The peak at 710·64 eV corresponds to Fe3O4.33,34 The peak at 720·08 eV is close to 719·9 eV, which corresponds to Fe° (clean iron). The peak at 723·7 eV is close to 724·3 eV, which corresponds to Fe3O4.37
Lastly, Fig. 11d shows that two peaks of C 1s were observed in the spectra. Those are at 284·7 and 288 eV. The peak at 284·7 eV corresponds to hydrocarbon,26 and the peak at 288 eV is attributed to FeCO3.30,38
In summary, in the presence of 400 ppm sulphide, it is observed that FeCO3 and FeS films were formed on the electrode surface. However, it is noted that the typically FeS films formed were pyrite and mackinawite.
Discussion
Linear polarisation resistance, potentiodynamic polarisation and EIS show that the addition of 50 ppm sulphide to the solution increased the corrosion rate of X52 steel. However, addition of 200 and 400 ppm sulphide decreased the corrosion rate.
Potentiodynamic curve showed that there is an increase in cathodic curve with the presence of 50 ppm sulphide. This is due to the change in the nature of cathode reaction in the presence of sulphide ions as shown in the following reactions41 – 43


As shown by potentiodynamic polarisation curves, the increase or decrease in corrosion rate was affected by cathodic side. It is seen from Table 3 that the slope of cathodic side b c increased with addition of 50 ppm sulphide and decreased with addition of 200 and 400 ppm sulphide. The table also shows changes in the slope of anodic side b a. However, the changes of anodic side b a are not significant as in cathodic side b c.
The presence of 200 and 400 ppm sulphide decreased the corrosion rate. It may also due to the inhibitive characteristic of H2S. Its inhibitive characteristic is related to the ferrous sulphide film formed, which is typically a thin mackinawite film.45,48 The mackinawite film could transform into a more stable film, e.g. troilite, pyrhotite, greigite and pyrite.50 In this study, XPS results confirmed the presence FeS films, i.e. mackinawite and pyrite. Moreover, FESEM results showed an increase in film thickness with the addition of sulphide. The significant increase in film thickness caused a better protection to the corrosion.
Ma et al.24,46 described a probable mechanism of the inhibitive effect of H2S as follows


Comparison with SRB experiment
For comparison purposes, data from open source were used in this study. The data collected were based on SRB corrosion on carbon steel.
Table 6 shows summary of carbon steel corrosion caused by SRB. It is seen that the corrosion rate caused by SRB on carbon steel ranges from 0·3 to 0·5 mm/year, with mackinawite being the typically FeS film formed. However, most of the work did not mention the number of sulphide generated by SRB and its effect on carbon steel corrosion rate.
Summary of carbon steel corrosion caused by SRB
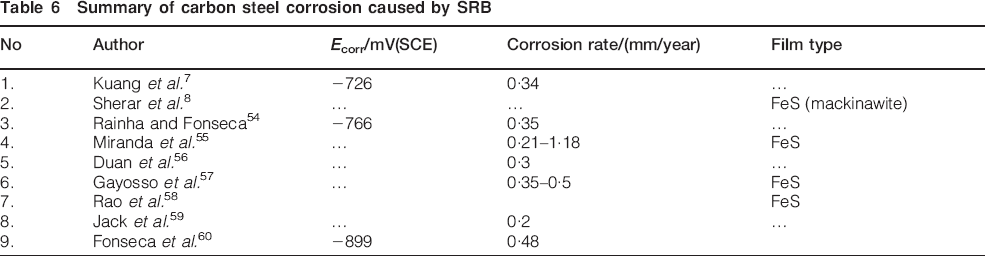
Kuang et al.7 indicated that the corrosion rate of carbon steel caused by SRB is highly related to the biotic sulphide produced. He observed that the presence of 50 ppm biotic sulphide during the bacteria death phase caused corrosion rate of ̃0·34 mm/year. Our experimental work showed that 50 ppm abiotic sulphide (depending on the sulphite and lactate concentration) caused corrosion rate ranging from 0·67 to 2·5 mm/year. This is in line with Thomas et al.51 observation that the abiotic sulphide should result in higher corrosion rate than the biotic one. This is due to the difference between the measurable and the effective biotic sulphide involved on corrosion process. Bacteria are known to be able to produce copius slimes. Such a slime layer could provide a barrier to the transport of corrosive species to the metal surface. An interspecies transfer of ions between bacteria could also render much of the measured sulphide unavailable to the steel.51 In contrast, all the abiotic added sulphide is able to contribute in the corrosion process. Additionally, the biotic FeS film formed is not limited to the mackinawite. The FeS film, typically pyrite, was also characterised in the sample containing SRB.52,53
In summary, our study has demonstrated reasonable corrosion rate with the SRB experiment. We also have been able to detect mackinawite and pyrite in the FeS film formed. Therefore, we believed that abiotic chemistry can be used to predict the corrosion caused by SRB.
Conclusions
The results of LPR and EIS tests showed that the corrosion rate of X52 steel increased with the presence of 50 ppm sulphide and decreased with the addition of 200 and 400 ppm sulphide.
Potentiodynamic curve showed that the addition of 50 ppm sulphide increased the corrosion current i corr and corrosion rate. However, with addition of 200 and 400 ppm sulphide, the corrosion current and corrosion rate decreased.
Pitting corrosion was observed in the solution with and without sulphide. However, with the addition of sulphide, the diameter of pitting decreased.
Results of XPS confirmed that in sulphide free solution, the film formed were FeCO3 and FeS (typically pyrite), and in the presence of 400 ppm sulphide, the films formed were FeCO3, mackinawite and pyrite.
The results of this study are comparable to those with SRB experiments. The corrosion rate on mild steel by SRB ranges from 0·3 to 0·5 mm/year, with the mackinawite and pyrite being the typical films formed. In this study, the corrosion rate ranges from 0·6 to 1·2 mm/year depending on sulphide concentrations. The types of film formed were FeCO3, mackinawite and pyrite.