
Abstract
The corrosion inhibitor cerium dibutylphosphate, Ce(dbp)3, prevents corrosion by cerium and dbp deposition at the alkaline cathode and acidic anode respectively. The pH dependent Ce(dbp)3 solubility seems to play an essential role in the inhibition degree. We found that Ce(dbp)3 scarcely dissolves in water with a ̃1 mM solubility limit between pH 2 and 9, whereas at pH 1, we found ̃3 mM due to protonation of dbp, and for pH >9, the cerium precipitated as Ce(OH)3. We believe that the Ce(dbp)3 dissolution process is an important aspect for understanding its release from coatings and thus the corrosion inhibition. In case of a pressed Ce(dbp)3 tablet, its dissolution is dominated by transport of dissolved Ce(dbp)3 across a stagnant diffusion layer. The chemical bond strength between cerium and dbp is a major factor in their transport. The infrared spectrum of Ce(dbp)3 powder revealed a covalent-like bond, while the molar conductivity showed complete dissociation, so Ce(dbp)3 transports in water as separate ions.
Introduction
Corrosion inhibitors can be incorporated into coating systems to increase their inherent protective properties. Traditionally, hexavalent chromates were used, which possess excellent inhibition properties. However, the toxic nature of these chromates has resulted in an almost complete ban on their use and a continuing search for low cost alternatives. Problematic in this pursuit is the wide variety of available candidates ranging from relatively high tech materials, such as rare earth metals,1 – 3 to even plant extracts.4 In this work, we study cerium based corrosion inhibitors. The first pioneering work on rare earth metals as corrosion inhibitors was conducted in the late 1970s in Japan,3 and later, in the early 1980s, rare earth metal based corrosion inhibitors were studied in Australia.5 More recent work revealed that cerium chloride, CeCl3, is an effective salt to reduce corrosion3,5,6 and gives the best performance among the other rare earth metals studied.2,3,7 In addition, it was found that cerium is an effective corrosion inhibitor on at least aluminium,5,8 zinc5,9 and steel.5,10 – 13 Consequently, it was concluded that rare earth metals in general, and cerium in particular, could fulfil the requirements of an environmental friendly, low toxic, corrosion inhibitor.3 However, these studies were all performed in aqueous environments, and leaching from a coating was not considered, whereas this leaching behaviour is a key aspect in the inhibitor efficiency, which is well known in case of chromate based inhibitors.14 The leaching rate of the common cerium based corrosion inhibitors [Ce(NO3)3, CeCl3] might be too high for practical applications because of a high solubility, which might enable rapid leaching.15 – 19 Therefore, organic anions are used in combination with the cerium cations to reduce their solubility and thus to prevent rapid leaching of cerium.20,21 It was found by Hughes et al.17 that the leaching rate of cerium dibutylphosphate, Ce(dbp)3, from an organic coating was relatively low. For this reason, Ce(dbp)3, which is only scarcely soluble in water,22 – 30 was found to be an excellent alternative for the chromate based inhibitors.8,31 – 34 An additional benefit of Ce(dbp)3 is its bifunctional nature. Namely, for Ce(dbp)3 corrosion inhibitors, it is believed that dbp precipitates on anodic regions, while cerium deposits in the alkaline region at the cathode to prevent corrosion.8
However, a comprehensive description of the fundamental processes leading to the final corrosion inhibition in case of Ce(dbp)3 is still missing. Such a description should at least be able to quantify the transport of inhibitors through coating layers, their release rate from the coating, their solubility in water in both acidic and alkaline environments, and the precipitation mechanism on metal. Therefore, in the current contribution, we study the chemical bonding between cerium and dbp, develop a method to determine the Ce(dbp)3 concentration in water, determine their solubility as function of pH and measure their dissolution rate in water as a first step towards the abovementioned comprehensive description.
Experimental
Synthesis of Ce(dbp)3
We have synthesised Ce(dbp)3 according to the following recipe. First, 0·1 mol dbp (96%, Alfa Aesar) is dispersed in 200 cm3 demineralised water. Then, with rapid stirring, we add 0·05 mol anhydrous Na2CO3 (analytical grade, Merck) in small portions to deprotonate the dbp while allowing the effervescence to diminish between the additions. When all the Na2CO3 has been added, a 200 cm3 solution of 0·033 mol L−1 of CeCl3 heptahydrate (99%, Alfa Aesar) was added in small droplets using a burette while the solution was stirred rapidly. During this step, the freshly formed Ce(dbp)3 will precipitate. After adding all CeCl3, we continue stirring for ̃10 min. Finally, we wash the precipitates with demineralised water until all NaCl, which has been formed as a byproduct, has been removed, and air dry the remaining Ce(dbp)3 at 60°C. In addition, we have synthesised Na(dbp) by washing the deprotonated dbp with toluene and dry the solution at 80°C. The remaining deposit was ground in a mortar to obtain a powder.
Dissolution of Ce(dbp)3
To obtain an aqueous solution of Ce(dbp)3, we have added an excess of the Ce(dbp)3 powder to 40 mL demineralised water in plastic tubes, and subsequently waited a week to ensure full saturation of the solution. Next, the excess of Ce(dbp)3 powder was removed from the solution using 0·22 μm Rotilabo syringe filters (Carl Roth, Germany). Note that we have adjusted the pH of the demineralised water before the addition of the Ce(dbp)3 powder with either HCl or NaOH to obtain a pH range from 1 to 13. We believe that these solutions mimic practical situations where the solution gets acidic at the anode and alkaline at cathode due to a corrosion process. ICP (Spectro Analytical Instruments, Germany) was used to analyse the saturated aqueous Ce(dbp)3 solutions.
To study the rate of the dissolution process, a Ce(dbp)3 tablet was immerged in 15 mL demineralised water and the evolution of the cerium concentration was monitored. Tablets of Ce(dbp)3 were prepared by pressing its powder at a relatively low pressure (̃0·1 MPa) into a cylindrical shape of 2·5 cm diameter and 1 mm thickness. A magnetic stirrer in a plastic container (Fig. 1) was used to provide rapid mixing and consequently to diminish the effects of diffusion on the dissolution rate. At different time intervals, the container was opened and samples from the water were taken for analysis.
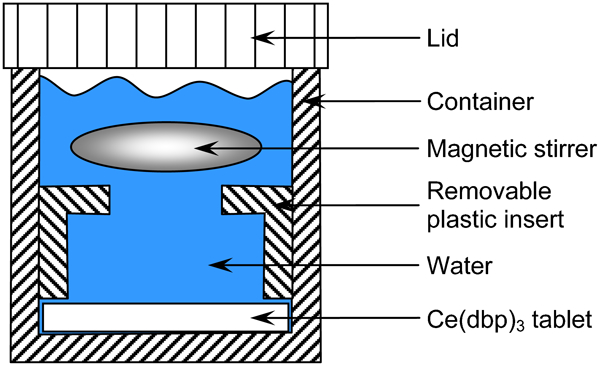
Schematics of container used for determining Ce(dbp)3 dissolution rate
Spectrophotometry of Ce(dbp)3
To analyse the chemical bond between cerium and dbp, we have recorded the infrared spectrum of Ce(dbp)3 and Na(dbp) on a Shimadzu 8400s (Shimadzu Corp., Japan) by the transmission of infrared light through a thick suspension, i.e. a mull, of these powders in liquid paraffin sandwiched between two NaCl discs.
In addition, ultraviolet–visible (UV–vis) spectra of the aqueous solutions at different dilutions were recorded on a DU 800 spectrophotometer (Beckman Coulter, USA). A 4-(2-pyridylazo)resorcinol (PAR) indicator is used to detect cerium ions, since it is reported to be an indicator with a high sensitivity to detect metals ions, and rare earth metals in particular.35 – 38 Since the PAR indicator results in a higher light absorbance, it increases the sensitivity of this method compared to measurements without the PAR indicator. However, it has also been reported that the PAR solution can deteriorate overnight and that, using an ammonium hydroxide buffer, the indicator can be stabilised.36 As a result, we have prepared the indicator using the following recipe. First, 200 mL of 30% ammonium hydroxide (analytical grade, Merck) was added to 400 mL demineralised water, in which we dissolve 0·05 g PAR (synthesis grade, Merck) (an ultrasonic bath was used to promote the breakdown of small grains). Finally, 57 mL of glacial acetic acid (analytical grade, Merck) was added to this solution, and we further dilute to a total solution of 1 L by adding demineralised water. The pH of the resulting solution is ̃10. We found that at this pH, the indicator remained stable over many days, even in glass bottles. However, at this pH, the typical red colour that is noted directly after complexation with cerium ions35 – 38 vanishes swiftly. We found that lowering the pH of the indicator to ̃8 by adding some glacial acetic acid just before the photometric measurement gave fairly stable complexes that did not significantly deteriorate for at least 12 h, which corresponds to earlier observations.35,36 We use a volumetric 1∶1 ratio for the Ce/PAR solution, although different Ce/PAR ratios are also suggested in the literature.35,36 After adding the PAR indicator, ̃1 mL of the cerium–PAR solution was transferred into a cuvette, which contains a path length for the light of 10 mm. The cuvette was subsequently placed into the spectrophotometer for analysis.
Results and discussion
Ce and dbp bond
It is believed that the protection mechanism of Ce(dbp)3 follows from the independent deposition of dbp and Ce on the anode and cathode respectively.8 Consequently, the chemical bond between Ce and dbp is important to understand the formation of these deposits. In addition, the nature and strength of the chemical bond is an important factor in the transport of the inhibitor, both through a coating system as well as in an aqueous environment. To indentify this bond, we use Fourier transform infrared on both the Ce(dbp)3 and Na(dbp) powders. Their corresponding infrared spectra are presented in Fig. 2. The spectrum of the paraffin oil did not show any absorbance in the range plotted in Fig. 2, and outside this range, no significant absorbance for the Ce(dbp)3 compound was observed. The bands due to bonded phosphoryl (P = O) have been assigned to the 1250-1125 cm−1 region.39,40 In Ref. 39, it was reported that, depending on the cation that is present, the band shifts from 1242 cm−1 for the ionic linked sodium to a bond of a covalent character with uranium at 1124 cm−1. The shift to a lower value for the position of the phosphoryl as seen in Fig. 2 thus indicates a bond of a covalent character between the cerium ions and the phosphoryl group.39 For the absorbance in the 1100-950 region, no dependence on the type of the metal ion bonded to dbp has been reported, while the absorbance in the 910-730 region strongly depends on the metal ion.39
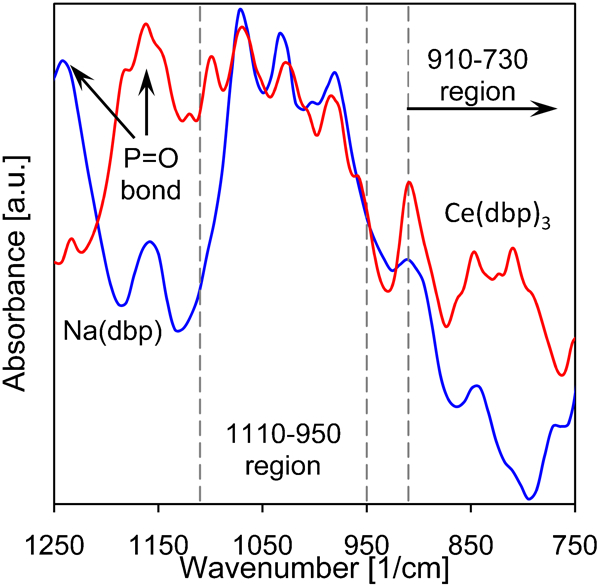
Infrared spectra of Ce(dbp)3 and Na(dbp) in paraffin oil, sandwiched between two NaCl discs: paraffin oil did not show any bands in the plotted region and indicated regions are described in the text
The abovementioned chemical bond is important for the migration of inhibitors through a coating under dry conditions. When a coating is exposed to water, the inhibitors can dissociate and subsequently leach out of the coating. As a consequence, we determine whether the bond between Ce and dbp persists upon their dissolution in water (dissociate). To determine the dissociation, we have measured the molar conductivity Λ of the aqueous Ce(dbp)3 and Na(dbp) solutions as a function of their concentration. The molar conductivity is the conductivity of an electrolyte divided by its concentration, which, according to Kohlrausch's law, decays linearly as function of the square root of the ion concentration in case of completely dissociated salts.41 In Fig. 3, this dependence for both the dissolved Na(dbp) as well as Ce(dbp)3 is plotted. In both cases, a linear dependence of the molar conductivity as function of C 1/21/2 is found, which thus indicates a complete dissociation of both Na(dbp) and Ce(dbp)3. In case the salt does not completely dissociates, as for a weak electrolyte, the molar conductivity shows a pronounced non-linearity, which cannot be fitted to the data of Fig. 3 (see Ref. 41, p. 834).
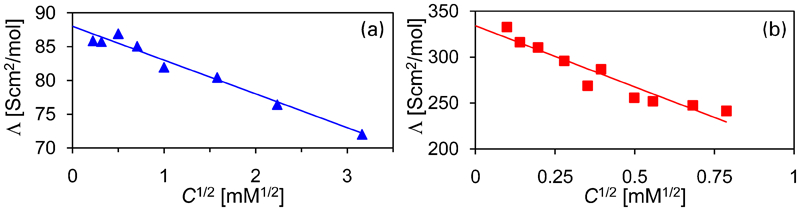
Molar conductivity at T = 25°C as function of the square root of the electrolyte concentration for a Na(dbp) and b Ce(dbp)3: symbols show experimental data, and lines are linear fit according to Kohlrausch's law
Extrapolating this conductivity data to zero concentration gives the limiting molar conductivity Λ0, from which we can derive the ionic mobility. To extrapolate the data, we have fitted both sets to Λ = Λ0−K(C1/2), where K is Kohlrausch's coefficient, and Λ0 are found to be equal to 88 and 334 S cm2 mol−1, and K are equal to 5 and 133 S cm2 mol−1 mM−1/2 for Na(dbp) and Ce(dbp)3 respectively. To obtain the contribution of each ion in the electrolyte solution, we use the fact that the limiting molar conductivity is the sum of its individual components, λ 0, i.e. 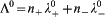 , where n i are the stoichiometric numbers of the electrolyte. For Na+, we have
  = 50 Scm2 mol−1 according to Ref. 41, which yields
  = 38 S cm2 mol−1 for dbp−. For Ce3+, we calculate
  from its Stokes radius r, according to the Stokes–Einstein relation, which gives λ 0 = z 2 eF/(6πηr), where z is the valence number, e is the elementary charge, F is Faraday's constant, T is the temperature and η is the viscosity.41,42 For cerium, r = 3·96 Å,43 and for water at 25°C, η = 0·895 mPa s−1,41 so that
  = 208 S cm2 mol−1. This yields Λ0 = 322 S cm2 mol−1 for the dissociated Ce(dbp)3, which corresponds well with the experimental data plotted in Fig. 3b. Finally, one can derive the ion mobility from
  , which results in μ Ce = 2·4×10−8 and μ dbp = 3·9×10−8 m2 (sV)−1 for Ce3+ and dbp− respectively.
Spectrophotometric determination of Ce(dbp)3
To analyse leaching experiments, it is important to have a method that allows quantifying the total amount of Ce in solution. We will show that this can be achieved by recording the UV–vis spectra of the Ce(dbp)3 solution with and without the PAR indicator. For leaching experiments, UV–vis, compared to ICP, has the advantage of small sample volumes (down to ̃0·1 mL) or even non-invasive measurements. The UV–vis spectrum was recorded at different Ce(dbp)3 concentrations by diluting the saturated samples at pH = 7 in several steps to a maximum dilution of 64. In order to quantify these UV–vis measurements, we have determined the cerium content of the Ce(dbp)3 saturated aqueous solution with ICP at 0·6 mM.
In Fig. 4a, we present the results for the absorbance of the Ce(dbp)3 solution without the PAR indicator in the ultraviolet range of 215-275 nm. Although outside the plotted range no significant absorbance was observed, there was a hardly visible band just below 300 nm. An absorption peak with a much lower magnitude than those in the 215-270 nm range was also observed previously for a less diluted solution of CeO2 in hydrochloric acid (ClO4) at 296 nm.44 In addition, Banks and Klingman45 found peaks for Ce(ClO4)3 at 223, 239 and 253 nm, which are identical to those plotted in Fig. 4a. We found that CeCl3 gives identical spectra for the concentration range used in Fig. 4a.
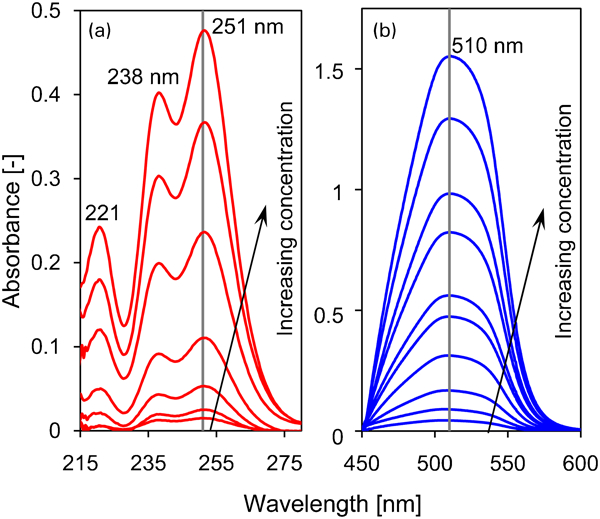
a absorbance without indicator relative to demineralised water for 0·01, 0·02, 0·04, 0·08, 0·15, 0·31, 0·46 and 0·6 mM; b absorbance for solutions coloured with PAR relative to 1:1 demineralised water PAR solution for 0·01, 0·02, 0·04, 0·08, 0·12, 0·15, 0·25, 0·31, 0·46 and 0·6 mM
The UV–vis spectra for Ce(dbp)3 at various concentrations with the PAR indicator are given in Fig. 4b, which shows the absorbance relative to a solution of PAR and demineralised water having a 1∶1 volumetric ratio. A peak is observed at 510 nm, which is commonly found for CeCl3, whereas outside this range no peaks were observed.
In order to determine the concentration from the UV–vis measurements, we need a calibration curve, for which CeCl3 is used. The absorbance as a function of the cerium concentration is plotted in Fig. 5. These results clearly show that CeCl3 can be used to construct a calibration curve to determine the cerium concentration. The data show that the increase in absorbance levels off for increasing cerium concentration. This is well displayed by the solid line, which describes the absorbance according to A = 3·93C Ce–2·35C Ce 2, where C Ce is the cerium concentration in solution. For relatively low concentration (below 0·15 mM), the absorbance is given by Beer–Lambert's law, i.e. A = ϵLC Ce, where ϵ is molar absorptivity (extinction coefficient) and L is the path length of the light. In Fig. 5, the dashed line represents Beer–Lambert's law for a molar absorptivity equal to ϵ = 380 m2 mol−1. Since the results for CeCl3 and Ce(dbp)3 coincide, there is no influence of dbp− on the amount of absorbance of the Ce–PAR complex in the concentration range plotted in Fig. 5. That both data sets coincide corresponds with the previous observation of the complete dissociation of Ce(dbp)3, since the complexation of the PAR indicator with dissociated trivalent cerium cation is independent of the type of anion.
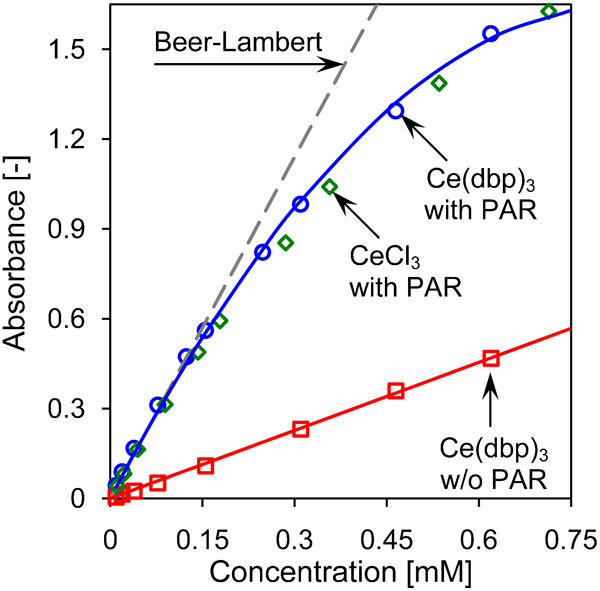
Ultraviolet–visible absorbance as function of concentration for CeCl3 with PAR (diamonds), Ce(dbp)3 with PAR (circles) recorded at 510 nm and Ce(dbp)3 without PAR (squares) recorded at 251 nm: solid lines represent fits to Ce(dbp)3 data and the dashed line is the linear Beer–Lambert's law for Ce(dbp)3 with PAR
For Ce(dbp)3 without the PAR indicator, we plot the absorbance at 251 nm in Fig. 5. Here, we clearly observe a linear relation between the absorbance and the cerium concentration, which follows Beer–Lambert's law for ϵ = 75·7 m2 mol−1. This value is in excellent agreement with its corresponding value for Ce(ClO4)3, which equals 75·5 m2 mol−1, as reported in Ref. 44. In addition, we found an identical molar absorptivity at 251 nm for aqueous CeCl3 and Ce(dbp)3 solutions at a pH equal to 1, 3 and 5 and a concentration up to 0·6 mM, while using the PAR indicator the absorbance strongly depends on the pH of solution. This is important since during corrosion and leaching experiments, the pH of the solution can vary significantly, and the method with PAR cannot be used in a robust way. Another disadvantage of using PAR is its non-linear behaviour at higher cerium concentration, whereas an advantage is its higher sensitivity for cerium detection.
Solubility as function of pH
During corrosion, the anodic environment becomes more acidic, while the cathodic environment becomes more basic.46 To understand how the Ce(dbp)3 inhibitors behave in these environments, we analysed the samples that were saturated with Ce(dbp)3 in acidic and alkaline solutions. The results obtained with ICP are plotted in Fig. 6.
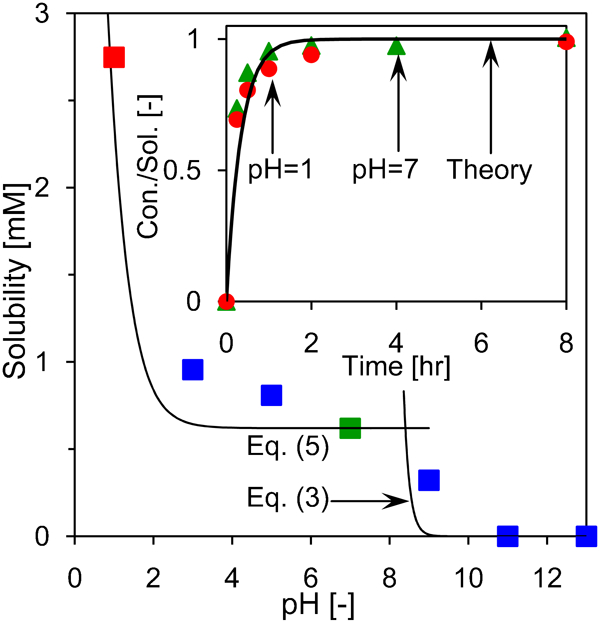
Solubility of Ce(dbp)3 as function of pH determined by analysing the cerium content of aqueous Ce(dbp)3 solutions using ICP. The cerium content at pH equal to 11 and 13 were below the detection limit. Lines give theoretical results according to equations (3) and (5) for solubility. Inset: evolution of the dissolution process for neutral (pH 7) and acidic (pH 1) solution indicated by symbols, and the solid line represents the classical dissolution theory according to equation (6)
To analyse these results, we first consider the dissociation of Ce(dbp)3, which proceeds according to

 . As a result, we find that K* equals 4×10⁻¹² M4 at pH 7. This value deviates from those reported in Refs. 29 and 30, where it was found that the complexes of dbp− and trivalent lanthanides cations (including Ce3+) have a characteristic K* value of ̃10−10 M4, which suggest a Ce3+ solubility of ̃1·4 mM. This value is approximately two times higher than the solubility found in this work.
In the most alkaline solutions that were studied (i.e. at pH 11 and 13), we found that the dissolved Ce(dbp)3 precipitated and no appreciable cerium concentration was found in the solution. The deposit had a distinct yellow colour, which indicates the formation of the Ce(III) oxide, Ce2O3. As a first step in the formation of this oxide, we consider the hydrolysis of the trivalent cerium cations, which proceeds according to

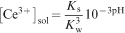
 , where K w is the equilibrium constant of the reaction and equals ̃10−14 M2 at room temperature. We can now substitute the hydroxyl concentration in equation (2) to obtain the solubility of the trivalent cerium cations as function of pH
At the most acidic solution (pH 1), a relatively higher cerium concentration than expected from extrapolating the data between pH 2 and 9 was found, namely, [Ce3+]sol = 2·8 mM. We attribute this higher cerium concentration to the protonation of dbp, i.e.

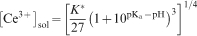
 is used. In Fig. 6, the increase in the trivalent cerium cation concentration according to equation (5) is plotted with pK a equal to 1·7,48 and shows a good agreement with the experimental data.
These results for the solubility show that the bifunctional corrosion protection of Ce(dbp)3 is influenced by the local pH at the anode and cathode, since near the anode the dbp protonates in the acidic environment, while near the basic cathode the cerium precipitates.
Dissolution rate
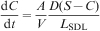
In the previous work, it was found that the amount of Ce(dbp)3 that leaches from organic coatings is low20 and might be triggered by a low pH of the solvent.21 However, an explanation for this behaviour was not reported. To interpret the leaching rate, we have determined the evolution of the dissolution process for an initially neutral solution (pH 7) and an acidic solution (pH 1), as given in the inset of Fig. 6. To analyse this evolution, the classical dissolution theory is used. Here, it is assumed that a solid substance immersed in a solvent [here the Ce(dbp)3 tablet in water] is readily surrounded by an infinitesimal thin film of saturated solution.49 From this infinitesimal thin film, the substance diffuses into the solvent across a stagnant diffusion layer50,51 with a flux according to D(S−C)/L SDL, where D is the diffusion coefficient of the substance in the solvent, S is its solubility, C is its concentration in the bulk of the solvent, and L SDL is the thickness of the stagnant diffusion layer.52 Finally, we have the mass balance
Conclusions
An important aspect for understanding the mechanism of corrosion protection by Ce(dbp)3 is the interaction between cerium and dbp. In this work, we found by analysing the infrared spectra of Ce(dbp)3 powder that cerium forms a bond of a covalent character with the phosphoryl group of dbp. When incorporated in a polymer coating, this bond can play an important role in its transport through the polymer matrix under dry conditions. However, when exposed to water, Ce(dbp)3 will dissociate in trivalent cerium cations and monovalent dbp anions, which are more prone to migrate through the coating. Moreover, we found that dissolution of Ce(dbp)3 in water can be described by the transport of the dissolved Ce(dbp)3 according to the classical dissolution theory. Therefore, it is reasonable that the increased solubility of Ce(dbp)3 in an acidic environment can thermodynamically favour their release from a coating at low pH due to the increased chemical potential difference between the coating and the solvent. These observations are important to interpret the leaching of Ce(dbp)3 inhibitors from coatings, and thus their supply to a corroding spot. To quantify the amount of Ce(dbp)3 in solution after leaching, we can use UV–vis. Namely, the absorbance at 251 nm follows Beer–Lambert's law and is independent of the pH of the solution in the range of pH equal to 1 up to pH equal to 7. This is useful since we found that the solubility of Ce(dbp)3 depends on the pH of the solution due to protonation of the dbp at low pH and the formation of cerium hydroxide at high pH. Moreover, in this work, the reported pH dependent solubility is a significant aspect for the corrosion protection provided by Ce(dbp)3, since its mechanism is based on the formation of a dbp layer at the acidic anode and a cerium hydroxide layer at the alkaline cathode.
Footnotes
Acknowledgements
This research was carried out under project no. M81·6·10383 in the framework of the Research Program of the Materials innovation institute (![]() ). In addition, the authors are grateful to J. H. J. Dalderop and A. Elemans-Mehring (Eindhoven University of Technology) for their excellent technical assistance.
). In addition, the authors are grateful to J. H. J. Dalderop and A. Elemans-Mehring (Eindhoven University of Technology) for their excellent technical assistance.