
Abstract
The atmospheric corrosion kinetics of AISI 304 and AISI 316 stainless steel in tropical marine environments is observed by weight loss. The corrosion products are identified by laser Raman spectroscopy, and surface morphology is observed by SEM. The results show that the corrosion rates tend to decrease as the exposure time increases. The mass loss obeys the empirical kinetics equation. The value of n can be used to predict the corrosion resistance of stainless steel, indirectly. The rust layer composition of the two stainless steels is different, and the percentage of Fe3O4 and β-FeOOH are also different.
Introduction
Austenitic stainless steels such as 304 (0Cr18Ni9) and 316 (0Cr17Ni14Mo2) have been widely used in the area of aerospace, transportation, petrochemical, outdoor projects and buildings. Stainless steels also have applications to building materials such as roof, pillar decoration, etc. because of their high degree of corrosion resistance, unique aesthetic quality and stability in an unpolluted atmosphere. The outstanding atmospheric corrosion resistance of stainless steels results from the presence of a thin oxide film on the metal surface, typically 1-3 nm thick.1 However, stainless steels are not immune to corrosion in the atmospheric environment. Usually, if the atmosphere contains only water, it will not break the stainless steel surface passive films. Even, a small number of destruction will be very easy to repair because of its strong self-repairing ability. However, in marine environments, salt is deposited on steel surfaces by marine fog and windblown spray droplets. The surface contains a viable electrolyte around 30-35%; in this condition, corrosion may be induced. Thus, corrosion does occur and is often localised a result of local breakdown of this film, e.g. pitting corrosion caused by deposition of sea salts.
Environmental factors such as temperature, rainfall and relative humidity also are very important factors for the occurrence of the atmospheric corrosion of stainless steel. The evaluation of atmospheric corrosion of stainless steel has been performed by authors. Previous studies2 pointed out that the content of Cr element in the passive film of the stainless steel had a big relationship with atmospheric corrosion resistance. Kain et al.3 studied the corrosion behaviour of different types of stainless steel in the marine atmosphere environment after long exposure time (15 and 60 years) and found that with increase in the content of chromium and molybdenum elements, the corrosion resistance of stainless steel increases. Wallinder et al.4 studied the influence of surface treatment of type 304L stainless steel on atmospheric corrosion resistance in urban and marine environments after 2 and 7 months of exposure. The results show that surface statement has a certain relationship with corrosion resistance. The bright annealed samples showed the best performance in the marine environment due to its surface composition and hygroscopicity. Tochihar et al.5 observed the atmospheric corrosion behaviour of the stainless steel roof and eaves when exposed in the marine atmosphere environment and found that the eaves corroded more severely than the roof. The corrosion of the steel is more serious with the increase in the angle eaves, which is due to the deposition of the content of chloride.
However, there is little literature about the austenitic stainless steel in the tropical marine environment after a short time exposure, i.e. <10 years. Xisha archipelago of China, the typical tropical marine climate, has the most severe marine environment, characterised with high temperature, high humidity, heavy salt fog and long daylight. The main objective of the present paper is to describe information about the atmospheric corrosion of AISI 304 and AISI 316 in Xisha atmospheric corrosion site during a 4 year exposure programme. The results obtained are analysed and discussed as a function of exposure time. Statistical analysis and some corrosion mechanism of the stainless steel in the tropical marine environment are suggested.
Experimental
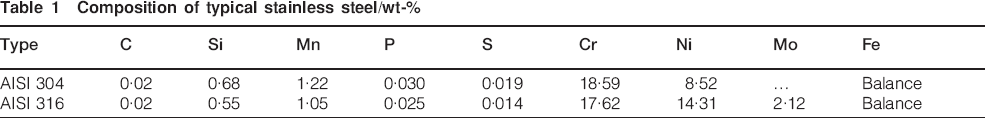
AISI 304 and AISI 316 plates with size of 200×100×4 mm were used as specimen. The normal chemical composition is shown in Table 1. Before exposure, the specimens ground sequentially to 1500 grit SiC paper, degreasing with acetone and washing with detergent, cleaning with ethanol for 20 min and drying in a hot air jet. After their preparation, the specimens were stored for 24 h in a desiccator. Immediately before testing, the weight was accurately measured by Mettler-Toledo AB265-S to be 0·01 mg after they were cleaned and dried.
Composition of typical stainless steel/wt-%
The specimens were exposed in triplicate on open air racks at an angle of 45° horizontally and with skyward surface facing south, where the plates were exposed facing the sea, according to ASTM G-50 (Ref. 6)and allowing a maximum exposure in the Xisha atmospheric site of China. Figure 1 shows the location of atmospheric exposure stations in the Xisha Islands of the South China Sea.
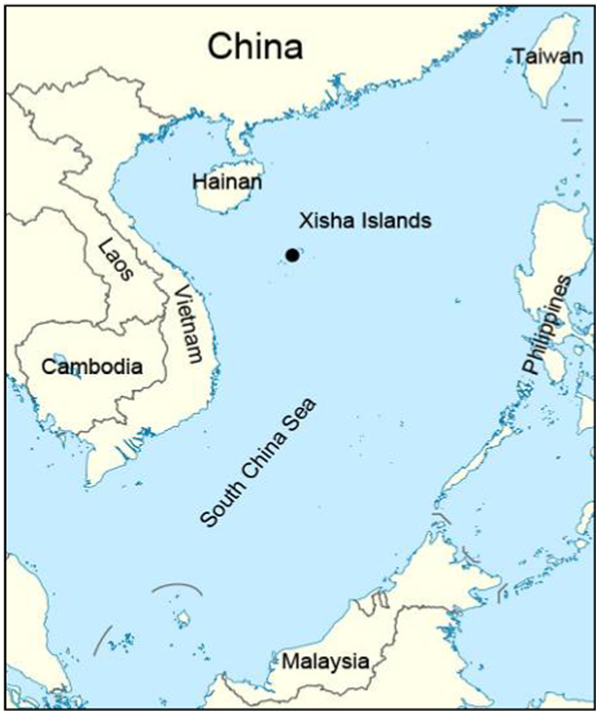
Location of Xisha Islands and atmospheric exposure stations
The deposition rate of chlorides was determined using the wet candle method described in ASTM G-140.7 The deposition rate of SO2 in station was determined using the lead dioxide sulphation candle, according to ASTM D-2010.8 In addition, the time of wetness (TOW) was estimated from the number of hours per year the relative humidity was equal to or >80% and the temperature exceeded 0°C.
The plate specimens were placed on the test sites and then collected according to the exposure programme, i.e. after 1, 6, 12, 24 and 48 months. Four replicate specimens from the site were collected in each period, three of them were used to measure the corrosion rate by loss of weight, and the other one was used to identify the nature of the corrosion products and the corrosion behaviours.
The corrosion products formed on the specimens were identified by laser Raman spectroscopy, and the surface morphology after different exposure time was observed by SEM. For weight loss measurements, a Mettler-Toledo balance having a readability of 0·01 mg was used. The corrosion products on the specimen surfaces were removed chemically by immersion in a specific solution (500 mL HCl+500 mL distilled water+3·5 g hexamethylenetetramine) that was vigorously stirred for ̃10 min at 25°C. Once the corrosion products had been completely removed, the specimens were rinsed with distilled water and then dried with a blower. Meanwhile, metal loss caused by pickling was determined using uncorroded sample. Then, taking both the weight loss of the exposed samples and the uncorroded samples into account, the actual weight loss was given. The depth of pits on the surface was measured and calculated using an optical focusing method after the corrosion product was removed.
Results and discussion
Environmental characteristics at exposure sites
It is well known that the atmospheric corrosion of the stainless steel is not only caused by air pollution but also by meteorological factors. Air temperature, relative humidity, wind speed, rainfall and TOW play important roles in atmospheric corrosion. Figure 2 shows the weather conditions of the Xisha Island during 1 year of exposure. As can be seen in Fig. 2, the average temperature in Xisha Islands is in the range of 25-27°C, with maximum temperature increasing up to 30°C. The mean relative humidity values are ̃75%; the maximum are in February, June and October. The deposition rates of the chlorides are between 2 and 3 mg m−2 h−1. The highest deposition rates are in January, June and August. The standard ISO 9223 (Ref. 9) estimates the TOW based on climatic factors, which is an indirect method to consider a thin water film over the metallic surface.
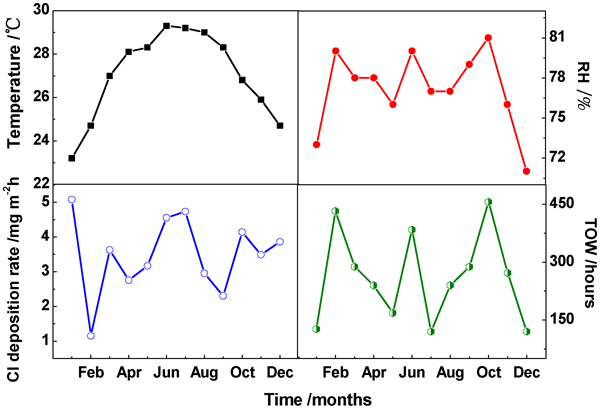
Weather conditions of Xisha during 1 year of exposure
According to ISO 9223, the climate characterisation and the main environmental parameters of the average values of the 4 years are listed in Table 2, as well as atmosphere classification. Chlorides are deposited mainly in marine atmospheres as droplets or as crystals formed by evaporation of spray carried by the wind from the sea. Chlorides may deposit on a metal surface by dry or wet deposition. Dry chloride deposition dominates in coastal areas, while wet deposition can be a significant source of chlorides in inland areas. According to ISO 9223 correspond atmospheric classification, the environments are classified in terms of chloride (class S) and SO2 (class P). The chlorides deposition rate S (expressed in mg/m2/day) atmospheres can be classified as S 0(S≤3), S 1(3<S≤60), S 2(60<S≤300) and S 3(300<S≤1500). The main part of anthropogenic SO2 pollution is caused by combustion of fossil fuels with a smaller part from decomposition of vegetation. Most of the sulphur derived from burning of fossil fuels is emitted in gaseous form as SO2. The sulphur dioxide deposition rate P d atmospheres can be classified as P 0(P d≤10), P 1(10<P d≤35), P 2(35<P d≤80) and P 3(80<P d≤200). Using this classification, as can be seen from Table 2, Xisha was classified into the subgroup S 2P 0.
Environmental conditions of natural exposure site in Xisha atmospheric corrosion station
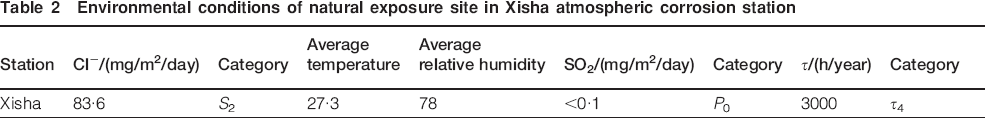
Atmospheric corrosion is an electrochemical process and proceeds only when the surface is sufficiently wet. The corrosion rate increases with air humidity, starting from the ‘critical’ humidity value, where the adsorbed water layer begins to act as an electrolyte. Table 2 also shows the TOW values for test site and their corresponding classification according to ISO 9223 norm. The external atmosphere is divided into five categories in light of the τ value: τ 1 (τ≤10), τ 2 (10<τ≤250), τ 3(250<τ≤2500), τ 4(2500<τ≤5500) and τ 5(τ>5500). Thus, the Xisha Islands are classified as the higher category τ 4.
Mass loss of specimens
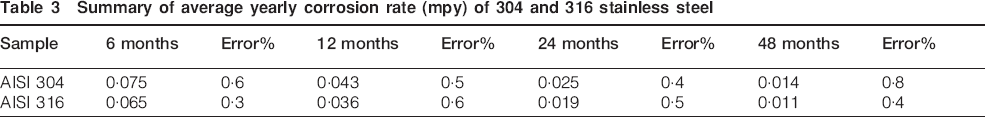
The corrosion rate of the AISI 304 and AISI 316 stainless steel is evaluated using weight mass loss methods for different exposure times. All the data are the average value determined for three independent coupons. The expected error limits are in the range of 1%. Table 3 shows the average yearly corrosion rate of 304 and 316 stainless steel in tropical marine environments. The results obtained confirm that the atmospheric corrosion rates for AISI 304 were higher than the AISI 316 stainless steel, which are due to the high Cr, Ni and Mo elements. On the other hand, it is of practical importance to know that the atmospheric corrosion rate of austenite stainless steel decreases with increasing exposure time. The decrease in the corrosion rate with exposure time is probably due to the formation of adherent corrosion products on the stainless steel surface. The corrosion product film becomes denser with continued exposure, thus providing a thicker, more protective coating on the surface.
Summary of average yearly corrosion rate (mpy) of 304 and 316 stainless steel
Several models are widely used to predict the long term atmospheric corrosion of steel. Mikhailovski et al.10 used a mixed linear–exponential equation, according to which a plot of corrosion against time would consist of an initial parabolic portion followed by a straight line. McCuen and Albrecht11 compared both models on the basis of atmospheric corrosion data for weathering steels reported in the United States, concluding that the experimental data fitted the power–linear model better than the power model. Morcillo et al.12 studied the goodness of the power model, which shows the greater simplicity than the power–linear model, on the basis of all the information compiled for low carbon steel, zinc, copper and aluminium of corrosion data obtained for exposures of 10 years or more.
Thus, to predict the mathematical model of the austenite stainless steel in the tropical marine atmospheric corrosion, the data for 4 years of outdoor exposure were used. The variation of weight loss C due to corrosion expressed as milligrams with time t can be described by the general very well known equation

Townsend and Zoccola13 used linear regression analysis to fit straight line to a log–log plot of weight loss versus exposure time. To determine how the corrosion data obtained at the Xisha station network fitted equation (1), log–log plots were prepared showing the variation in stainless steel corrosion over the 4 years of exposure in the marine atmospheres. Figure 3 shows the mass loss of AISI 304 and AISI 316 stainless steel during the 4 years of exposure in Xisha stations. As can be seen from Fig. 3, the mass loss against exposure time is in log–log coordinates. The line segments can be fitted by equation (2) by taking logarithm of equation (1)

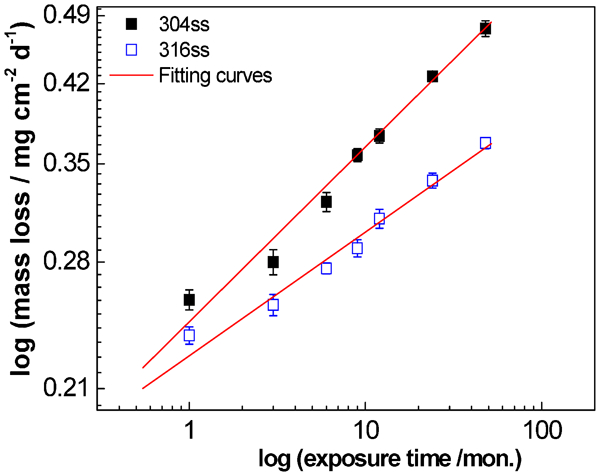
Mass loss of two stainless steels with exposure time
As can be seen from Fig. 3, It is obvious that the slope of AISI 316 stainless steel is smaller than that of the AISI 304 stainless steel. The different slope of the log–log plot means that the AISI 316 and AISI 304 stainless steel show the different kinetics of atmospheric corrosion during the period of exposure in tropical marine environments. The mass loss data for both AISI 304 and AISI 316 exposed at Xisha station, where it can be seen that the points lie close to a straight line. Thus, it is reasonable to accept the verification of a power function kinetic law to estimate the long term corrosion of stainless steel under tropical marine environments.
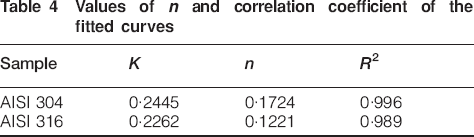
Although bilogarithmic expression is defined for exposure times over 1 year, fit procedure allows the observation of trends in the value of n. Table 4 shows the estimated values for n and the correlation coefficient R 2 of the fitted curves shown in Fig. 3. According to Benarie and Lipfert,15 equation (1) is a mass–balance equation and suggests a diffusional process that determines the atmospheric corrosion rate. Such a rate depends on the diffusional properties of the corrosion products layer existing between the metal base and the atmospheric environment. n could be used as an indicator for the physicochemical behaviour of the corrosion layer and hence for its interactions with the atmospheric environment. The value of n would thus depend both on the metal concerned, the local atmosphere and the exposure conditions. If the value of n is between 0·5 and 1, the corrosion products are not sufficiently protective, which is due to acceleration of the diffusion process. On the other hand, if the values are <0·5, it indicates a decrease in the diffusion coefficient with time, sometimes a parabolic growth of the layer by formation of protective corrosion products. Although, with n close to 0·5, it can result from an ideal diffusion controlled mechanism when all the corrosion products remain on the metal surface. As can be seen from Table 4, very high correlation coefficient R 2 is found in the test station. It is noted that in the tropical marine atmosphere environments, both n value of the AISI 304 and AISI 316 stainless steel are all <0·5, indicating the corrosion deceleration process during the whole period of exposure, and the corrosion products formed on stainless steel inhibit the corrosion process. In addition, the n value of AISI 316 is lower than that of the AISI 304 stainless steel, which shows the higher corrosion resistance of AISI 316 stainless steel in the tropical marine environments. Thus, the value of n can be used to predict the corrosion resistance of stainless steel in the tropical marine environments, indirectly.
Values of n and correlation coefficient of the fitted curves
Rust morphology and chemical analysis
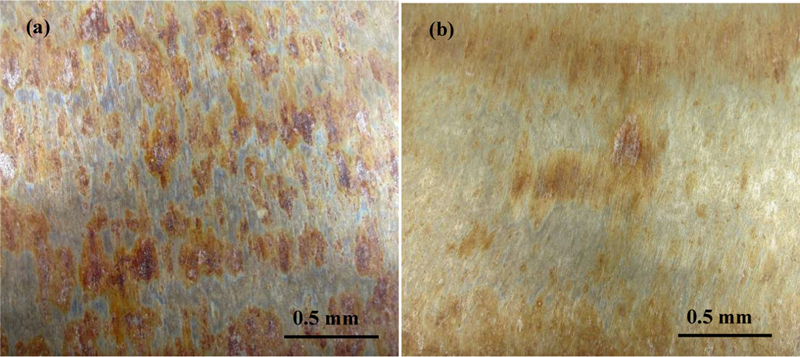
Figures 4 and 5 show the morphology of the AISI 304 and AISI 316 stainless steel exposed for 1 and 48 months in Xisha. Owing to its marine special environment, the stainless steel suffered from the corrosion. As is shown in Fig. 4a and b, the surface of the two stainless steel is covered with red brown rust; the corrosion sites initiates at the localised areas of the surface; the corrosion products, as dots or flakes, are usually scattered; and the remaining places show obvious metallic luster. As can be seen from Fig. 5, with time, the rust layer of AISI 304 becomes a dark brown one, while that of the AISI 316 stainless steel is still covered with a red brown one. The surface is covered by a lot of rusty layer and gradually loses metallic luster. The whole stainless steel exhibits a characterisation of typical pitting corrosion. In any case, the AISI 316 stainless steel has good atmospheric corrosion resistance than the AISI 304 stainless steel in tropical marine environments.
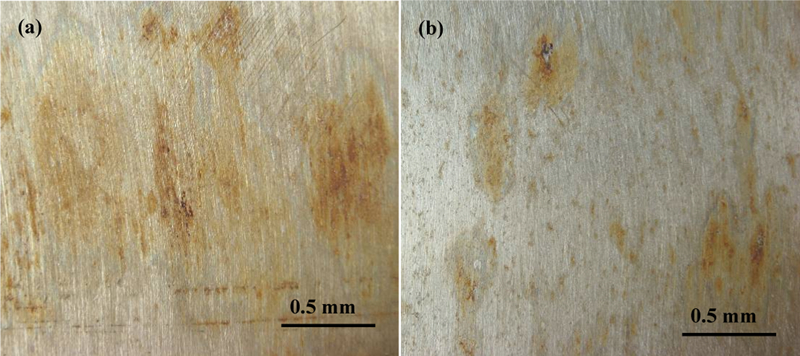
a AISI 304 stainless steel; b AISI 316 stainless steel
a AISI 304 stainless steel; b AISI 316 stainless steel
Figures 6 and 7 show the surface appearance of the stainless steel after 1 and 48 months of exposure to the marine atmosphere. As is shown in Fig. 6, both of the specimen surfaces have some rust layers after 1 month in the tropical marine atmosphere environment. The rust dots are distributed discretely on the matrix, and the buff thin rust layer formed in some parts. The rust layers present considerable cracking. The rust layer on the AISI 304 is loose and much more compact on the AISI 316 stainless steel. While, after 48 months of exposure, as is shown in Fig. 7, both of the specimen rust layers become thicker, and some of the rust layer are dropped. It is apparent that there are some micropit and deposit adhesion to the substrate under the rust layer. The rust layer coverage of the AISI 316 stainless steel is lower than that of AISI 304 stainless steel.
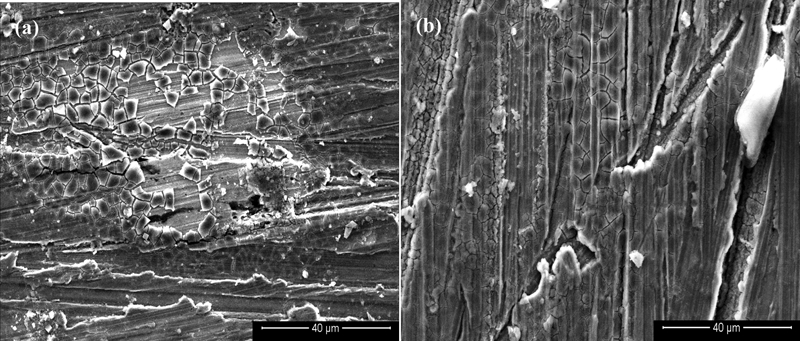
a AISI 304 stainless steel; b AISI 316 stainless steel
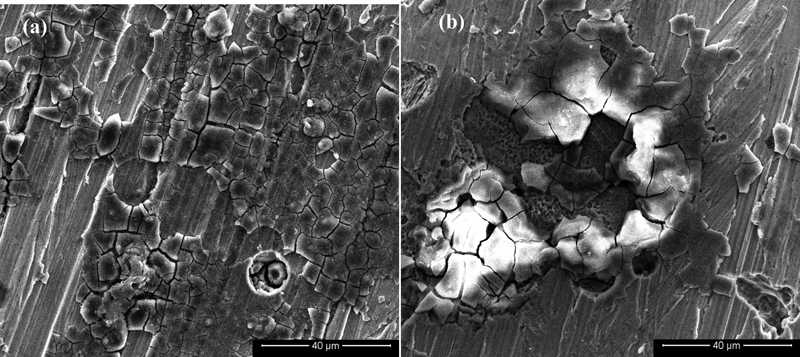
a AISI 304 stainless steel; b AISI 316 stainless steel
Atmospheric corrosion is an electrochemical reaction under a water thin film on the surface of materials.16 With the sole factor of surface water film in an ordinary atmosphere, the passive film of a stainless steel will not be destroyed. Even if destroyed, it can self-rehabilitate easily. However, when dust deposits exist, crevices formed under the deposit. The water film will then be kept easily, and the supply of oxygen will be blocked. When a passive film is dissolved under certain pollution conditions and corrosion starts under the deposit, the concentration of the dissolved oxygen there will decrease, and then, a secluded cell forms that will facilitate the corrosion progress. Some research17 have proven that the stainless steel was smooth and clean when they were newly exposed. Dust was not easy to deposit on the coupons with the wash of rain. After the loss of gloss with time, dusts started to be easy to deposit on the coupons. Corrosion was always observed at dust deposits and was in a form of pitting. The rust spots are more by amount but less developed on the upper side of the coupons. It is difficult for dust to deposit on the lower surface of the coupons, but once deposited, it is difficult to be cleaned and dried.
The corrosion products of the stainless steel are analysed by Raman spectroscopy. As is shown in the Fig. 8a, the main peak is non-symmetrical, which means that it is superposed by many peaks. Therefore, the Lorentz analytical method is shown in Fig. 8b and c, in which the fitting curve is in coincidence with the original curve.
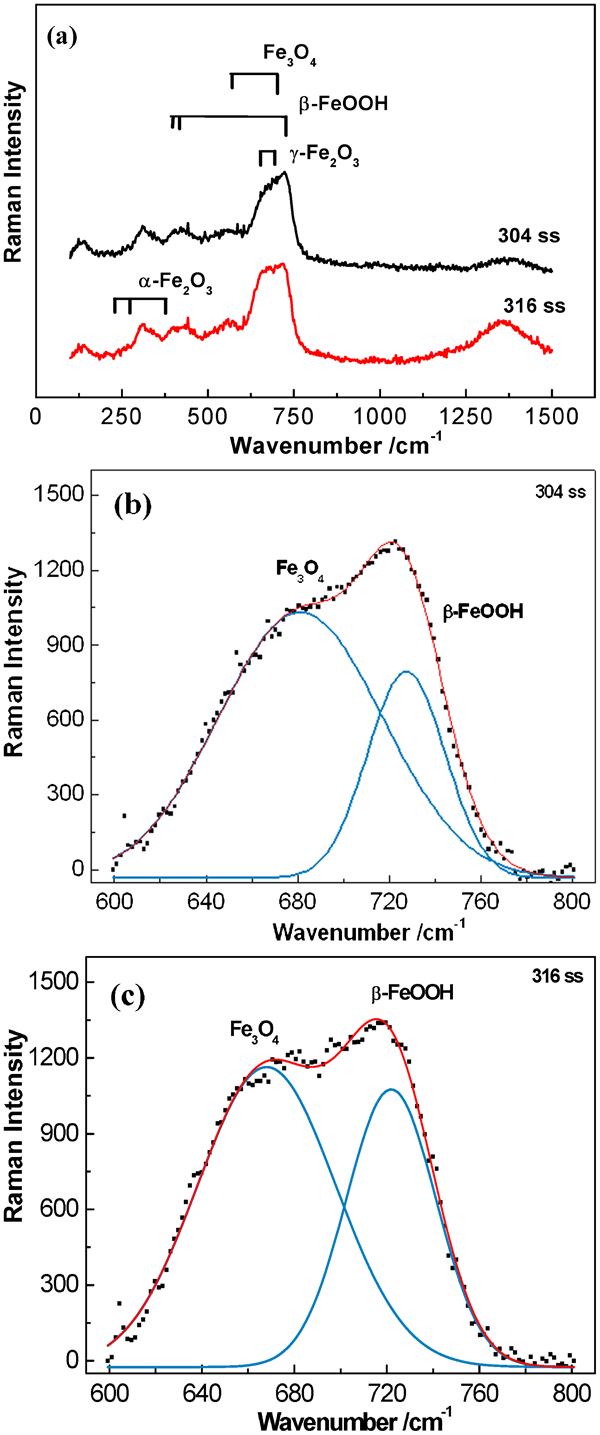
a Raman spectroscopy of AISI304 and AISI316 stainless steel; b Details of the 600-800 cm−1 region of 300 ss; c Details of the 600-800 cm−1 region of 316 ss
According to Raman bands of reference iron oxide compounds in previous papers, 18 18,19 the corrosion products of AISI 304 stainless steel after 48 months of exposure are mainly identified to be the magnetite Fe3O4 (bands at 675 and 550 cm−1), akaganeite β-FeOOH (bands at 745, 410 and 330 cm−1) and maghemite γ-Fe2O3 (bands at 740, 650, 505, 380, 350 and 263 cm−1 in this spectrum). The percentages of Fe3O4 is ̃60%, β-FeOOH is ̃35% and γ-Fe2O3 is ̃5%. The products of AISI 316 stainless steel are mainly the magnetite Fe3O4 (65%), akaganeite β-FeOOH (32%) and hematite α-Fe2O3 (3%) (bands at 612, 500, 413, 293, 245 and 226 cm−1). The percentage of the Fe3O4 and β-FeOOH are different in the rust layer of the two stainless steels.
Atmospheric corrosion of the stainless steel is also an electrochemical process in which the iron substrate reacts with oxygen from the atmosphere and the electrolyte present on the surface. The final products are hydroxyl oxides and/or oxides of iron as shown in equation (3)

Pits morphology and depth
Figure 9a and b reveals an example of pit morphology of two stainless steel after 1 month of exposure in tropical marine environment of Xisha. Xisha has the most severe tropical marine environment, characterised with high temperature and humidity, high salt fog and long daylight. During the 1 month of exposure, both of the stainless steel have suffered from corrosion. As is shown in the Fig. 9a, the surface of the AISI 304 stainless steel is destroyed, and one superficial shape corrosion pit is observed. More little pits are also observed in the bottom of the corrosion pit. The breakdown of the passive layer in stainless steels has been reported to initiate at defective sites of the passivating oxide.24 The pit morphology of the AISI 316 is shown in the Fig. 9b; it is obviously seen that superficial shape corrosion pits are formed by several small superficial shape corrosion pits. The pit morphology is nearly the same with that of the AISI 304 stainless steel. However, the size of the signal pit is smaller than that of the AISI 304 stainless steel. Moreover, the pits depth on the AISI 304 is deeper than that on the AISI 316 stainless steel. Paik et al.25 have pointed out that manganese sulphide inclusions play a special role in pitting of stainless steels. The dissolution of MnS inclusions can represent the first step for the onset of pitting. With the time prolonged to 48 months, as shown in the Fig. 10a, the previous superficial shape corrosion pit has disappeared. A typical large roundness pitting corrosion is formed. However, compared with Fig. 9b, the previous superficial shape also existed. The size of the corrosion pit becomes larger. There are many little pits scattered near the superficial shape corrosion pit, shown in Fig. 10b. Thus, the process of the pitting corrosion of AISI 304 stainless steel in Xisha tropical marine environment is the superficial shape corrosion pits translation to roundness pitting corrosion. However, AISI 316 stainless steel is the superficial shape corrosion pits translation to deeper superficial shape corrosion plus new scatter small micropits.
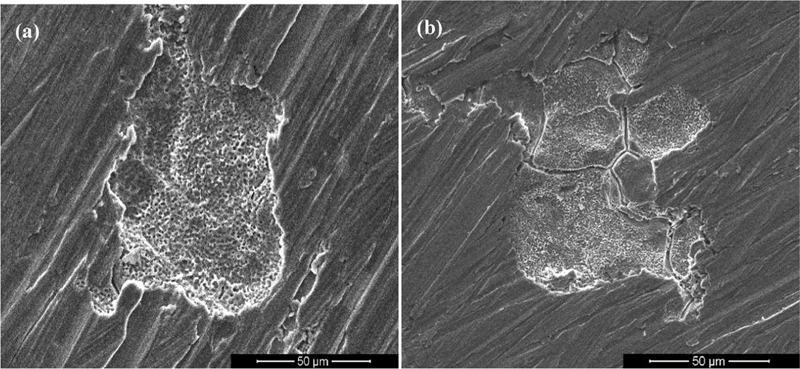
a AISI 304 stainless steel; b AISI 316 stainless steel
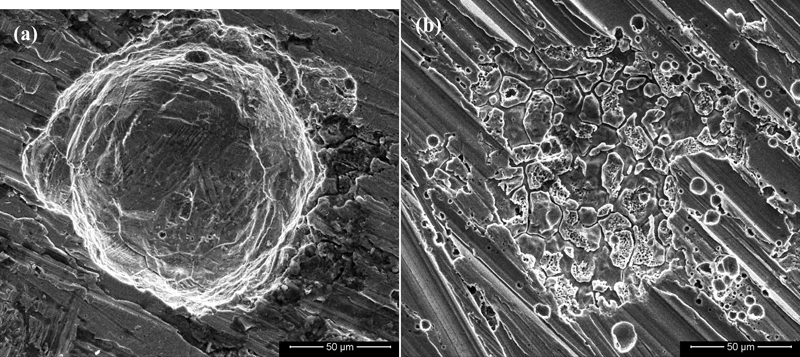
a AISI 304 stainless steel; b AISI 316 stainless steel
Figure 11 shows the maximum pitting depth of the AISI 304 and AISI 316 stainless steel changing with the exposure time. It is seen that the two stainless steels are more and more deeply in depth of the pits. However, depth changes of AISI 304 stainless steel are even more obvious than those of the AISI 316 stainless steel.
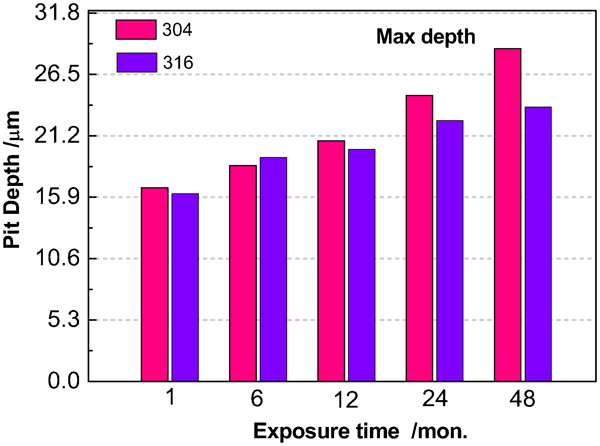
Pitting depth of AISI 304 and AISI 316 stainless steel after different exposure in tropical marine environment
Conclusions
The atmospheric corrosion of AISI 304 and AISI 316 stainless steel in tropical environments in Xisha Islands over 4 years of exposure are observed by the weight loss experiments, the corrosion products formed on the specimens are identified by laser Raman spectroscopy and the surface morphology after different exposure time is observed by SEM. The main conclusions obtained from this work are presented below.
1. The deposition rates of the chlorides are 83·6 mg m−2 d−1 in tropical marine environment in Xisha Islands. The corrosion rates for AISI 304 and AISI 316 stainless steel, in general, tend to decrease as the exposure time increases.
2. The variation of n values indicates the degree of corrosion process; both n value of the AISI 304 and AISI 316 stainless steel are all <0·5, indicating the corrosion deceleration process during the whole period of exposure. The value of n may be used to predict the corrosion resistance of stainless steel in the tropical marine environments, indirectly.
3. The corrosion products of AISI 304 stainless steel after 48 months of exposure are mainly the magnetite Fe3O4, akaganeite β-FeOOH and maghemite γ-Fe2O3, while the products of AISI 316 stainless steel are the magnetite Fe3O4, akaganeite β-FeOOH and hematite α-Fe2O3.The percentage of the Fe3O4 and β-FeOOH are different in the rust layer of the two stainless steels.
Footnotes
Acknowledgements
This work is supported by the Program for New Century Excellent Talents in University (grant no. NCET-11-0574) and the National Natural Science Foundation of China (grant no. 51131005).