
Abstract
Localised or pitting corrosion can be detrimental for steel pipes and containment structures, since wall perforation may cause system failure. Herein maximum pit depth quantification and its development with time are considered for samples taken from longitudinal welds on 33-year-old tubulars exposed in Newcastle Harbour. Relationships between pit depth and material metallurgy and corrosion properties were investigated by means of standard macro-etching, rest potential and zero resistance ammetry techniques. It is considered that the observed results are the result of the lack of homogeneity at the corrosion interface caused by differences in grain size, grain structure and the potential for pitting to occur preferentially along boundaries. The results are compared to measurements for longitudinal welds obtained previously on samples of API X56 Spec 5L pipe exposed in similar waters for up to 3·5 years, showing a reasonable degree of consistency between the two sets of data. The reasons for this are discussed.
Introduction
Welding is an important factor for steel infrastructure, since welded assemblies fabricated from carbon and low alloy steels are found in most heavy industrial applications, including marine structures and pipelines. Particularly under less than adequate maintenance regimes these steels may suffer corrosion damage with potential loss of structural integrity and potential consequences. However, as outlined in the previous paper, 1 there is relatively little quantitative information about the resistance of welds to pitting corrosion,2–5 and there are differences of opinion as to whether the weld metal (WM) is less resistant or more resistant relative to the parent metal (PM). 6 It seems reasonable to assume that susceptibility to pitting will depend on metal composition and grain structure as influenced by welding temperature and by the cooling rate, both functions of the welding procedure employed. 7 Metal composition and grain structure may be different for each of the PM, the heat affected zone (HAZ), and in the WM which may result in conditions favouring localised galvanic corrosion.8,9
Although modern electrochemistry literature7,10 sometimes restrict the term ‘pitting’ to a local breach of a passive surface, herein the term is applied also to localised corrosion for mild and low alloy steels, consistent with much corrosion literature.10–12 It then follows that quantification of the maximum pit depths (localised corrosion depths) that are likely to occur in the PM and in the weld zones (WZs) is important for predicting future and remaining structural life. 13 The present paper is concerned with the quantification of pit depth as a function of exposure time relevant to infrastructure applications, that is with years and decades rather than hours, days or weeks. It considers the different corrosion rates of the WZ, the HAZ and the parent metal zone (PMZ) and the influence of microstructure. In particular, the present paper reports on a study of the statistical characterisation of pit depths measurements on longitudinally welded near circular steel piling exposed for some 33 years in Newcastle Harbour. The results are compared with the results and trends reported earlier 1 for maximum pit depth measured on steel welded pipe coupons exposed to similar Pacific Ocean seawaters for up to 3·5 years. The results are also considered in the light of selected electrochemical test observations on the same WZ regions.
Experimental
Physical examination
The four steel tubular pilings used in the present study were recovered from Newcastle Harbour as part of maintenance and replacement of the supports at the docking wharf. From each tube three samples were cut with a conventional oxy torch. Care was taken to ensure that representative samples were cut from each of the zones. Coupons were cut to a suitable size (250×250 mm) with the weld of interest located in the centre of the sample to ensure that the heat generated by the flame cutting process would not compromise the microstructure and composition at the centre of the sample. The coupons were then macro-etched so that the grain boundaries could be recognised by simple visual inspection with use of proper magnification. Each zone was examined carefully for pitting and in particular for the location of the deepest pits. Figure 1 shows the size adopted for each zone and a typical set of locations of the 10 deepest pits in each zone. Depths of the pits relative to the surrounding metal were measured using a dial gauge with 0·002 mm sensitivity.
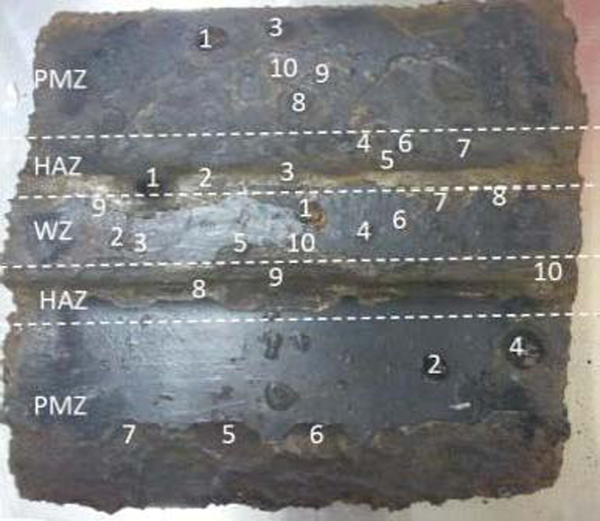
Typical set of 10 deepest pits in each zone (PM, HAZ and WZ)
Metallographic examination
Since, as noted, pitting corrosion may result from in-homogeneities in steel composition, samples of the weld area, HAZs and the PM were submitted to metallurgical and chemical examination. The samples were obtained by slow, wet saw cutting of the coupons, ensuring that the procedure would not generate enough heat to compromise the microstructure. The samples were polished to a 1 μm finish, etched in 2% nital solution and analysed by optical emission spectrometry (direct sparking) at a certified local materials testing laboratory (Fig. 2). Sparking was conducted on the cross-section with each analysis area having ∼5 mm in diameter, meaning that variations in composition on a smaller scale are unlikely to be captured.
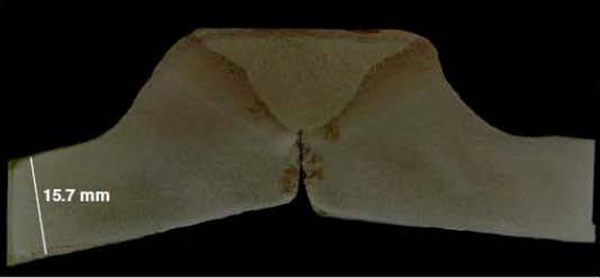
Sample macro-etched cross-section examined
Electrochemistry experiments
Standard electrochemical open circuit potential E corr measurements were conducted for each zone. Mirror finish polished samples mounted in epoxy, and local natural seawater was used as electrolyte (Table 1). Tests were conducted at a temperature of 20°C, using platinum electrode with approximately the same surface area as the counter electrode and standard KCl electrode as reference electrode. The electrodes (Fig. 3) were placed in acrylic ports which were flushed sealed to a glass container. During such a test, no current or potential is applied to the cell. Potential measurements were recorded when either of the following conditions was met: variation of >3 mV or every 30 s. A BioLogic VSP-300 data acquisition workstation was used. The tests were concluded after sufficient time was allowed to ensure stability of the readings (∼16 h).
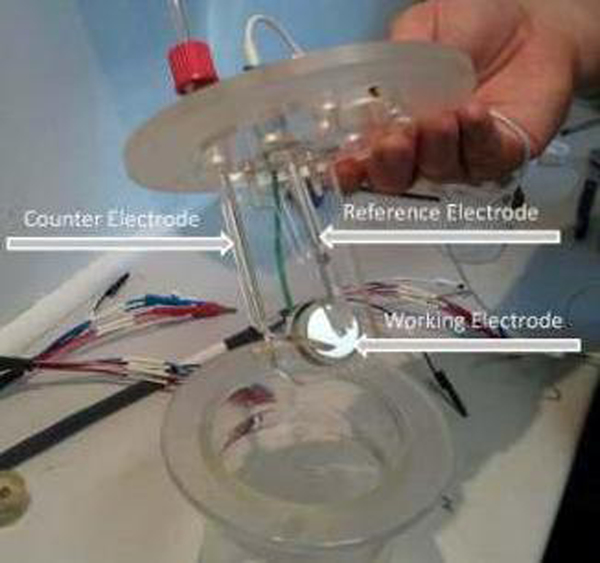
Open circuit E corr three electrode electrochemical cell test set-up
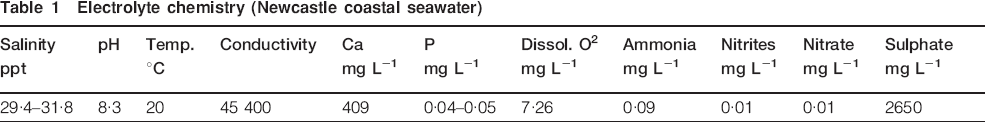
Electrolyte chemistry (Newcastle coastal seawater)
Magnitude of galvanic current flow between different zones was also measured by conducting zero resistance ammetry (ZRA) tests. This is a well established technique and commonly used to study single metal corrosion processes in subsea pipelines. 14 The test consists of a current to voltage converter that produces a voltage output proportional to the current flowing between the input terminals while imposing a ‘zero’ voltage drop to the external circuit. The experiment was conducted in cycles and lasted 24 h each run: Initially having the electrodes resting for 15 min in solution, followed by a 2 h connection, left to rest for 30 min, connected for 2 h, and so forth. The same standard KCl reference electrode and natural seawater solution were used. The HAZ sample acted as working electrode. The macrocell current was measured between the WZ in the first experiment and subsequently between the PM (counter electrode).
Results
Metallurgy
Figure 2 highlights a changing grain structure between HAZ, WZ and PMZ for the samples studied herein. Figures 4–6 show these differences in more detail. Typical low carbon steel consists of two dominant phases, ferrite and pearlite, as shown. However, the heat gradient generated by the welding process and subsequent differential cooling solidification rates alter the original PM microstructure in the vicinity of the weld. 8 The HAZ although treated as one area in this study, comprises of two main regions: a fine grained region beside the PM and a coarse grained region beside the weld fusion line along with a gradual transition between the two. Table 2 shows the chemical composition as obtained from testing of the metal in each of the WZs at a commercial laboratory as well as previous field exposure coupons from previous study that used coupons cut from API Spec 5L X56 steel pipe. 1 The PM composition is consistent with a range of low carbon grade of steels (e.g. SAE 1025), 15 while the WM differs slightly from the base metal due to a lower carbon content and a slightly higher silicon level.
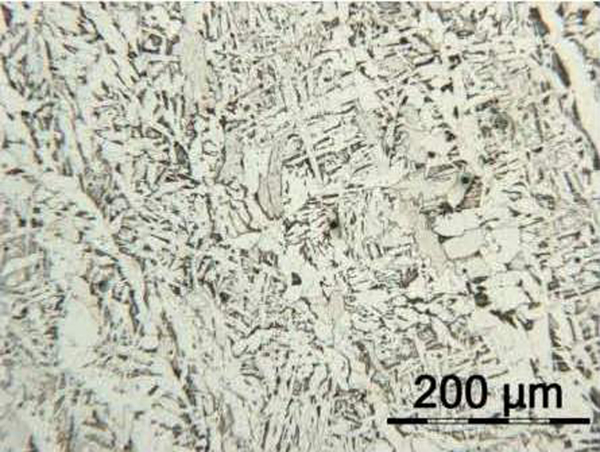
Optical microstructure of WZ microstructure showing directional solidification structure and comprising of columnar and acicular ferrite (white) and pearlite (black)
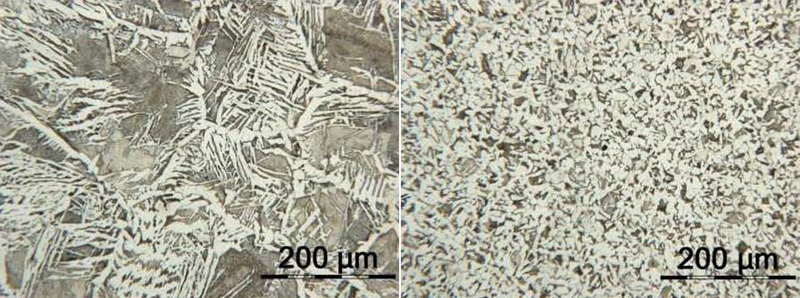
Optical microstructure of HAZ (left) displaying large grains of pearlite with Widmanstätten ferrite and (right) finer grained region exhibiting equiaxed grains of ferrite and pearlite
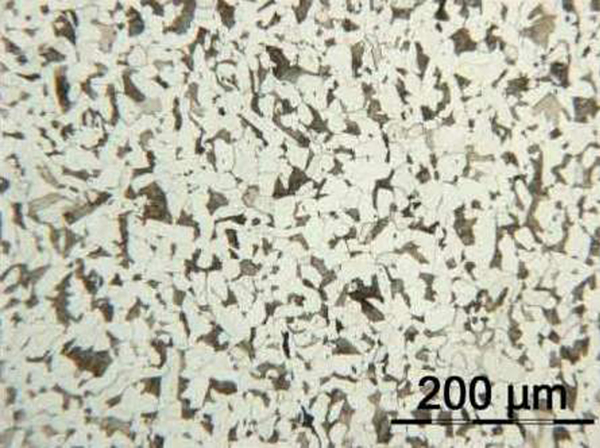
Optical microstructure of PM exhibiting equiaxed grains of ferrite and pearlite, consistent with hot rolled, low carbon grade of steel
Chemical composition of samples weld areas/wt-%
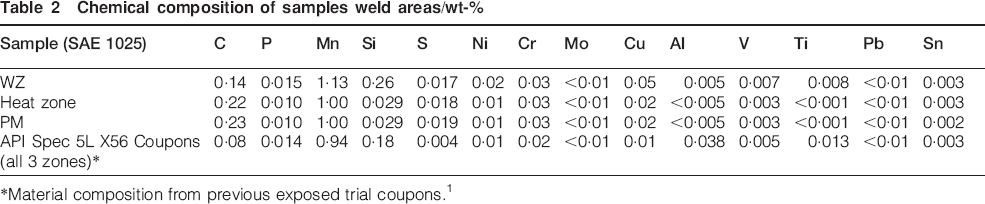
*Material composition from previous exposed trial coupons. 1
Electrochemistry
The rest potentials for each zone were determined (Fig. 7) and are 0·76 V for the HAZ, 0·75 V for the WZ and 0·74 V for PMZ after 16 h in solution. A potential difference of ∼10 mV is observed between the HAZ and its adjacent PMZ and WZ.
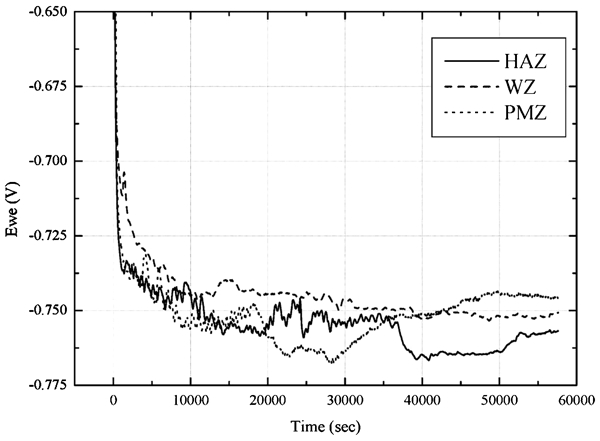
Open circuit potential results for each of zones as indicated
Small variations in current are observed in the ZRA tests (Fig. 8). In Fig. 8 positive values of current (mA) shows that the working electrode (HAZ) behaves anodically in relation to the counter electrode (WZ as dotted line or PMZ as solid line). Considering the galvanic effect between PMZ and HAZ, even though the HAZ behaves anodically for the majority of the time, there are still some periods of cathodic behaviour. This appears to be also the case between WZ and HAZ were, however, more periods of cathodic behaviour are observed.
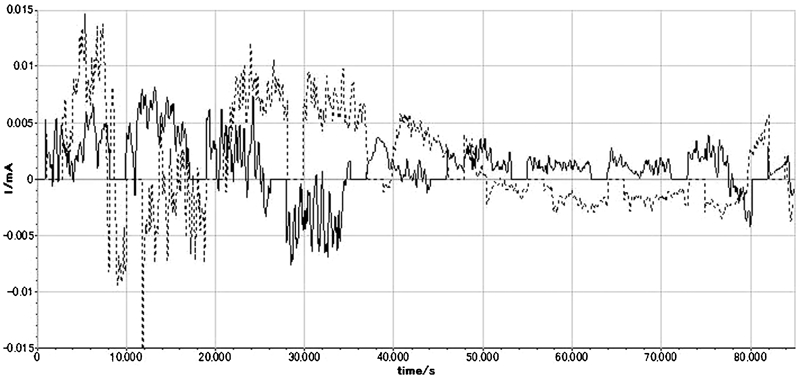
Results of ZRA having HAZ as working electrode against WZ (dotted line) and PMZ (solid line)
Pit depth readings
The pit depths measured on the samples are relative depths. To obtain estimates of total (or absolute) the pit depth measurements were corrected by adding the estimated uniform or general corrosion (original thickness is known due to reports from the local port corporation). This was done by assuming that the mass loss of the total coupon was roughly uniform all over and large enough that the error in neglecting the mass loss within the pits themselves could be ignored. This approach has been used in previous investigations of maximum pit depth.11,12,16 The absolute (i.e. the corrected) pit depths, as a function of time of exposure, are shown in Figs. 9–11. Results are shown for the 10 deepest pits in each zone, for each of the triplicate samples recovered from each pipe. In each case the data obtained in earlier study 1 for the period 0-3·5 years is also shown, together with the multilinear trends through the average data.
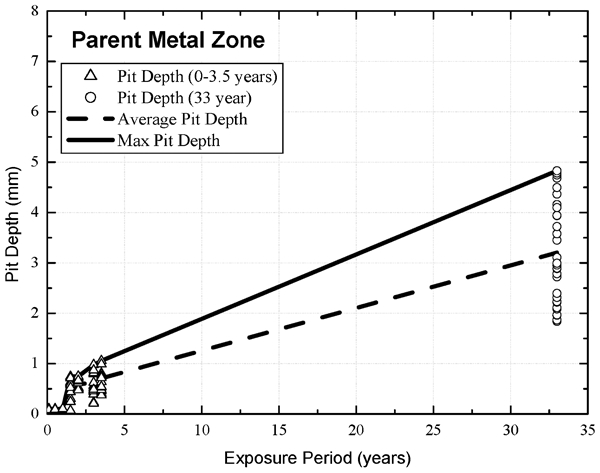
Absolute depth data mean and maximum trends for PMZ observed pits
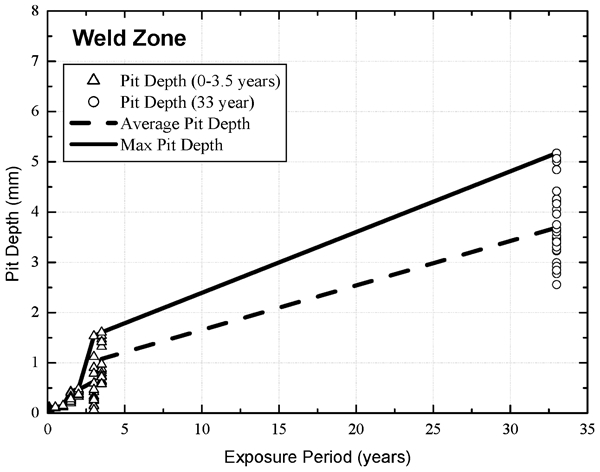
Absolute depth data mean and maximum trends for WZ observed pits
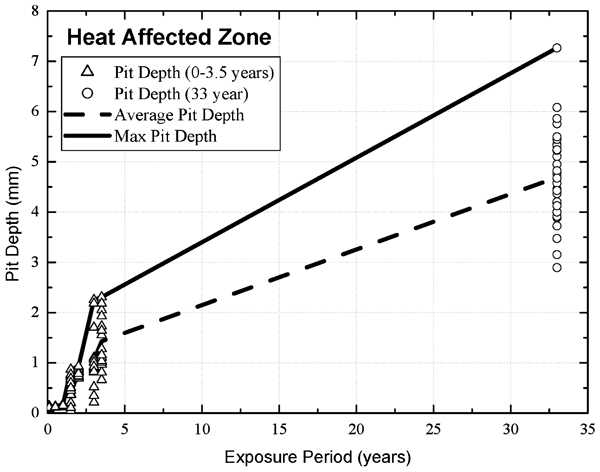
Absolute depth data mean and maximum trends for HAZ observed pits
At most exposure times Figs. 9–11 show very considerable scatter in pit depth. This was noted also previously 1 and is consistent with findings earlier for (unwelded) coupons of mild steel. 17 The data obtained from the samples collected from the Newcastle Harbour steel piling only provide information for single point in time (33 years) but it appears reasonable to extrapolate from the previous results (up to 3·5 years) to the data at 33 years based on previous interpretations of longer term corrosion sown in the literature.11,12,18,19 The mean trend in each case is consistent with expectations despite the high variability in the data at certain periods of exposure and the (admittedly small) difference in the steel composition between the API pipeline mild steel 1 and the mild steel piling (Table 1). An important practical observation is that the considerable difference in maximum depth between the three zones observed for 0-3·5 years is preserved for the 33 years exposures.
Discussion
Typically the base metal experiences temperatures ranging from ambient at a distance away from the weld to the melting point at the fusion boundary during welding.9,20 As a result, metallurgical and microstructural transitions occur across both the WM and the HAZ, and it can be expected that these could influence corrosion behaviour. The previous experiments over a period of 3·5 years exposure 1 showed that the deepest pits tended to occur in the HAZ and that this was the case throughout the exposure period. In addition, the maximum pit depth differed considerably between the zones.
The greater pit depths on the HAZ have been proposed to be the result of differences in microstructure and in steel composition. 3 There is also empirical evidence that small differences in composition can influence the depth of pitting for smaller individual coupons without welds,19,21 but this observation may not extend to long corrosion zones such as welds along pipelines and for the extended HAZ along these welds. Despite improvements in weld technology, typically there are some (perhaps slight) differences in the chemical composition of the material in the three zones, as exemplified in Table 2.
However, Table 2 also gives the chemical composition of the steel, as obtained by two independent testing laboratories in the previous investigation (API Spec 5L X56). 1 No weld filler metal is used in seam welded pipes. For this reason it is well known in the industry that the chemical composition of the three zones is essentially identical. 20 This supports the proposition that differences in pitting cannot be a result of composition differences. On the other hand, Figs. 5–7 shows that there are differences in microstructure. This tends to support the notion that differences in microstructure influence pit depth. 2 Such differences can result in dissimilar metal couples that can produce macroscopic galvanic corrosion.10,22 Figure 12 shows micrographs of the samples from the present study that depict possible evidence of localised pitting which appears to have initiated between grain boundaries, presumably due to anodic segregation. It also is likely that each location within the weld region (PM, HAZ and WZ) will have its own microstructural features and thus corrosion susceptibility. More generally, the use of filler metals with compositions different from the base material may produce electrochemical potential differences.23,24,25
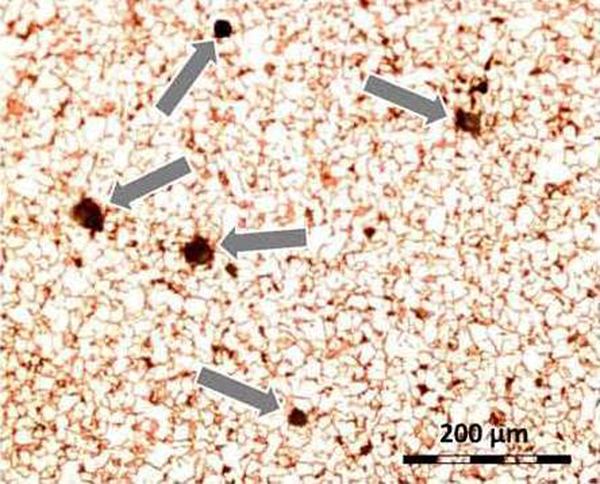
Micrograph of HAZ showing presumably localised intergranular corrosion
Furthermore, the electrochemical rest potential experimental result show that the PMZ is slightly more noble compared to the HAZ and WZ (Fig. 7). Even though these results are at a small scale, they suggest that the different constituents in the banded weld structure could form galvanic couples at the microscopic level when exposed to corroding environments leading to localised galvanic corrosion. The ZRA results (Fig. 8) show anodic behaviour of the HAZ and possibly this is the result of the sheer size of the PMZ surface compared to the HAZ surface area.
Several other factors may have contributed to the observed behaviour in the present study. For example, it is known that electric resistance welded carbon steel (without filler metal) exposed to seawater can suffer selective corrosion attack on the weld seam. 26 This has been attributed to pits initiating on MnS inclusions that tend to be concentrated in the weld as a result of the rapid heating and cooling that occurs during electric resistance or induction welding. This produces S-enriched zones in the matrix surrounding the inclusions. 26
In practice, a wide range of HAZ microstructures has been observed. 27 For example, preferential HAZ corrosion in seawater reported in the 1960s was attributed to the presence of low temperature transformation products such as martensitic, lower bainite, or retained austenite.22,28 It follows that steel compositions favouring increased hardenability (e.g. increase in manganese or alloy content) may lead to increased localised corrosion. Similar microstructural considerations are likely to apply to the preferential corrosion of WM.
In summary, the present results and analysis indicates that localised pitting corrosion at and near welds is caused by adjacent grains of slightly different composition or grain structure or morphology permitting the development of localised anodic and cathodic regions, thus allowing the formation of galvanic couples. As noted, and as well recognised, typically, grain size, element composition and crystal structure all vary across a weld. As a result, such areas may be preferentially attacked. 12 There is also the possibility of involvement of bacteria and other microorganisms; however, their effect on weld corrosion remains to be clarified.
From an industrial point of view, corrosion is accounted for during the design phase by means of a corrosion allowance. The present study provides evidence that corrosion observed in the PM is less than that in the HAZ and this continues also long term. This may mean that conventional corrosion allowances, if based on coupon tests without welds, could be inadequate. There could be an implication also for the fatigue resistance of welds, since pitting is known to increase susceptibility to fatigue cracking. The effect of residual stress on welds and post-weld het treatment also has not been included in this study. These appear to be open questions for future research, particularly in relation to long term effects.
Conclusions
The maximum pit depth in the HAZ for longitudinal welds on pipeline steels is ∼25% greater than for the adjacent PM and WZs after 2 years of exposure, then rapidly increasing to being about 50-100% greater for exposures up to 3·5 years and maintaining almost the same ratio of 80-110% greater for a 33-year exposure;
The present results from the 33-year-old steel piling appear to be consistent with the earlier results obtained under similar exposure conditions and also are consistent in a general sense with trends for maximum pit depth obtained earlier for coupons without welds. This consistency adds confidence to the possibility of extrapolation of medium term data to the longer term;
Since there were no significant differences in chemical composition of the three zones for the coupons cut from API Spec 5L X56 pipelines, together with the lack of differences in composition for the three zones for the coupons tested to 3·5 years, chemical composition cannot be held responsible for the more severe pitting observed in the HAZ.
It is proposed that the HAZ zone is more prone to pitting corrosion, and shows deeper pits, as a result of thermal microstructural gradients produced during the welding process that in turn produce increased susceptibility to the formation of galvanic cells at a microscopic level.
Footnotes
Acknowledgements
The authors acknowledge the financial support provided by the Australian Research Council, the contribution of Dr Robert Jeffrey, Karen Swain and Matt Dafter to various aspects of this project, the Newcastle Port Corporation for providing the steel piling from which samples were extracted and the technical staff from the Civil Engineering Laboratory at The University of Newcastle for providing an efficient, helpful and friendly environment for the experimental studies.