
Abstract
This paper aimed at an experimental investigation of the comparative corrosion phenomenon in the reinforcing steel of repaired chloride contaminated self-compacting concrete (SCRC) and ordinary concrete (OC) patches. This research is a continuation of a previous study in which macrocell specimens were prepared with OC having different chloride contaminations simulating the actual patch repair in the construction field. Here, in this research, the same specimens were prepared with SCRC to investigate more deeply the macrocell phenomenon in SCRC, which received limited attention in the past. Four prismatic specimens with two sets of 5 and 3% chloride contaminated SCRC at the two ends were prepared respectively, and the middle portion of these specimens was cast after 24 h with uncontaminated SCRC simulating the actual patch repair in the field. After 1 year of experimental observations of corrosion potentials and corrosion rates, interesting and novel results were obtained in comparison with OC and SCRC specimens.
Keywords
Introduction
Self-compacting concrete (SCRC) is an innovative concrete that does not require vibration for placing and compaction. It is able to flow under its own weight, completely filling formwork and achieving full compaction, even in the presence of congested reinforcement. It greatly improves concrete placement and eliminates the problem of honeycomb without the need for additional mechanical compaction resulting in higher quality and speed of construction, and more durable structures. In ordinary concrete (OC), the problem of casting concrete in congested reinforced sections has been a serious problem that requires proper and adequate compaction by internal or external mechanical vibrators operated by skilled workers.
Structural degradation due to the corrosion of reinforcing steel in OC is a major issue affecting concrete durability. When concrete is subjected to or attacked by the chloride rich environment, the liberated chloride ions from such environment reach the steel bars by diffusing through the concrete and cause corrosion. It is believed that concrete having low permeability and dense microstructure provides hindrance in chloride diffusion through the concrete body, which helps in reducing the rate of corrosion of embedded reinforcing steel. SCRC is expected to have a dense and less permeable microstructure because of its resistance to bleeding and segregation, and the production of SCRC usually involves the use of high range water reducer, super plasticiser (SP) and/or supplementary cementing materials. These supplementary cementing materials have been proven to increase the concrete corrosion resistance,1 – 3 while high range water reducers help in dispersing cement particles and reduce overall concrete permeability.4,5 Owing to these said reasons, SCRC is highly considered by some researchers as good repair material for chloride attacked corroded reinforced concrete structure patches.6
Structural retrofitting and repairs of ordinary reinforced concrete due to corrosion has been a centre of focus for researchers all around the globe. Many researchers and engineers are delving into the best suited repair techniques and materials that can provide economy and durability of the repaired structures. Many researchers have investigated the compatibility between old concrete and repair material.7 – 9 Rizwan et al.10 and Wasim and Rizwan11 investigated the macrocell corrosion phenomenon in the repaired concrete patches of the chloride contaminated ordinary reinforced concrete under ordinary and various environmental conditions. Nobody has carried out profound and deep research investigations relating to the repair of the SCRC structures, and compared the results with OC. This formulated the objectives of this research in which specimens were prepared with chloride contaminated reinforced SCRC and then repaired with uncontaminated reinforced SCRC simulating the actual patch repair in the field. The results of these SCRC specimens were then compared with the previous research on OC.10
Experimental
Materials and mix proportion
Type 1 ordinary Portland cement in compliance with the requirements of ASTM C150 was used for specimen preparation. Crushed sandstone with a maximum size of 20 mm was used as coarse aggregate with density of 2·70 g cm−3 and water absorption of 0·59%. For fine aggregate, locally available natural river sand passing through 4·75 mm IS sieve was used. Its density and water absorption were 2·65 g cm−3 and 2·21% respectively. Structuro 100, which has main component polycarboxylic, was used as super plasticiser (SP) with a specific gravity of 1·01 and pH 6·3 to achieve the desire workable conditions for SCRC. The water/cement ratio was kept 0·45, and the available tap water was used for experimentation. The ordinary SCRC mix proportions used in this investigation are shown in Table 1. NaCl of 99·9% purity was used as a source for chloride ions. Deformed round carbon steel bars 10 mm in diameter were used as reinforcing steel. The surface of steel bar was polished by sand paper no. 200.
Mix proportions
SCRC mixing, specimen preparation and curing
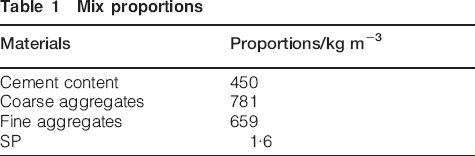
The mixing was performed in an electrically powered horizontal mixer, and the procedure of mixing was followed in accordance with ASTM C192.12 At the start of mixing, the drum of the mixer was cleaned and washed. This wetted drum mixer was loaded with the aggregates, and then, their absorption water was added. After this cement, SP and then water with dissolved sodium chloride were added so that all the materials were properly mixed together to form chloride contaminated SCRC. Immediately after completion of mixing, concrete temperature and slump flow were determined. The slump flow of this SCRC mix was found 700 mm with visibility index 1. Since in this research study the main objective was corrosion study, other SCRC workability tests like J-ring flow, V funnel test and L box test were not taken into consideration during experimentation. However, for the illustration of these tests, consider Fig. 1. The same above mix procedure and proportion was adopted to make ordinary SCRC, but in this case, ordinary water without NaCl was used during mixing along with other mix ingredients.
Self-compacting concrete test procedures
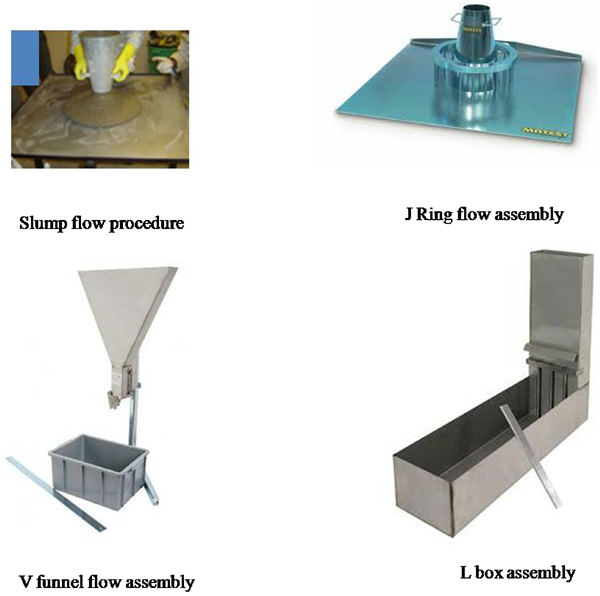
The experimental specimens for this research were derived from previous research studies,10,11 with necessary modifications to take care of the factors that have been overlooked in the past research works and thus to make the present research work original. In the previous research, an artificial macrocell was created resembling the one developed originally in case of repair works in the actual field of OC structures due to the separation of anode and cathode and the development of macrocell as shown in Fig. 2.10
Separation of anode and cathode
Similarly like previous research with OC,10 the two sides of these specimens were cast first containing 5 and 3% chloride content at the extreme ends respectively. The middle portion of these specimens was cast after 24 h with no chloride content presuming to be the repaired portion in the actual construction repairs to stop or minimise the chloride movement from contaminated to non-contaminated portion of these specimens. The specimen preparation methodology is represented in Fig. 3, and the specimens’ designation and chloride contents are mentioned in Table 2. For placing reinforcing steel bars in specimens’ moulds, the clear cover was kept 15 mm because measured half-cell potential values for OC at specimen surface could be considered as actual value at steel surface if cover depth is within 20 mm.13 Specimen dimension and chloride content at different portions are shown in Fig. 4.
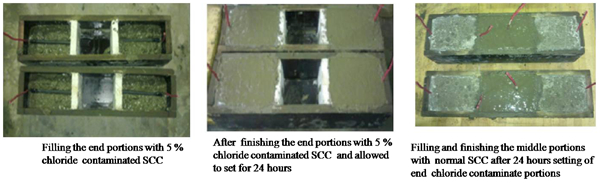
Self-compacting concrete macrocell specimen preparation
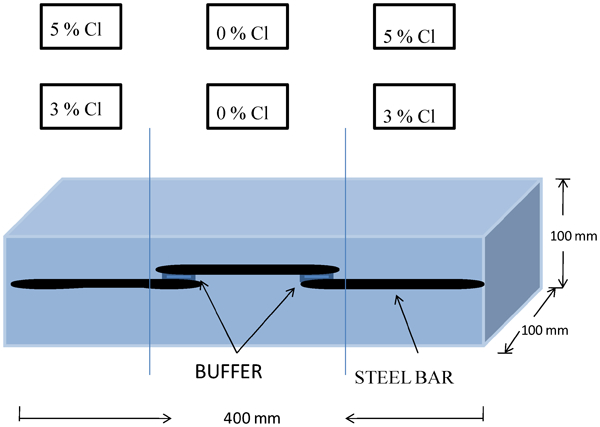
Specimen dimension and chloride content
Specimens and chloride content
Precautions were observed to avoid the formation of crevice corrosion. Crevice corrosion is a type of localised corrosion that can be developed within crevices or at shielded surfaces at concrete/steel interface where a stagnant pore solution is present. It is one of the most frequently encountered forms of localised corrosion and at the same time one of the most harmful ones. Crevices make a chemical environment in reinforced concrete, which is different from that of freely exposed surfaces, and therefore accelerate corrosion. This environment keeps moisture, traps pollutants, concentrates corrosion products and meanwhile excludes oxygen at the steel/concrete interface. It was prevented by reducing crevices in the concrete/rebar interface. Where it was not possible to get rid of crevices, precaution was taken to improve drainage and seal edges, keeping crevices as open as possible and therefore preventing encapsulation of moisture.
A comprehensive experimental measurement methodology was conducted to clearly understand the role of steel reinforcement bars in the acceleration of the corrosion rate. The steel rebar corrosion current I corr and corrosion potential E corr were measured for all specimens using a GECOR device14 and ASTM C876.15 The GECOR measures the corrosion rate as reflected by the corrosion current density and the half-cell corrosion potential. A true measure of the corrosion rate is possible by the polarisation resistance technique. It has been well established by Stern and Geary that the corrosion current is linearly related to the polarisation resistance, which gives a direct quantitative measurement of the amount of steel turning into oxide at the time of measurement. By Faraday's equation, this can be extrapolated to direct metal sectional loss. The corrosion current values in GECOR are calculated from the polarisation resistance R p using the relation I corr = B/R p, where I corr is given in μA cm−2 when R p is given in k Ω cm−2 and B = 26 mV. The I corr is directly proportional to corrosion rate through the relation corrosion rate (μm/year) = 11·6I corr. This gives a tool for quantifying the average reduction in rebar diameter over time. The measurement of corrosion rate usually involves applying electrical signal through a connection to the steel bar. In GECOR, this signal is confined to the steel rebar in a circle with a diameter of 110 mm. There is evidence that this technique gives a more accurate measurement of the corrosion rate.16 The GECOR device is quite valuable and versatile for the corrosion measurement of steel in concrete. Consider Fig. 5 as a schematic representation of taking measurement from GECOR for further illustration.
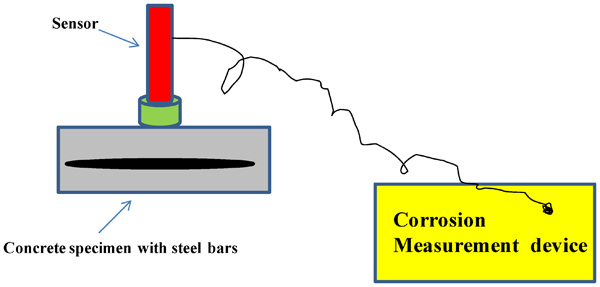
Corrosion current and corrosion potential measurement assembly
Results and discussion
Corrosion current
Corrosion current is considered as one of the most reliable corrosion measures for corroding steel and it has been used by many researchers in the world. Therefore, in this research, the corrosion current measurements were taken in accordance with standard specifications.16 After 1 year of corrosion current observations, the following results were obtained:
first, in specimens 1 and 2, which were 5% chloride contaminated at the end portion, the highest corrosion current of 4·99 μA cm−2 was obtained after 60 days, while on day 1, it was 2·78 μA cm−2 in this contaminated end portion as shown in Fig. 6. This result indicates that there is an incremental increase in corrosion rate with the time till 60 days, which can be due to the formation of macrocell (anodic in nature) between contaminated and uncontaminated ordinary SCRC portion simulating the actual patch repaired in the field. After reaching the max corrosion current of 4·99 μA cm−2, the current started to decline slowly and it reached 1·98 μA cm−2 after 365 days. This 1·98μA cm−2 is still high at this extreme end. The reason for decline in measured corrosion current with time was found to be dependent on the saturated area of concrete acting as electrolyte for the corrosion process, which becomes gradually smaller with the passage of time and age of concrete. The electrolyte present in gel and capillary pore zones reduces with successive reduction in porosity and saturation over a certain time interval and finite control volume17
second, in specimens 1 and 2, the middle 0% chloride portion simulating the actual patch repair was showing the same incremental increase in corrosion current as in the case of the contaminated portion. The highest corrosion current of 2·046 μA cm−2 was obtained on the sixtieth day, while on day 1, it was 0·28 μA cm−2 in this uncontaminated middle portion, indicating the incremental increase in corrosion current as shown in Fig. 6. This result at first shows that even though there was no chloride in this middle portion, there was high corrosion current that was increasing by time, ascertaining the chloride transfer from contaminated portion to uncontaminated middle portion. Then, it also suggests that the high corrosion current of 4·99 μA cm−2 at the two extreme ends of this high chloride contaminated specimen induced a macrocell (cathodic in nature) in the middle no chloride portion. The cathodic current in the middle portion after reaching a maximum value of 2·046 μA cm−2 started to decline and dropped to 0·86 μA cm−2 after 365 days because of the above said reason17
third, in specimens 3 and 4, which were 3% contaminated at the extreme end portion, the highest corrosion current of 2·93 μA cm−2 was obtained, while on day 1 it was 1·29 μA cm−2 in this contaminated end portion, indicating the incremental increase in corrosion current as shown in Fig. 7. This current after achieving the max value started to decline and reached 1·21 μA cm−2. This result is the same as obtained in the high chloride contaminated specimens, authenticating the experimental work and confirming the originality of this research
fourth, in specimens 3 and 4, the middle 0% chloride portion simulating the actual patch repair, the highest corrosion current of 1·313 μA cm−2 was obtained, while on day 1, it was 0·18 μA cm−2 in this uncontaminated middle portion, indicating the incremental increase in corrosion current as shown in Fig. 7. This current after achieving peak value of 1·313 μA cm−2 dropped down to 0·46 μA cm−2. This result is in conformity with the obtained results in specimens 1 and 2, corroborating the formation of macrocell and again authenticating the experimental work.
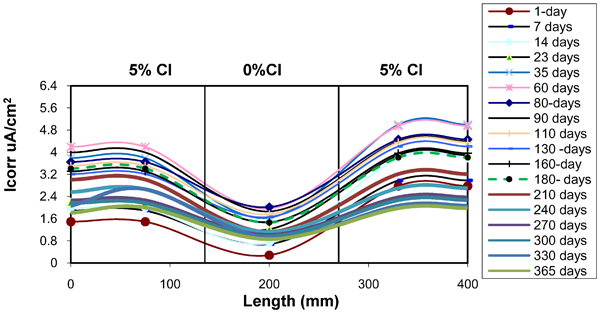
Corrosion current of 5% chloride contaminated specimen at two ends
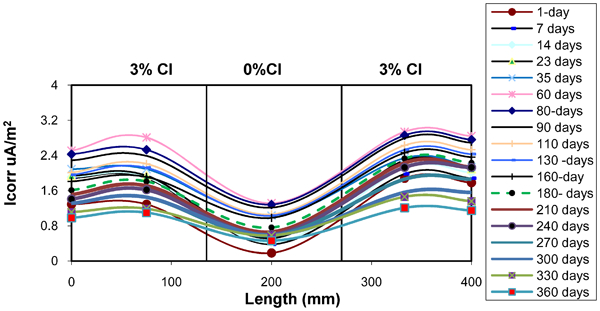
Corrosion current of 3% chloride contaminated specimen at two ends
In previous research with OC,10 the corrosion currents were not measured, and only corrosion potential measurements were taken into consideration for investigation. Therefore, in the above discussion, the comparison of SCRC with OC is not mentioned.
Half-cell corrosion potentials
Half-cell potential measurement is probably the most common method used for measuring the risk of reinforcement corrosion. There are many researchers who have conducted research on chloride induce corrosion of reinforced concrete using corrosion potential for measurements.18 – 20 The corrosion potential readings of the specimen were also taken for 1 year using copper–copper sulphate reference electrode in accordance with standard specifications ASTM C876-0915 to experimentally corroborate the objectives of this research. After 1 year of corrosion potential observations, the results were compared with the previous study on OC,10 and the following results were obtained in comparison:
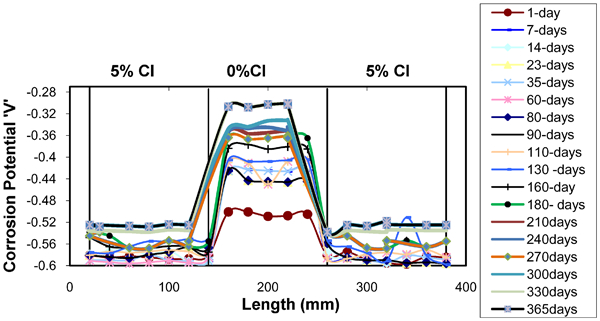
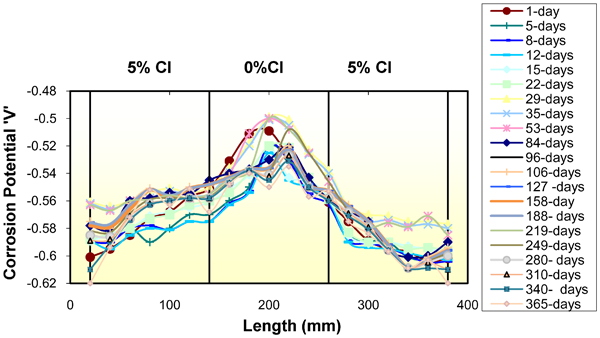
first, in specimens 1 and 2 with SCRC, the highest chloride induced corrosion potential of −0·598 V at the two extreme ends was found, however, in the middle 0% chloride portion simulating the actual patch repair; −0·505 V cathodic potential was observed as shown in Fig. 8. The reason behind this high −0·505 V potential at the middle 0%Cl portion was actually due to the macrocell formation (anodic in nature) at the extreme contaminated portion, which also induced a macrocell corrosion potential (cathodic in nature) in the middle no chloride portion. Similarly, in OC specimens,10 at the extreme ends of the 5% chloride contaminated specimen, −0·62 V was obtained while in the middle 0%Cl portion −0·55 V was obtained as shown in Fig. 9, indicating the formation of same macrocell phenomenon. It reveals from the above observation that in SCRC specimen, the cathodic potential that developed in the middle 0% chloride is less as compared to the OC specimen. This could be due to the less permeable microstructure of the SCRC, which provided more hindrance in the chloride transfer from contaminated end to the uncontaminated middle portion as compared to the OC
second, the other observation worth noticing was the declined in corrosion potential with the passage of time in SCRC specimens 1 and 2, while the same specimens with OC did not show decline. The half-cell potential was dropped to −0·525 V from −0·598 V at the extreme ends, while in the middle portion, it dropped from −0·55 to −0·301 V as shown in Fig. 9, showing the same trend as it was obtained in corrosion current observations
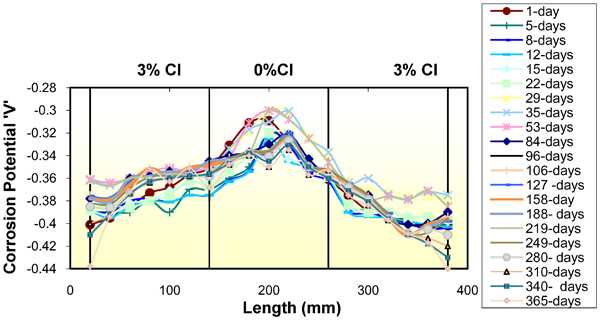
third, in 3% chloride contaminated specimens (3 and 4) at the end, the highest corrosion potential was −0·396 V at the ends, while it was −0·286 V at the middle as shown in Fig. 10. The potential at this middle portion was dropped to 203 V after 1 year similarly like specimens 1 and 2. In 3% chloride contaminated OC specimen, the highest potential was −0·44 and −0·31 V at the middle, and there was no drop in potential after reaching peak potential value as shown in Fig. 11.
Corrosion potentials of 5% SCRC chloride contaminated specimen at two ends
Corrosion potentials of 5% OC chloride contaminated specimen at two ends
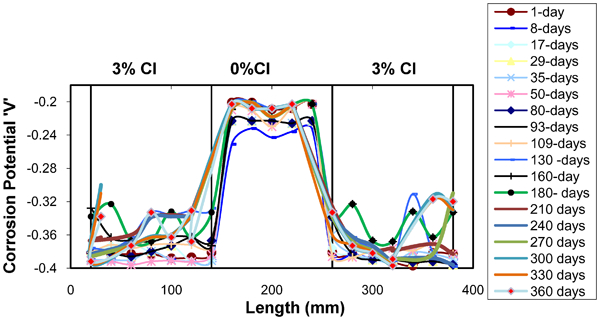
Corrosion potentials of 3% chloride contaminated specimen at two ends
Corrosion potentials of 3% OC chloride contaminated specimen at two ends
Salt content measurements in repaired portion
After 1 year of corrosion current and half-cell potential observations, the experiment SCRC specimens were split into two along the longitudinal direction to view the actual behaviour of corrosion in the specimen at the ends and at the middle portion. The results then were compared with OC split specimens:
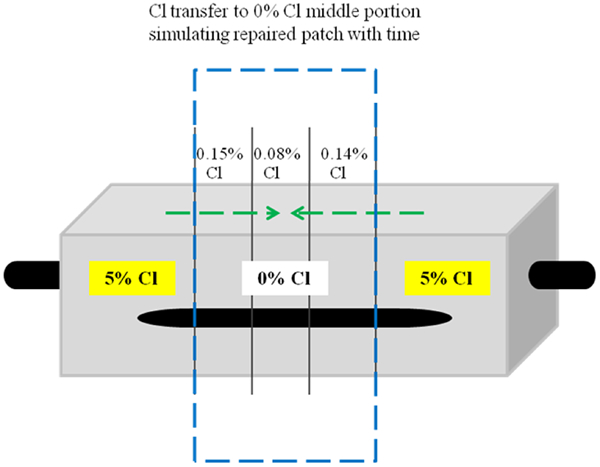
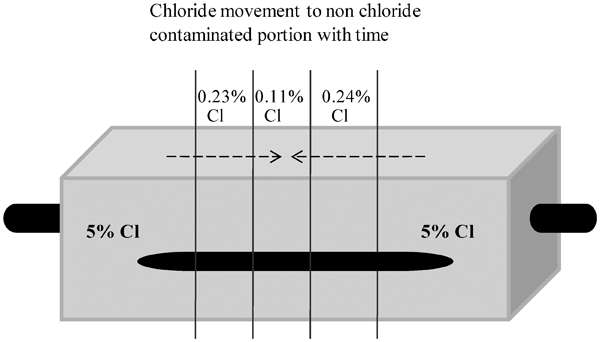
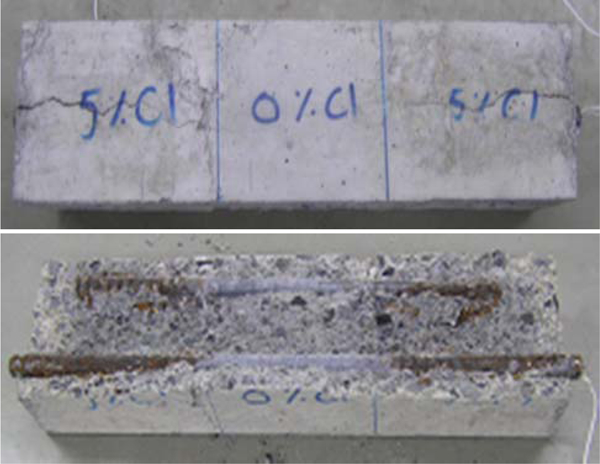
first, from the visual observation of the steel bar taken from the middle portion of specimen 1 having no chloride content as shown in Fig. 12, it is quite clear that it remained uncorroded. For more thorough investigations, the salt content of this specimen having 5% chloride contents at the end was measured to investigate the movement of the chloride from the contaminated portion to the uncontaminated middle portion of this specimen. It is also interesting to note that the salt content of the broken specimen containing 5% total chloride at the ends was found to be 0·15, 0·08 and 0·14% total chloride content at three different intervals as shown in Fig. 13. The average of these intervals is 0·123%. While in the same OC specimen, the salt content was found to be 0·23, 0·11 and 0·24% total chloride content at these intervals as shown in Fig. 14. The average of this OC salt content is 0·213%, which is not significant to cause corrosion in ordinary reinforced concrete.21,22 From the experimental results of corrosion current and potential values as shown in Figs. 6 and 7, recorrosion of the repaired reinforced SCRC patch, although containing no chloride content, can be assumed
second, the average salt content of SCRC specimens having 3% total chloride contamination at the end was found to be 0·09, 0·04 and 0·07% total chloride content at three different intervals as shown in Fig. 15, while the average salt content of OC specimens having 3% total chloride contamination at the end specimens was found to be 0·13, 0·07 and 0·14% total chloride content at three different intervals as shown in Fig. 16.
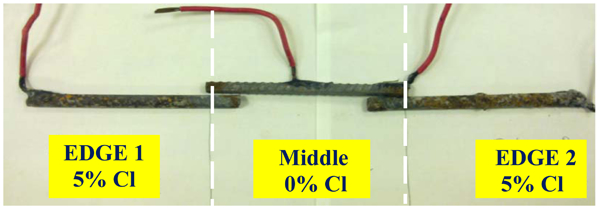
Visual observation of end and middle portion's steel bars of 5% contaminated specimen
Chloride transfer from 5%Cl SCRC contaminated portion to 0%Cl portion
Chloride transfer from 5%Cl OC contaminated portion to 0%Cl portion
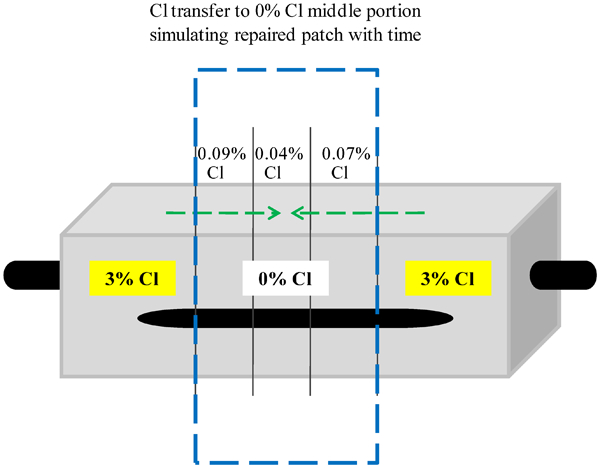
Chloride transfer from 3%Cl SCRC contaminated portion to 0%Cl portion

Chloride transfer from 3%Cl OC contaminated portion to 0%Cl portions
Crack appearance and propagation
In 5% chloride SCRC specimen, there was no appearance of crack after 1 year of observations, while in the same OC specimen, there was the appearance of the cracks at the two ends of the 5% chloride content specimen, which propagated towards the centre no chloride contaminated (control) portion as shown in Fig. 17.10 This OC specimen showed much higher corrosion current (due to macrocell formation) than normally corroded (due to microcell formation) reinforced concrete for a chloride concentration of 5%.23 This result indicates that in SCRC specimen, the developed macro is not severe as compared to OC specimen, but the phenomenon of a macrocell formation is still there, which needs to be further investigated with SEM and X-ray diffraction analysis as a scope of future research.
Cut section and crack appearance of 5%Cl contaminated OC specimen at end
Conclusions
This research study compares the macrocell phenomena in ordinary and SCRC repaired structures. Self-compacting concrete is considered by some researchers as good repair material for corroded OC structures because of its dense, less permeable microstructure, strong resistance to bleeding, and segregation and presence of water reducers/SPs. Through this research, the actual behaviour of recorrosion in and around patches of already repaired corroded reinforced SCRC due to chloride attack is successfully investigated, which has received limited attention in the past. From the experiment results of corrosion observations, it was found that the highest chloride induced anodic corrosion current of 4·99 μA cm−2 and potential of −0·598 V at the two extreme ends of 5%Cl SCRC specimen caused macrocell cathodic corrosion current of 2·046 μA cm−2 and potential of −0·505 V in the middle no chloride portion. However, these corrosion current and corrosion potentials after reaching their peak value started to decline and dropped to 1·98 μA cm−2 and −0·396 V respectively at the ends, while at the middle uncontaminated portion, they dropped to 0·86 μA cm−2 and 0·286 V. The reason for the decrease in measured corrosion current and potential with time was found to be dependent on the saturated area of concrete acting as electrolyte for the corrosion process, which becomes gradually smaller with the passage of time and age of concrete. The electrolyte present in gel and capillary pore zones reduces with successive reduction in porosity and saturation over a certain time interval and finite control volume. Similar sort of behaviour was also observed in 3% chloride contaminated specimens. Although a decline in the corrosion rates with time in these SCRC specimens was observed, it was still significant enough to be noticed for high corrosion as compared to the corrosion in normal conditions. These time dependent corrosion rate results can be used as a tool to control corrosion in repaired SCRC patches and to devise new techniques as a scope of future research to tackle this macrocell phenomenon.
These experimental results show that even those patches of the reinforced SCRC, which are repaired and considered as safe against corrosion in the construction field, can get more corrosion in the form of macrocell in the surrounding chloride contaminated areas of reinforced SCRC. This research triggers about an alarming condition that can prevail in SCRC structures, resulting in severe degradation of structural elements surrounding the corrosion repaired patches. Therefore, the authors believe that this research is novel and will bring substantial impetus in the field of repair and maintenance of corroded reinforced SCRC structures. The significant consequence of this research will be the emergence of new research studies on materials and repair techniques especially relating to SCRC as a scope of future research.
Footnotes
Acknowledgements
This project was supported by King Saud University, Deanship of Scientific Research, College of Engineering Research Center.