
Abstract
Pb–0·5-0·7Ag anodes are widely used in the industry of zinc electrowinning. Two commercial lead anodes containing 0·56 and 0·69%Ag were studied by electrochemical impedance spectroscopy to evaluate their electrochemical activity. An industrial acid zinc sulphate electrolyte containing glue and chloride ion, but without manganese addition, was considered. In this study, 5 h of electrolysis at a density of 50 mA cm−2 (currently used in practice) and also 6 h of potential decay were made to represent electrowinning periods of maintenance both at 38°C. During the 5 h polarisation, the average double layer capacity of Pb–0·56Ag alloy was higher (∼9%) than that of Pb–0·69Ag alloy. During the first hour of potential decay, the Warburg impedance controls the electrochemical reaction. For the period from the second to sixth hour, the double layer capacity decreased with immersion time, and the charge transfer resistance increased with time. During the potential decay, the average charge transfer resistance of Pb–0·69Ag anode was higher (∼52%) than that of Pb–0·56Ag anode.
Keywords
Introduction
The zinc electrowinning industry requires high quality anodes to produce high purity metal. 1 A high quality anode means that the anode has high corrosion resistance to minimise the dissolution of corrosion products into the electrolyte and to achieve the required purity of zinc deposits when the anodes are polarised during electrolysis. In addition, in zinc industries, there are periods of maintenance when current is cutoff (e.g. 2 h once a week and 12-16 h every 3 months), which influence the stability of the anodes. As reported by Ivanov et al., adding elements in the lead alloy can improve the mechanical properties and corrosion resistance. 2 Small amounts of Ag (0·7-1·0%) alloyed with lead decrease the oxygen overvoltage and increase the corrosion resistance of the material. A well established custom in all electrolytic zinc plants is to use Pb–Ag alloys containing 0·7-1·0%Ag as the anode material. The resulting benefits are a longer anode life and a lower Pb content in the cathodic zinc. 3 Moreover, Ag reduces the oxidation of PbSO4 to PbO2, leading to less PbO2 content, and decreases the O2 overvoltage, which takes place in the gel zone.4–6
It is widely known that the lead anodes used in electrowinning can corrode when the current is switched on after an interruption. This phenomenon can be explained in terms of the loss of the anode passivity that takes place in the absence of applied current. 7 The process of lead anode corrosion (in zinc electrowinning electrolyte) at open circuit (during current interruption for maintenance) following anodic polarisation is analogous to the self-discharge of lead acid batteries following the charging state. 8
The behaviour of three Pb–Ag alloy anodes (with 0·5, 0·6 and 0·7%Ag) was evaluated during electrowinning by galvanostatic, potentiodynamic and electrochemical noise measurements using an electrolyte containing manganese, as that frequently employed in industrial electrolytes in our laboratory. It was observed that the Pb–0·5Ag anode had the highest anodic overpotential, followed by those of anodes containing 0·6 and 0·7%Ag. Comparatively, the Pb–0·5Ag anode had more corrosion products during polarisation (or electrolysis), with an important potential plateau during the decay period at the average value of 1·61 V[standard hydrogen electrode (SHE)] for the longest time (45 min). At the beginning of the potential decay, Pb–0·7Ag anode showed the formation of more active galvanic cells that could correspond to more localised corrosion due to the presence of a greater quantity of phases containing Ag after 24 h of electrolysis. During the potential decay, a higher Ag content in the anode then promoted the best corrosion resistance. However, at the far end of the potential decay (11-16 h of potential decay), it was observed that a greater silver content in the anode slightly increased the corrosion rates. 9 Using the electrochemical noise technique, it was possible to show that the absolute value related to the power spectral density slopes of the three Pb–Ag anodes can correspond to different corrosion reactions and/or corrosion types.
Indeed, the Pb–0·5Ag anode shows uniform corrosion at the beginning (first hour) and localised corrosion at the end of the 16 h potential decay, while Pb–0·7Ag anode shows high localised corrosion at the beginning, followed possibly by uniform corrosion and then finally back to localised corrosion. 9 Zhang et al. found that there are four levels corresponding to different electrochemical reactions during the 16 h of potential decay and corrosion after polarisation. The self-discharge of the anode takes place during open circuit potential. Three potential plateaus are observed in the potential transient curves between 1600 and 200 mV(SHE), corresponding to allotropic transformations for the reduction in PbO2 to PbSO4.10,11 At the end of the discharge period, PbSO4 will block further discharge of PbO, and the remaining PbO2 will be electrochemically inactive, i.e. PbSO4[PbO2] is formed, and the potential will fall to more active values. Second, the remaining PbO2 will be reduced to Pb3O4 or PbOOH, and PbO(OH)2 can be reduced to PbSO4.12,13
The industrial conditions and surface state of the Pb–Ag have been simulated in a previous study during 24 h polarisation and 16 h potential decay. 9 The decay can be divided into four levels with different electrochemical reactions on the Pb–Ag anodes. In this study, it can be obtained that 6 h of decay after 5 h of electrolysis led to similar results, and these conditions simulated well the industrial properties of the anode surface during electrolysis. It has been concluded that 5 h electrolysis could simulate well the industrial conditions to examine the electrochemical performance of different Pb–Ag anodes in industrial electrolytes with different manganese contents and at different temperatures and current densities. 14 The decay periods correspond generally to periods of break time (maintenance) of 2 h once a week and 12-16 h every 3 months. It has been also found that 6 h decay gives almost the same results (potentials and four levels of decay) as that of 5 days for two different Pb–Ag anodes.
Electrochemical impedance spectroscopy is a powerful tool to study the corrosion kinetics and corrosion mechanism of the Pb–Ag anode. It is one of the best methods to study the electrochemical double layer properties, and it also provides an in situ characterisation of the PbO2/electrolyte interphase. 15 In addition, electrochemical impedance spectroscopy provides a very useful non-destructive technique for in situ characterisation or modification of the corrosion product films grown on Pb–Ag alloys in electrolytic solutions during decay periods. 16 This approach is directed to examine the performance of two studied anodes (Pb–0·56Ag and Pb–0·69Ag alloys) during the 6 h decay. In this study, manganese addition in the electrolyte was avoided to better examine the influence of lead oxides on the kinetics of oxygen evolution. The aim of this work is to evaluate the charge transfer resistance and the double layer capacitance of the Pb–Ag alloys during the 5 h polarisation, as well as to study the reduction in oxide film close to the surface of Pb–Ag anodes during 6 h potential decay after polarisation.
Experimental
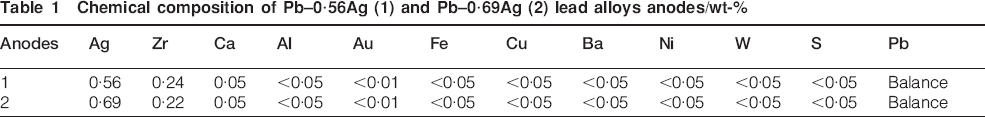
The 800 mL electrolyte contains 60 g dm−3 of Zn2+(ZnSO4.7H2O), 180 g dm−3 of H2SO4, 250 mg dm−3 of Cl− from NaCl and 3 mg dm−3 of glue [gelatin (G)]; here, glue is an animal protein that consists of a complicated mixture of polypeptides and used as levelling agent 17 heated by a flow of thermostated water in the double wall (38±0·5°C). The electrolyte was magnetically stirred at 412 rev min−1 during the experiments by a stirrer (4 cm long and 1 cm diameter). The Pb–Ag alloy anode plates were cut into small pieces of 1×1×1 cm and then connected with a plastic isolated copper wire and cast in acrylic resin, leaving 1 cm2 of exposed area surface. The anodes used in this work were made of rolled Pb–0·56Ag alloy and Pb–0·69Ag alloy; their chemical compositions are given in Table 1.
Chemical composition of Pb–0·56Ag (1) and Pb–0·69Ag (2) lead alloys anodes/wt-%
The polished anode surfaces were ground with 600 soft grid SiC paper washed with ethanol to avoid the inclusion of SiC particles into the electrodes. The polished surface of the working anode was washed with alcohol and dried immediately before being introduced into the electrolytic cell.
The working electrode and the Pt counter electrode were mounted in suitable Teflon made holder. Their distance was fixed at 2 cm. The reference electrode was Hg/Hg2SO4/K2SO4(sat), and a saturated K2SO4 salt bridge was used. All the potentials mentioned in this paper are converted to SHE.
The electrochemical impedance measurements were carried out using a Solartron 1255 HF frequency response analyser and a Solartron 1286 electrochemical interface over the frequency range from 10 kHz to 0·5 Hz. The amplitude of the sinusoidal signals was 10 mV. The software Zplot was used for plotting the impedance experiments and acquisition of the impedance data. The Nyquist plots of the impedance data were analysed using Zview software mainly to calculate the charge transfer resistance, the electrolytic resistance and the electrical double layer capacity during the corrosion process.
The electrochemical impedance measurements were carried out during galvanostatic mode for 5 h. A constant current (50 mA cm−2) at 38°C was imposed on the anodes during impedance measurements. The impedance of the alternative signal was measured as a function of frequency.
The electrochemical impedance measurements were conducted at open circuit potential at an 8 min interval for the first hour immediately when the decay starts. During 2-6 h of potential decay, the measurement of electrochemical impedance at open circuit potential was conducted five times during 2 min at the end of every hour. This was carried out six times for six consecutive hours.
The reproducibility of the charge transfer resistance was in the order of 3-5%, and the reproducibility of the double layer capacitance values was in the order of 4-6% by electrochemical impedance measurements. Duplicate experiments were generally performed, and triplicates were considered when necessary.
Results and discussion
Electrochemical behaviour of Pb–Ag alloy anodes during polarisation
During the 5 h polarisation at 50 mA cm−2 and 38°C, the curve of overpotential with time was recorded; the results are shown in Fig. 1. The oxygen overpotentials of anodes were determined by subtracting the ohmic drops (obtained by ac impedance technique) and the calculated reversible potentials [1·264 V(SHE)] from the measured electrode potential values for each anode. 14 It was observed that the overpotential increased with time for the period 1-5 h (Fig. 1).
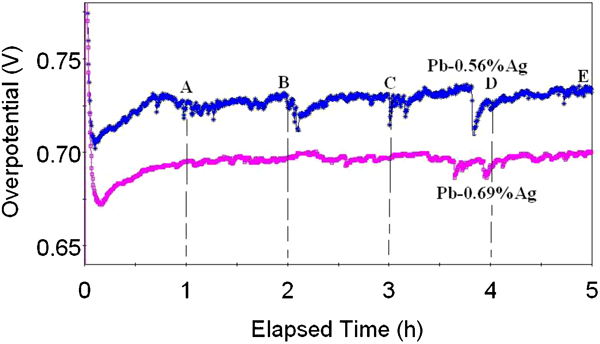
Overpotential for oxygen evolution reaction on Pb–0·56Ag and Pb–0·69Ag anodes at current density of 50 mA cm−2 and 38°C in zinc electrolyte
After ∼5 min of immersion, low potentials for both anodes were recorded, that of the 0·69%Ag–Pb anode was more active (∼40 mV more negative) than the 0·56%Ag–Pb anode. The overpotential of the Pb–0·56Ag alloy anode stayed higher than that of the Pb–0·69Ag alloy anode during 5 h polarisation in the zinc electrolyte at a current density of 50 mA cm−2 and 38°C. This suggests that less Ag content in the lead alloy anode leads to more PbO2, higher overpotential and higher corrosion rate during the polarisation. 18 As reported by Ivanov et al., lead dioxide possesses a high overpotential towards oxygen evolution thus, causing a significant increase in energy use during polarisation. 2
Figure 2 shows the Nyquist plot of the electrochemical impedance for oxygen evolution reaction on Pb–Ag alloy anodes (rate determining step of the kinetic process at the given potential) during the polarisation. It can be seen from Fig. 2 that the Nyquist plot for Pb–Ag alloy anodes has a small semicircle; this semicircle should correspond to the electrochemical reactions of the oxygen evolution
19


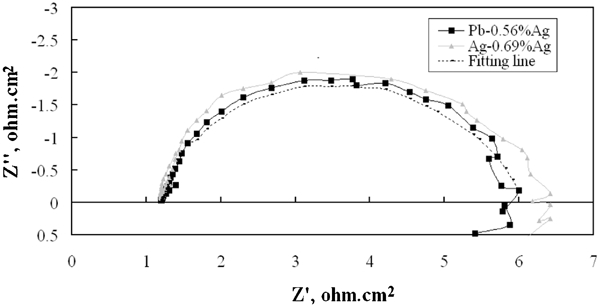
Nyquist plots of electrochemical impedance on lead–silver alloy anodes (Pb–0·56Ag and Pb–0·69Ag) in zinc electrolyte at 38° and 50 mA cm−2 for 1 h polarisation such as third hour
According to the oxygen evolution mechanism, steps (1) and (2) are the electrochemical reactions, and step (3) is chemical reaction. When the potential is relatively low, oxygen evolution reaction is an electrochemically controlled reaction. 19
During the 5 h polarisation, PbO2 is formed on the surface of the Pb–Ag alloy anode, which is a semiconductor oxide film at the same time. The inductance in the Nyquist plots is probably related to the adsorbed oxygen. An equivalent circuit shown in Fig. 3 is suggested to simulate the electrochemical process of the oxygen evolution reaction (not considering the inductance). The calculated results, shown in Table 2, can represent the original impedance plot since the fitting line is simulating well the obtained results for Pb–0·56Ag alloy anode. R S corresponds to the electrolyte resistance between the electrode surface and the salt bridge tip. R ct corresponds to the charge transfer resistance of electron transfer of the metal surface during corrosion reaction of the lead conductor+PbO2 (the PbO2 is also a conductor). C dl is the double layer capacitance C dl for the dominating oxygen evolution reaction.
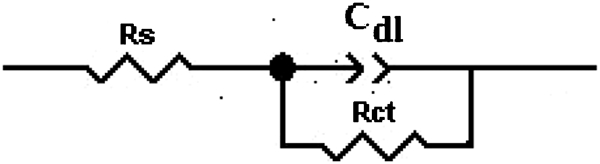
Equivalent circuit proposed for fitting experimental data of electrochemical impedance measurements of oxygen evolution reaction on lead–silver alloy anodes
Comparison of parameters of equivalent circuit of oxygen evolution reaction on Pb–0·56Ag alloy and Pb–0·69Ag alloy anodes measured by electrochemical impedance
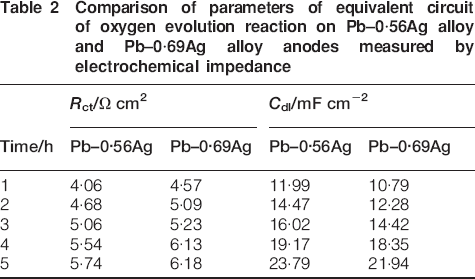
It can be observed from Table 2 that the average charge transfer resistance R ct of Pb–0·69Ag alloy anode is almost 8% higher than that of Pb–0·56Ag alloy anode during 5 h electrolysis. During polarisation, PbO2 on the surface of the Pb–Ag anode exists in two modifications: rhombic α and tetragonal β. As reported by Nguyen and Atrens, Ag favours the occurrence of β-PbO2 in the oxide film; it means that higher silver leads to more β-PbO2 in the oxide film, while less silver leads to more α-PbO2. At normal conditions, β-PbO2 is more resistant than α-PbO2, so the higher Ag content causes the better PbO2 film during the 5 h polarisation, also better conductor and less corrosion rate of Pb–Ag alloy anode. It is admitted that β-PbO2 is a better microstructure for oxygen evolution. 20
Moreover, it can be observed from Table 2 that the charge transfer resistance and the apparent double layer capacitance increase with polarisation time. It is admitted that the more Ag in Pb–Ag anode leads to less PbO2, less corrosion rate and higher values of R ct. The small value of R ct under high overpotentials confirms that the oxygen evolution reaction is not electrochemically controlled. The large value of the apparent double layer capacity (in mF cm−2 level) is mainly contributed to the oxygen adsorption described in step (3). It can also be observed that the average double layer capacity of Pb–0·56Ag alloy is 9% higher than that of Pb–0·69Ag alloy during 5 h electrolysis, since a higher overpotential can suggest more electrons adsorbed on the surface of the Pb metal.
It should be noted that in Fig. 2, the Nyquist plot has an inductance at low frequencies. This inductance may be related to the removal of adsorbed oxygen on the anode surface by step (3) and the change of oxide film of the Pb surface. Two phenomena may be considered: one is that the oxygen is a strong oxidant, it can diffuse across the oxide layer and attack the metal substrate to form more oxide, this accelerates the corrosion rate of the anode; the second is that this inductance apparently corresponds possibly to oxide dissolution. 19
Corrosion behaviour of Pb–Ag alloy anodes during decay
After 5 h of galvanostatic polarisation, the potential decay was recorded; a schematic presentation of the 6 h potential decay of the Pb–Ag alloys anodes is shown in Fig. 4. It can be seen that Pb–0·56Ag anode has a much longer plateau than Pb–0·69Ag anode ∼1600 mV corresponding to the theoretical potential value of the PbO2/Pb2+ equilibrium. This shows a spontaneous transformation of lead dioxide into lead sulphate because thermodynamically lead dioxide is unstable on the surface of lead in the sulphuric acid solution. 20 According to Zhang et al., a longer plateau for Pb–0·56Ag anode means a higher dissolution rate during the decay due to the presence of more important corrosion products during electrolysis. 9
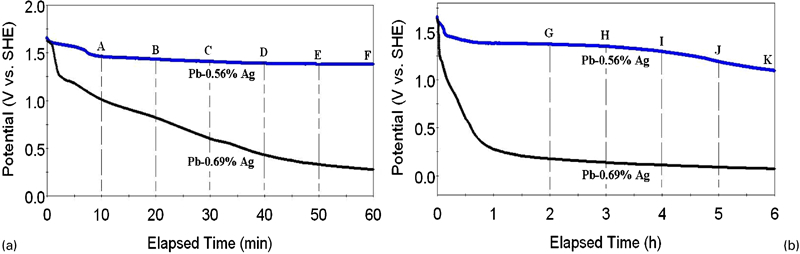
Potential decay of Pb–0·56Ag and Pb–0·69Ag anodes following 5 h of galvanostatic polarisation at 50 mA cm−2 in acid zinc sulphate electrolyte
Moreover, it is observed from Fig. 4 that the potential dropped very quickly in the first few minutes, and then the rate of potential decay was slower than before. As reported by Zhang et al., the potential decay can be divided to four levels, and the range of every level can be as follows: level 1, 1·72-1·66 V(SHE); level 2, 1·66-1·55 V(SHE); level 3, 1·55-0·9 V(SHE); and level 4, 0·9-0·3 V(SHE).
9
For Pb–0·56Ag anode, the potential decay during the first 8 min belongs to the first and second levels, while for Pb–0·69Ag anode, only the first 1 min belongs to the first and second levels; the potential of Pb–0·69Ag anode dropped much quicker than that of Pb–0·56Ag anode, and the dominating reactions are the following:
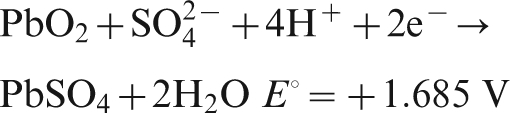
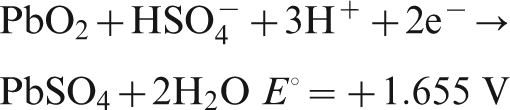
For Pb–0·56%Ag anode, the potential decay during the period from 10 to 60 min and then up to 6 h belongs to the third level; the electrochemical reactions are as follows10,21


For Pb–0·69Ag anode, from the starting 20 min, the potential decay dropped down to the fourth level, and the suggested electrochemical reactions are the following15,21


During the first hour of potential decay, for Pb–0·56Ag anode and Pb–0·69Ag anode, six points (A–F) were considered to do the impedance measurements, since the decay rate of potential at the first hour is very quick. It is very possible that certain electrochemical reactions were carried out at these points. 15 Then, five points (G–K) were carried out by impedance measurements during the following 5 h (from 2 to 6 h).
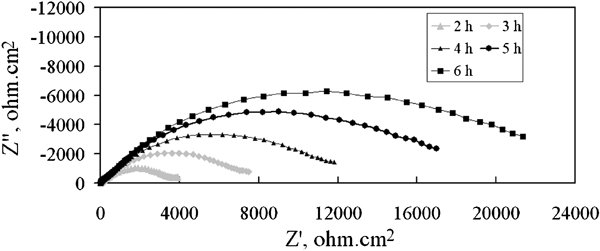
Figure 5 illustrates the Nyquist plots for the corrosion impedance of Pb–0·56Ag alloy specimen as a function of immersion time for the first hour. It can be observed that the size of the capacitive semicircle of the Nyquist plots increases with time. Since the diameter of the capacitive semicircle is directly proportional to the charge transfer resistance R ct for the electrochemical corrosion process, the growing of the semicircle means that the corrosion resistance increased and the corrosion current decreased with time. In addition, it was found that the Warburg impedance (diffusion control) existed at low frequencies since the mass transport of the electroactive species can limit the electron transfer process.
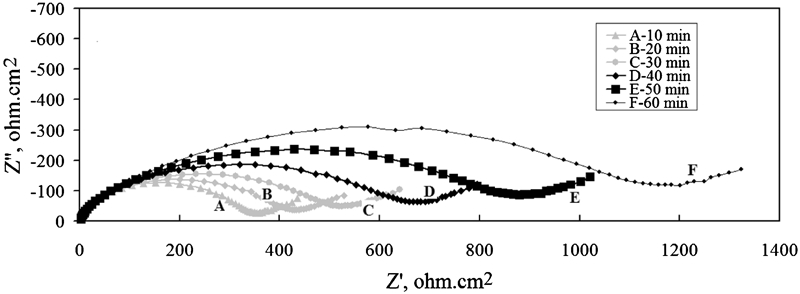
Nyquist plots of corrosion impedance of Pb–0·56Ag alloy specimen as function of immersion time in zinc electrolyte at 38°C after 5 h polarisation: potentials versus SHE are at elapsed times A, 1461 mV; B, 1432 mV; C, 1408 mV; D, 1391 mV; E, 1383 mV; and F, 1379 mV
As reported by Deutscher et al., the PbO2 was reduced to PbSO4 during the potential decay, while the molar volume of β-PbO2 (25 cm3 mol−1) is much less than the molar volume of PbSO4 (48 cm3 mol−1) and PbO(OH), so gaps are created in the outer PbSO4 layer, and bare metal is exposed to the acidic solution, and the diffusion of Pb2+ passed through the gaps of the PbSO4 and PbO2 layers. 22
For Pb–0·69Ag anode, Fig. 6 illustrates the Nyquist plots for the corrosion impedance of the Pb–0·69Ag alloy specimen as a function of immersion time for the same period. It can also be observed that the size of the capacitive semicircle of the Nyquist plots increases with time; this means that the charge transfer resistance R ct increases with time. Figure 6 shows that the electrochemical reactions consist of charge transfer reaction and diffusion reaction. Therefore, the equivalent circuit of Pb–0·69Ag anode is similar to that of Pb–0·56Ag anode during the first hour decay after 5 h polarisation.
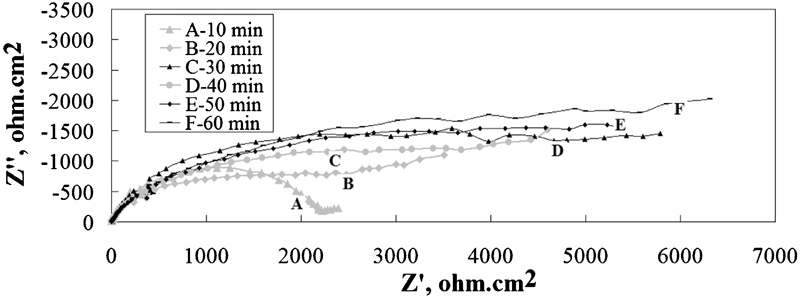
Nyquist plots of corrosion impedance of Pb–0·69Ag alloy specimen as function of immersion time in zinc electrolyte at 38°C after 5 h polarisation: potentials versus SHE are at elapsed times A, 1011 mV; B, 823 mV; C, 600 mV; D, 432 mV; E, 331 mV; and F, 276 mV
An equivalent circuit shown in Fig. 7 was used to calculate the charge transfer resistance, Warburg impedance and other parameters from Figs. 5 and 6.
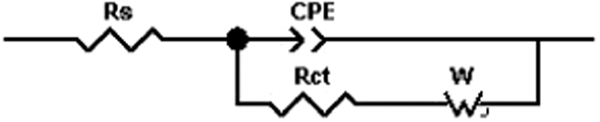
Equivalent circuit of corrosion cell (R s: electrolyte resistance; R ct: charge transfer resistance; CPE: constant phase element related to double layer capacity; W o: Warburg impedance)
The values of the charge transfer resistance and Warburg impedance of Pb–0·56Ag (Figs. 5 and 7) and Pb–0·69Ag (Figs. 6 and 7) are shown in Table 3. The values of RS were not considered since it is the resistance of the electrolyte that was constant in these conditions. It was observed that the double layer capacity decreased with immersion time, while the charge transfer resistance and Warburg impedance increased with immersion time, meaning that the rate of diffusion of the ions was decreased. This can correspond to a decrease in the attached ions that are very close to the metal surface.
R ct, C dl and Warburg impedance values of Pb–0·56Ag and Pb–0·69Ag alloy specimens as function of immersion time in zinc electrolyte at 38°C after 5 h polarisation for different times
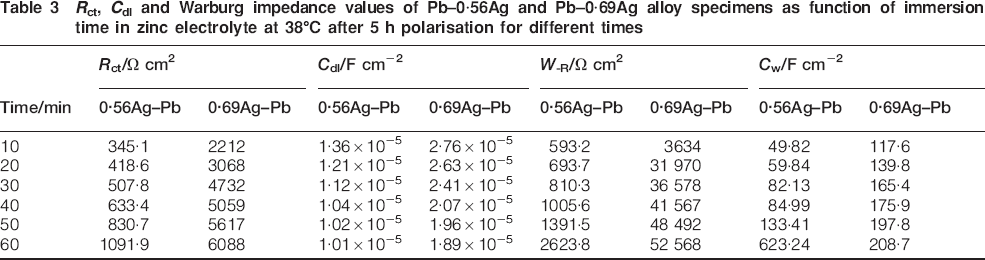
From Table 3, it was observed also that the average charge transfer resistance of Pb–0·69Ag anode is much higher (almost seven times) than that of Pb–0·56Ag anode. The average Warburg impedance of Pb–0·69Ag anode is also much higher (almost 40 times) than that of Pb–0·56Ag anode. It should be added that the potential of Pb–0·56Ag stayed at ∼1400 mV (third region), much more positive (over 1000 mV) than Pb–0·69Ag (fourth region). It can be deduced then that more silver content in lead anode leads to less PbO2 layer and short plateau during decay with sharp potential drops. This caused the spalling of the oxide on the surface of Pb–0·69Ag anode, and the decay potential after 10 min only belongs to that of the third level directly. There are some semiconductive products, such as PbO.PbSO4, PbO(OH), etc. All the other decay potentials at the time period of 20-60 min belong to that of the fourth level; a possibly thick non-conductive film of PbSO4 covers the surface of Pb–0·69Ag anode. The diffusion of ions occurs through a few small holes in this film and is much more difficult, giving Warburg impedance values of Pb–0·69Ag anode much higher than that of Pb–0·56Ag anode. Moreover, Pb–0·56Ag has more considerable amount of PbO2 during polarisation than Pb–0·69Ag anode. During the decay, more PbO2 results in more reduction reaction to PbSO4. It means that there is higher oxide dissolution rate and less polarisation resistance for Pb–0·56Ag anode than Pb–0·69Ag anode. This explains the higher charge transfer resistance of Pb–0·69Ag than that of Pb–0·56Ag anode during potential decay.
Figure 8 gives the evolution of the charge transfer resistance and the Warburg impedance of Pb–0·56Ag alloy and Pb–0·69Ag alloy anodes with time. It is clear that the charge transfer resistance changed synchronously with the variation of Warburg impedance. The increase in charge transfer resistance signifies a decrease in corrosion current, while the increase in Warburg impedance W–I can be due to a decrease in the pores of the surface film, leading mainly to a control of the diffusion of Pb2+ ions. In addition, from Fig. 8a, it can be observed that W–I is larger than R ct, indicating a diffusion control. This may be due to depletion concentration or accumulation of product. As reported by Zhang et al., less Ag content in the Pb–Ag alloy anodes resulted in more PbO2 on the surface of Pb–Ag alloy anode during its polarisation, and during the decay of Pb–Ag alloy anodes after polarisation, more PbO2 resulted in slower rate of the potential decay of the Pb–Ag alloy anode. 9 It can be admitted then that the process of PbO2 reduction to PbSO4 lasted >1 h since only 0·56%Ag is contained in the Pb–0·56Ag alloy anode.
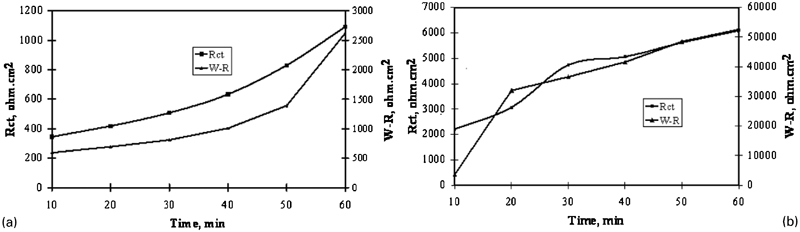
Evolution of charge transfer resistance R ct and Warburg resistance W–R of a Pb–0·56Ag alloy and b Pb–0·69Ag alloy specimens as function of immersion time in zinc electrolyte at 38°C after 5 h polarisation
Figure 9 illustrates the Nyquist plots of the corrosion impedance of Pb–0·56Ag alloy specimen during the 5 h decay immersion time after the 1 h decay (from 2 to 6 h).
Nyquist plots of corrosion impedance of Pb–0·56Ag alloy specimen as function of 6 h potential decay immersion time in zinc electrolyte at 38°C after 5 h polarisation: potentials versus SHE are at elapsed times G, 1369 mV; H, 1346 mV; I, 1291 mV; J, 1188 mV; and K, 1096 mV
Figure 10 illustrates the Nyquist plots of the corrosion impedance of Pb–0·69Ag alloy specimen during the 5 h decay immersion time after the first hour decay (from 2 to 6 h).
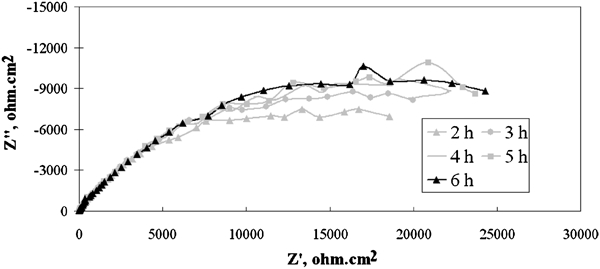
Nyquist plots of corrosion impedance of Pb–0·69Ag alloy specimen as function of 6 h potential decay immersion time in zinc electrolyte at 38°C after 5 h polarisation: potentials versus SHE are at elapsed times G, 178 mV; H, 139 mV; I, 113 mV; J, 91 mV and K, 73 mV
An equivalent circuit fitted for Figs. 9 and 10, shown in Fig. 11, was used to calculate the charge transfer resistance, surface film resistance and other parameters.
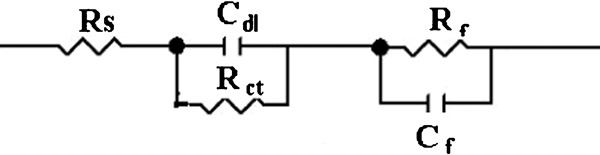
Equivalent circuit of corrosion cell (R s: electrolyte resistance; R ct: charge transfer resistance; R f: surface film resistance; C dl: double layer capacity; C f: film capacity)
The values of the charge transfer and surface film resistances of Pb–0·56Ag and Pb–0·69Ag anodes during decay are given in Table 4. The film capacity decreased with the immersed time; it is due to the PbO2 reduction to PbSO4. Moreover, the double layer capacity decreased with the decay time since the low potential resulted in less Pb2+ ions attached to the surface of the double layer.
R ct, R f, C dl and C f values of Pb–0·56Ag and Pb–0·69Ag alloy specimens as function of immersion time in zinc electrolyte at 38°C after 5 h polarisation for different times
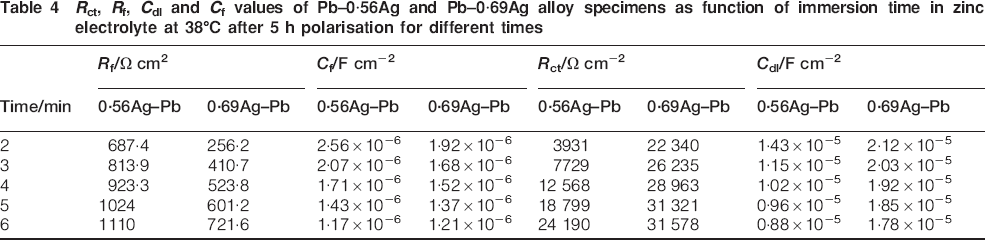
Figure 12 gives the evolution of the charge transfer resistance and the film resistance of Pb–0·56Ag alloy and Pb–0·69Ag alloy anodes with decay time. It can be observed from Fig. 12 that the surface film resistance increases with immersion time. This increase in R f could be caused by the increase in thickness of PbSO4 film; it means that there is more PbSO4 with time. It is clear that the charge transfer resistance changed synchronously with the variation of surface film resistance. It was also found that the charge transfer resistance increased due very probably to less Pb2+ corroded from the Pb alloy anode, and these Pb2+ ions were difficult to pass through the thick, passive and low conductive PbSO4 layer. 14
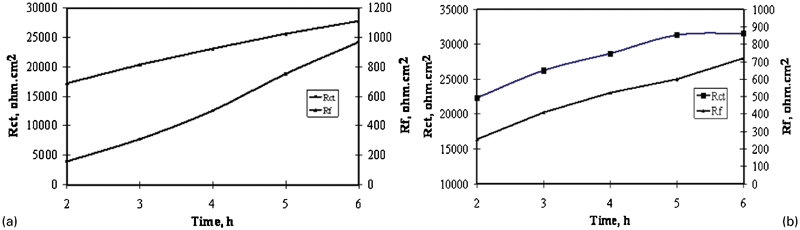
Evolution of charge transfer resistance R ct and film resistance R f of a Pb–0·56Ag alloy and b Pb–0·69Ag alloy specimens as function of immersion time (2-6 h) in zinc electrolyte at 38°C after 5 h polarisation
Comparing Fig. 12a and b, it can be observed that the average charge transfer resistance R ct of Pb–0·69Ag alloy anode is much 52% higher than that of Pb–0·56Ag alloy anode. It is then very possible that the corrosion rate of Pb–0·69Ag alloy anode is much lower than that of Pb–0·56Ag alloy anode, while the average film resistance R f of Pb–0·69Ag alloy anode is lower by 45% than that of Pb–0·56Ag alloy anode. As also reported by Monahov et al., Ag from the metal surface is oxidised, and Ag ions are incorporated into the PbO2 layer and lead to less PbO2. 23
Conclusions
Impedance measurements are powerful tools to characterise the corrosion behaviour for Pb–Ag alloy anodes in the zinc electrolyte during electrolysis and decay periods after polarisation. The following conclusions can be deduced from this study obtained on two commercial anodes in zinc electrowinning.
During the 5 h polarisation:
The surface layer resistance, the charge transfer resistance and the double layer capacitance increase with polarisation time.
The average charge transfer resistance of the Pb–0·69Ag alloy anode is 8% higher than that of the Pb–0·56Ag alloy anode.
During the first hour potential decay after 5 h polarisation:
The Warburg impedance controls the electrochemical reaction. The resistance of the electrochemical reaction of Pb–Ag consists of Warburg impedance and the charge transfer resistance, the Warburg impedance resistance and the charge transfer resistance increased with the immersed time.
The average charge transfer resistance of Pb–0·69Ag alloy anode is 86% higher than that of Pb–0·56Ag alloy anode.
The potential decay during the period from the second to sixth hour:
For the Pb–0·56Ag and Pb–0·69Ag anodes, the resistances of the electrochemical reaction consist of film resistance and the charge transfer resistance, the film resistance and the charge transfer resistance increased, whereas the double layer capacity and the film capacity decreased with the immersion time.
The average charge transfer resistance of Pb–0·69Ag alloy anode is 52% higher than that of Pb–0·56Ag alloy anode, while the average film resistance of Pb–0·69Ag alloy anode is 45% lower than that of Pb–0·56Ag alloy anode.
Electrochemical impedance is a powerful tool to characterise the corrosion behaviour of Pb–Ag alloy anodes during potential decay after 5 h polarisation. It is a very important and promising practice to measure the impedance resistance for each group of Pb–Ag alloy anode and to determine the corrosion current to better understand the process of potential decay of Pb–Ag alloy anodes used for electrowinning.
Higher silver content in the Pb–Ag anode leads to less PbO2 during polarisation and causes less localised oxidation of the lead anode during decay.
It can then be assumed that Pb–0·69Ag has better corrosion behaviour and lower overpotential during electrolysis, which can lead to better performance and longer periods of service than Pb–0·56Ag anode.
Footnotes
Acknowledgements
The authors would like to thank Drs G. Gu and J. Li (CANMET Materials Technology Laboratory, Natural Resources Canada) for their interest and participation in reviewing this work.