






Abstract
Voltammetric techniques (open circuit potential, linear polarisation resistance and cyclic voltammetry) have been applied to study the corrosion of carbon steel in water. The study has been performed in aqueous solutions for pH ranging between 7 and 12 in the presence of chlorides, sulphates, carbonates, nitrites and nitrates. Principal component analysis (PCA) was performed with the cyclic voltammetric data. Values of corrosion potential and corrosion current obtained with traditional methods are compared to the conclusions arisen by the PCA. These results show the ability of PCA for the evaluation and diagnosis of corrosion processes and not only that, it leads to the possibility of using steel working electrodes as ion sensors.
Introduction
Metallic materials and alloys are widely used as building materials, either as isolated elements or as a part of composite materials like in the case of reinforced concrete. The most important mechanism on that affects the durability of these elements is corrosion. At an early age it is unlikely that metals corrode due to the use of insulating coverings or passivating agents, metal coatings as independent metal compounds or surface processing.
The diagnosis of corrosion problems has been widely studied. Traditional methods used for corrosion testing and monitoring include weight-loss coupon tests,1,2 detection of galvanic currents3,4 or electrochemical measurements.5–7 Electrochemical potential measurements have been employed to determine the corrosion risk; cyclic polarisation method is used to determine localised corrosion susceptibility; linear polarisation resistance and electrochemical impedance spectroscopy are used to measure instantaneous rates of uniform corrosion.2,8
Two measurement systems have been used: dynamic, to simulate the hydrodynamic processes taking place on pipes or structures affected by sea water; and static, to simulate elements where there is no movement of the surrounding water.
Among metals and their alloys, the most commonly used material is steel. For this reason, corrosion kinetics processes of steel have been studied in different solutions considered neutral (nitrates), inhibitory (nitrites) 9 and aggressive (chlorides and sulphates). 10 Principal component analysis (PCA) using the obtained data from the sensors has been applied to the study of steel corrosion. As well, traditional electrochemical techniques (open circuit potential monitoring, linear polarisation resistance and cyclic voltammetry) have been used to study steel corrosion. The obtained results show the good performance of PCA, by using cyclic voltammetry data, in the prediction and diagnosis of the corrosion processes observed in different aqueous solutions. The conclusions emerged from this analysis are compared to the values obtained with traditional techniques.
Chemometrics is defined by International Union of Pure and Applied Chemistry as ‘the science of relating measurements made on a chemical system or process to the state of the system via application of mathematical or statistical methods’.11,12 While in physics, chemistry and even in social sciences multivariate analysis techniques have been widely used; in corrosion its use is not extensive and only a few examples can be found in the literature. For instance, Hajeeh 13 applied the design of experiments to study the main factor that causes the corrosion of aluminium–brass in industrial equipment and materials. In 2006 PCA was implemented as a technique for image analysis in order to determine the existence of damage in bridges. 14 In some other cases it has also been used for corrosion process analysis,15,16 to evaluate the effectiveness of corrosion inhibitors applied to different types of steel 17 and even applied to the analysis of damage or corrosion processes of reinforcements in structures using acoustic emission techniques.18–20
Principal component analysis algorithm is a simple tool for dimension reduction, in practice it is used as a method for processing and classification of data. The most common way to present its results is a bidimensional plot of a set of measurements in order to form groups (called clusters). Principal component analysis algorithm is the most utilised technique in chemometrics related to non-parametric pattern recognition method and unsupervised classification. The primary goal of this tool is to classify the data into a number of categories or classes.21,22
The main objective of PCA11,12 is to reduce the data set to lower dimensions, or less quantity of variables (also named principal components).
We have studied the electrochemical behaviour of carbon steels used commonly in construction elements, tracking the process of corrosion of steel in solutions with different pH values and in the presence of different anions, namely, chloride, sulphate, carbonate, nitrate and nitrite. Finally a PCA is performed to determine if the method allows additional information such as identifying the agents involved in the corrosion process.
Experimental
Samples preparation
Corrosion studies were carried out using five inorganic salts that may be present in natural or groundwater, i.e. sodium chloride, sodium sulphate, sodium carbonate, sodium nitrite, sodium nitrate. All these samples were prepared at a concentration of 0·1 mol dm−3 in water. Each salt was prepared at four different pH values: 7, 9, 11 and 12. Although the usual pH range in groundwater goes from 7 to 9, the studied range has been extended up to pH 12 in order to benefit the stability of oxides of electrochemical origin that are formed on the steel surface. Sodium hydroxide was used to adjust pH solutions values. All used compounds were of analytical grade and were purchased from Sigma-Aldrich. These anions were selected because they can be found and can intervene in natural electrochemical processes at water/steel interface.
Electrode preparation
To perform the assays it has been necessary to fabricate the electrodes with the steel under study. The electrodes may be connected to the rotating disk electrode (RDE) manufactured by Metrohm Autolab B.V. (Autolab RDE). The electrodes were prepared using solid round carbon steel bar type S355 J2 (UNE EN 10027-1-2006) 45 mm in length and 8 mm in diameter. The diameter of the steel rods was modified with a metalworking lathe and the final dimensions of the electrodes were 0·47 cm (diameter) and 0·166 cm2 (surface).
Subsequently steel electrodes were encapsulated using Epoxy Resin RS 199-1468 in Poly(methyl)Methacrylate (PMMA) cylinders, 8 mm in internal diameter, 10 mm in external diameter and 64 mm in length. In other to connect the electrodes with the rotating shaft of the working electrode a steel spacer was introduced in the PMMA cylinder. The spacer was 20 mm in length, 8 mm in external diameter and 3 mm in internal diameter. Finally, after inserting and connecting the spacer and the steel electrode inside the cylinder, the remaining interior space was filled with an inert material intended not to be affected during the assays. For this reason a two component epoxy resin was selected, reference RS 199-1468, which was cured for 2 days at 40°C. Figure 1 displays the working electrode sketch.

Details and dimensions of steel electrodes
Before use, the electrode surface was prepared by mechanical polishing with an emery paper, and rinsed with distilled water. Then it was polished on a felt pad with 0·05 μm alumina polish from BAS, washed with distilled water and polished again on a nylon pad with 15, 3 and 1 μm diamond polishes, to produce a smooth, mirror-like electrode surface. Later in the development of a series of measurements, only a simple diamond polishing was made.
Electrochemical techniques
Electrochemical experiments were performed using an Autolab PGSTAT100 instrument (Metrohm Autolab B.V.). Aqueous solutions of sodium chloride, sodium sulphate, sodium nitrite, sodium carbonate and sodium nitrate 0·1 mol dm−3 were studied at four different pH values: 7, 9, 11 and 12. Each solution was measured four times. Each replicate was carried out using each one of the manufactured electrode, resulting in a total of 60 samples (5 anions×4 values of pH×3 electrodes).
All measurements were performed under synthetic air, at a temperature of 25·0±0·1°C using a circulating bath (PolyScience 9106). The electrochemical experiments were carried out in a conventional three-electrode cell. The manufactured carbon steel electrodes were used as working electrodes. A platinum wire electrode and a saturated calomel electrode with KCl (SCE, 242 mV vs NHE) were used as counter and reference electrode, respectively.
Half cell potential and linear polarisation resistance
To assess the corrosion condition of low carbon steel electrodes, non-destructive electrochemical measurements (half cell potential and linear polarisation resistance) were carried out using two different equipments. The half cell potential (E corr) of the electrode from each specimen was monitored versus time and E corr value was obtained after a stabilisation time (achieved stability; potential drift less than 0·1 μV s−1). Stabilisation time was achieved in some cases after a few hours and was controlled using homemade potentiometer equipment. See Fig. 2.

Stabilisation time for three steel electrodes on sodium sulphate 0·1M at pH 7
After the half cell potential is reached a small potential scan defined with respect to the corrosion potential (E corr±10 mV) is applied to the metal at a scan rate of 0·05 mV s−1 and the polarisation current (which varies approximately linearly with potential within a few millivolts from E corr) is recorded. Corrosion current density (i corr, μA cm−2) is related to the specific LPR (Ω) by Stern–Geary equation

The experimental value of resistance R Ω for the used solutions has been determined by measuring the conductivity value between the Pt auxiliary electrode and a graphite electrode with the same working surface as the steel electrodes employed in the present study. The conductimetric determinations have been performed in the same electrochemical cell at 25°C and the measuring device used has been a Crison conductimeter GLP32.
Cyclic voltammetry
Cyclic voltammetry tests were performed after evaluating the LPR and controlling the stabilisation period of steel in the thermostatised cell under synthetic air. Experiments were carried out with static electrodes and RDE configurations. As stated above, the manufactured steel electrodes were used as working electrodes. A scan rate of 10 mV s−1 and a rotation speed of 1500 rev min−1 were used for cyclic voltammetry RDE experiments.
For these voltammetric studies two consecutives scans starting at E corr were made. For the statistical analysis, only the data corresponding to the second scan was used because of their higher reproducibility.
Data management: Multivariate analysis
Multivariate data analysis is used to treat the raw data obtained from the instruments. Principal component analysis is an example of such multivariate data analysis which explains the variance in the experimental data. 25 Principal component analysis provides a score plot that can visualise differences among the observations or experiments. This can be used for classification or grouping of the observations. The first principal component (PC1) is the dimension along which the observations are maximally separated, or spread out. The second principal component (PC2) is the linear combination with maximal variance in a direction orthogonal to the first principal component, and so on. 26
For the instrumental data, a data matrix was created where the number of objects was decided by the number of experiments and the variables were the current responses created by the applied potential. 27
The software application used to perform the statistical analyses is Solo (version 6·5, Eigenvector Research, Inc.). As preprocessing step of the data matrix before the PCA an autoscale is performed since it allocates the same variance to all the variables and so every variable has the same influence on the estimation of the components.
Results and discussion
Analysis LPR and E corr results
The LPR method allows the analysis of the current versus the potential curves. This analysis provides information about the system's features by means of two basic data; the value of the equilibrium potential and the current value of the electrochemical corrosion.
Figure 3 displays the evolution of the current flowing through electrode 1 over the applied potential in the presence of chloride, sulphate, nitrate and sodium carbonate 0·1M and pH values of 7 and 9. There is a small hysteresis cycle because of the existence of the charge and discharge processes of the electric double layer during the potential scan which has been considered in accordance with the works presented by Marchand 28 when calculating the polarisation resistance (R p) of the system.

Small amplitude cyclic voltammograms depicting I–E response for chloride (black square), carbonate (white square), sulphate (black circle), nitrate (white circle) 0·1M at pH 7 and 9. Scan rate 0·5 mV s−1
Table 1 contains the average R Ω values of the different solutions under study. As it can be observed, the obtained values are between 9 and 20 ohm. Even they are not high values they have been considered in the calculations of the polarisation resistance of the electrodes.
Ohmic drop values (R Ω) of medium in presence of different ions (0·1 mol dm−3) at four pH values
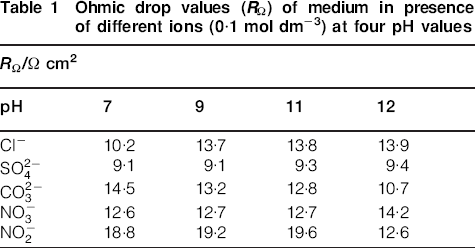
Table 2 contains the normalised average R p values for a surface of 1 cm2. The obtained values for the solutions under study are comprehended between 0·2 kΩ cm2 in aggressive media and from 100 to 200 kΩ cm2 in inhibitor media.
Polarisation resistance of steel electrodes in presence of different ions (0·1 mol dm−3) at four pH values

Tables 3 and 4 show the average values obtained for corrosion potentials (E corr) and corrosion rates expressed in μA cm−2 of this study.
Steel electrodes corrosion–potential average values (E corr) in presence of different ions (0·1 mol dm−3) at four pH values

Steel electrodes corrosion current density (μA cm−2) in presence of different anions (0·1 mol dm−3) at four pH values

Figure 4 shows the variation in the average corrosion potential (E corr) of the steel electrodes versus the pH for the studied anions at a concentration of 0·1 mol dm−3.

Steel electrodes corrosion potentials [mV(SCE)] versus pH for several anions
This figure allows us to propose that there are three distinct behaviours of steel electrodes when the studied anions are present:
the first type corresponds to those anions that display a potential vs pH convex curve (nitrate, chloride and sulphate)
the second behaviour is presented by carbonate, which displays a potential vs pH concave curve
the third behaviour is displayed by nitrite. This ion shows an almost linear variation of the electric potential vs pH.
Bearing in mind that the nitrate ion generally has a poor chemical reactivity (for example it is not considered as a precipitant or coordinating ion) it can be considered that the curve potential vs pH of this ion can serve as model for studying the corrosion of steel in the presence of others ions.
Chloride and sulphate ions, which are included in the first group, cause the corrosion potential of the steel electrodes to become more cathodic at pH 7 (−645 and −699 mV respectively) with an increment of −95 and −149 mV compared to the corrosion potential of nitrate anions. As shown in Fig. 4, the corrosion potential value remains practically constant in the pH range between 7 and 9 but increases significantly upon reaching pH 12, in this state the corrosion rate can be considered negligible.
As it is well known, the presence of chloride and sulphate anions facilitates the corrosion of steel which is confirmed by the obtained corrosion potential. 29 This corrosion potential decrease could be interpreted as a reduction of the interfacial activity of Fe+2 due to the formation of iron–chloro complexes.
The significant decrease in the corrosion potential in the steel–sulphate system when it is compared to the steel–nitrate system may be due to the formation of ionic pairs such as (iron II–sulphate) or the possible formation of the complex specie, iron (II)–sulphate;30,31 any of these processes reduces the chemical activity of iron. In addition, Table 4 shows that the corrosion current density in the presence of chloride and sulphate anions is much higher than that in the presence of the other species but carbonate (which will be discussed later) in the pH range between 7 and 11; at pH 12 the rate difference is negligible.
Carbonate ions behaviour is different from that described for the first group. They are capable of forming insoluble compounds with ferrous or ferric ions, which seems to be the determining factor for addressing the electrochemical behaviour of these systems versus pH. However, steel in the presence of carbonate at pH 7 shows a similar corrosion potential to the anions in the first group which appears to be the reason why iron carbonate precipitates are not significantly present at this pH value.
When these anions are already at a clearly basic pH, products form insoluble or sparingly soluble compounds such as iron–carbonate. These products get adhered to the steel surface and cause a drastic change in the corrosion potential compared to the anions in the first group. In fact around pH 9, carbonate shows a significant variation in the corrosion potential (about 250 mV with respect to the measured value at pH 7) and from this value, there is a progressive slump while increasing pH to a final value of −200 mV(SCE) at pH 12.
The third behaviour is exhibited by nitrite anion. This ion shows an almost linear electrical potential variation for all the pH range, where a slope of about 30 mV per pH unit is displayed. This behaviour can be attributed to the polarisation of the steel electrode, caused by the electrochemical nitrite-reducing character.
Figure 5 shows the average variation of the I corr value for the steel electrodes under study in microamperes per square centimetre versus the pH of the studied anions at a concentration of 0·1 mol dm−3 and 25°C.

Steel electrodes corrosion current densities (μA cm−2) as a function of pH for studied anions
Figure 5 shows that sulphate, chloride and carbonate anions exhibit an appreciable corrosion rate within the range of pH between 7 and 11. Nitrate anion displays a similar behaviour but its corrosion rate is lower and less dependent to pH. Finally, none of these four anions present significant corrosion at pH 12.
Finally, the steel in the presence of nitrite anion shows such small corrosion current values for the entire pH range due to the elevated inhibitor activity of this anion.
Voltammetric data
The second objective of this work is to study the influence of pH in the stability of these metal–ion systems and try to use this information to determine whether particular chemical species can produce a corrosion process under certain conditions. To achieve this, the electrochemical behaviours of sensors have been studied at different pH values in the presence of different anions by using cyclic voltammetry as electrochemical tool.
Figure 6 shows the cyclic voltammograms of four electrodes at different pH values (7, 9, 11 and 12), in the presence of sodium sulphate 0·1 mol dm−3. The voltammetric scans were made by means of static and rotating electrode tips at 1500 rev min−1 and at a scan rate of 10 mV s−1.

Cyclic voltammograms with rotating disc electrodes at 1500 rev min−1 at pH 7, 9, 11 and 12 in presence of sodium sulphate 0·1 mol dm−3 (T = 25°C)
The reproducibility of the obtained results with all four different electrodes at the same pH value is satisfactory as shown in Fig. 6. The small differences observed can be attributed to dissimilarities in the local composition of industrial steel. Mechanical polishing of the electrodes usually homogenises these small differences on the steel surface and in their electrochemical response.
The voltammograms (such as the example shown in Fig. 6) have been performed starting from the E corr for each of the studied anions. The scans start in cathodic direction until a potential of −800 mV is reached. Then the scan direction is reversed to produce the oxidation of the metal surface. The maximum value for the anodic potential was selected depending on the anion and the pH of each experiment.
For example, the obtained voltammograms for nitrate at pH 7, 9 and 11 show corrosion processes at a potential around −550 mV measured vs SCE. The current values in the presence of chloride for pH 9 and 11 are 8·81 and 6·34 μA respectively, while for pH 12 the measured current is negligible at the same potential. Moreover, it is noteworthy that in the voltammograms at pH 12 and in the potential range between −300 and +600 mV the current is very close to zero. When the voltammograms reach a potential value of +600 mV, the oxidation process of the steel electrodes begins which is experimentally sustained by the appearance of a brown–orange precipitate of iron hydroxide in the solution.
The voltammograms obtained for the sulphate anion show a similar response to the one displayed by the chloride anion. For pH values lower than 11, the remaining anions display currents remarkably lower than current values obtained in the presence of chloride.
PCA analysis
The electrochemical information obtained from the cyclic voltammograms was analysed using a PCA. As stated above, this technique decomposes the variables obtained for all the samples onto a new coordinate axis. The number of variables must be the same for all the samples. For this reason the most restrictive range has been used: for example, RDE samples, ranges from −0·6 to +0·4 V. In this voltage range values from all the anions were available. The cyclic voltammograms performed for each sample provided 821 current values resulting on a matrix of 60 (5 anions×4 pH values×3 replicates)×821 for the static configuration; for the dynamic setup 64 samples (5 anions×4 pH values×3 replicates+4 replicates of chloride–sulphate mixture at pH 7) and 661 current values each where used to build the matrix.
Principal component analysis provides two types of plots: scores plot and loading plot. The scores plot is the representation of the principal components obtained after the analysis. This kind of plot induces spontaneous clustering of samples based on the fundamental similarities or differences detected among them.
In order to evaluate the effect of the movement of the water surrounding the steel with respect to the corrosion rate two parallel studies were carried out: in the first one the solution was maintained motionless and in the second study the solution was forced to flow uniformly towards the electrode surface, intending to emulate a situation where the water flows around the electrode. For this second study an RDE has been used because it allows the precise control of the fluid speed by simply modifying the rotational speed of the device. In this case the working rotational speed has been set to 1500 rev min−1.
These two working scenarios (static and dynamic liquid) allow exhibiting the local pH variations effect or the importance in the matter transport velocity variation as a consequence of the diffusion layer diminution caused by the electrode rotation.
Calibration–validation test
In order to validate the PCA analysis a series of tests have been realised. A splitting algorithm integrated in SOLO software has been used to separate the whole data set into a calibration set and a validation set. The software permits to choose between two splitting algorithms. The one used is called onion method (keeps outside covariance samples plus random inner-space samples) and the user has to decide the percentage to keep in the calibration set. The algorithm has been set to keep 2/3 in the training set and the remaining 1/3 to be used as calibration set.
Figure 7 corresponds to the data from RDE electrode measurements and displays the samples–scores plot of the calibration and validation data sets. When comparing the clusters of training data and test data the similarities are obvious. This result allows us to say that the model is valid.

PCA plot: training and test groups for RDE assays
Cyclic voltammetry study with static electrode
Figure 8 shows the PCA plot of the voltammetric data obtained with static steel electrodes at pH 7, 9, 11 and 12 for all the studied anions.

PCA scores plot created for studied anions: chloride (black square), carbonate (white square), sulphate (black circle), nitrate (white circle) and nitrite (white triangle) from voltammetric data of stainless steel electrodes. Number close to each point corresponds to its pH value
Principal component analysis scores plot in Fig. 8 shows that the data variance of the first principal component (PC1) is 90·16% which indicates that it contains essential information and establishes the fundamental bases for the discrimination and classification of the system, while PC2 contains 5·69% of the information. The data variance represented by the first two components is 95·85%, indicating that these two components contain the necessary information to perform the study of the system and the interpretation of the results.
As it can be seen in Fig. 8, all samples can be grouped in three different clusters. First cluster (group A) appears in the zone of more negative values of the first component PC1 while the remaining two groups are located in the positive values in PC1. Group C, which displays the most positive values in PC2 is formed by sulphate anion at different pH values (7, 9 and 11). It is known that this anion induces high corrosion rates in low carbon steel as it can be seen in Table 4. In a larger region of PC2 appears group B, which comprises chlorides at pH 7, 9 and 11. Also in this condition, the corrosion process presents important rates (see Table 4). This corrosion process can be considered severe owing to the presence of chloride anions which might favour the oxidation of Fe(II) to form the thermodynamically stable hydroxo and chloro complexes of Fe(III). The fact that the responses of chlorides and sulphates group apart is very interesting because it allows the diagnosis of the original cause of the particular corrosion process, which allows an accurate inhibition strategy.
Finally, in the negative region of PC1, the scores plot displays cluster A. This cluster contains nitrate, nitrite and carbonate anions at the four studied pH values. Chlorides and sulphates also appear inside the cluster, but only at pH 12. A zoom of this cluster is represented in Fig. 9. As it can be seen, this cluster can be divided in two new subclusters. Subcluster A1 contains all nitrite samples, carbonates at 11 and 12 pH and sulphates at pH 12. The corrosion density obtained for these samples is very low, may be related with a passivation processes. Moreover, subcluster A2 is formed by nitrate anions at pH 7-12, carbonates at pH values from 7 to 11 and chlorides at pH 12, which correspond to minor corrosion processes.

Zoom of PCA scores plot crated for group A
Cyclic voltammetry study with dynamic electrode
Figure 10 shows the PCA plot of the voltammetric data obtained with rotating steel electrodes (1500 rev min−1) at pH 7, 9, 11 and 12 for all the studied anions and an extra group which contains a mix of chloride and sulphate anions.
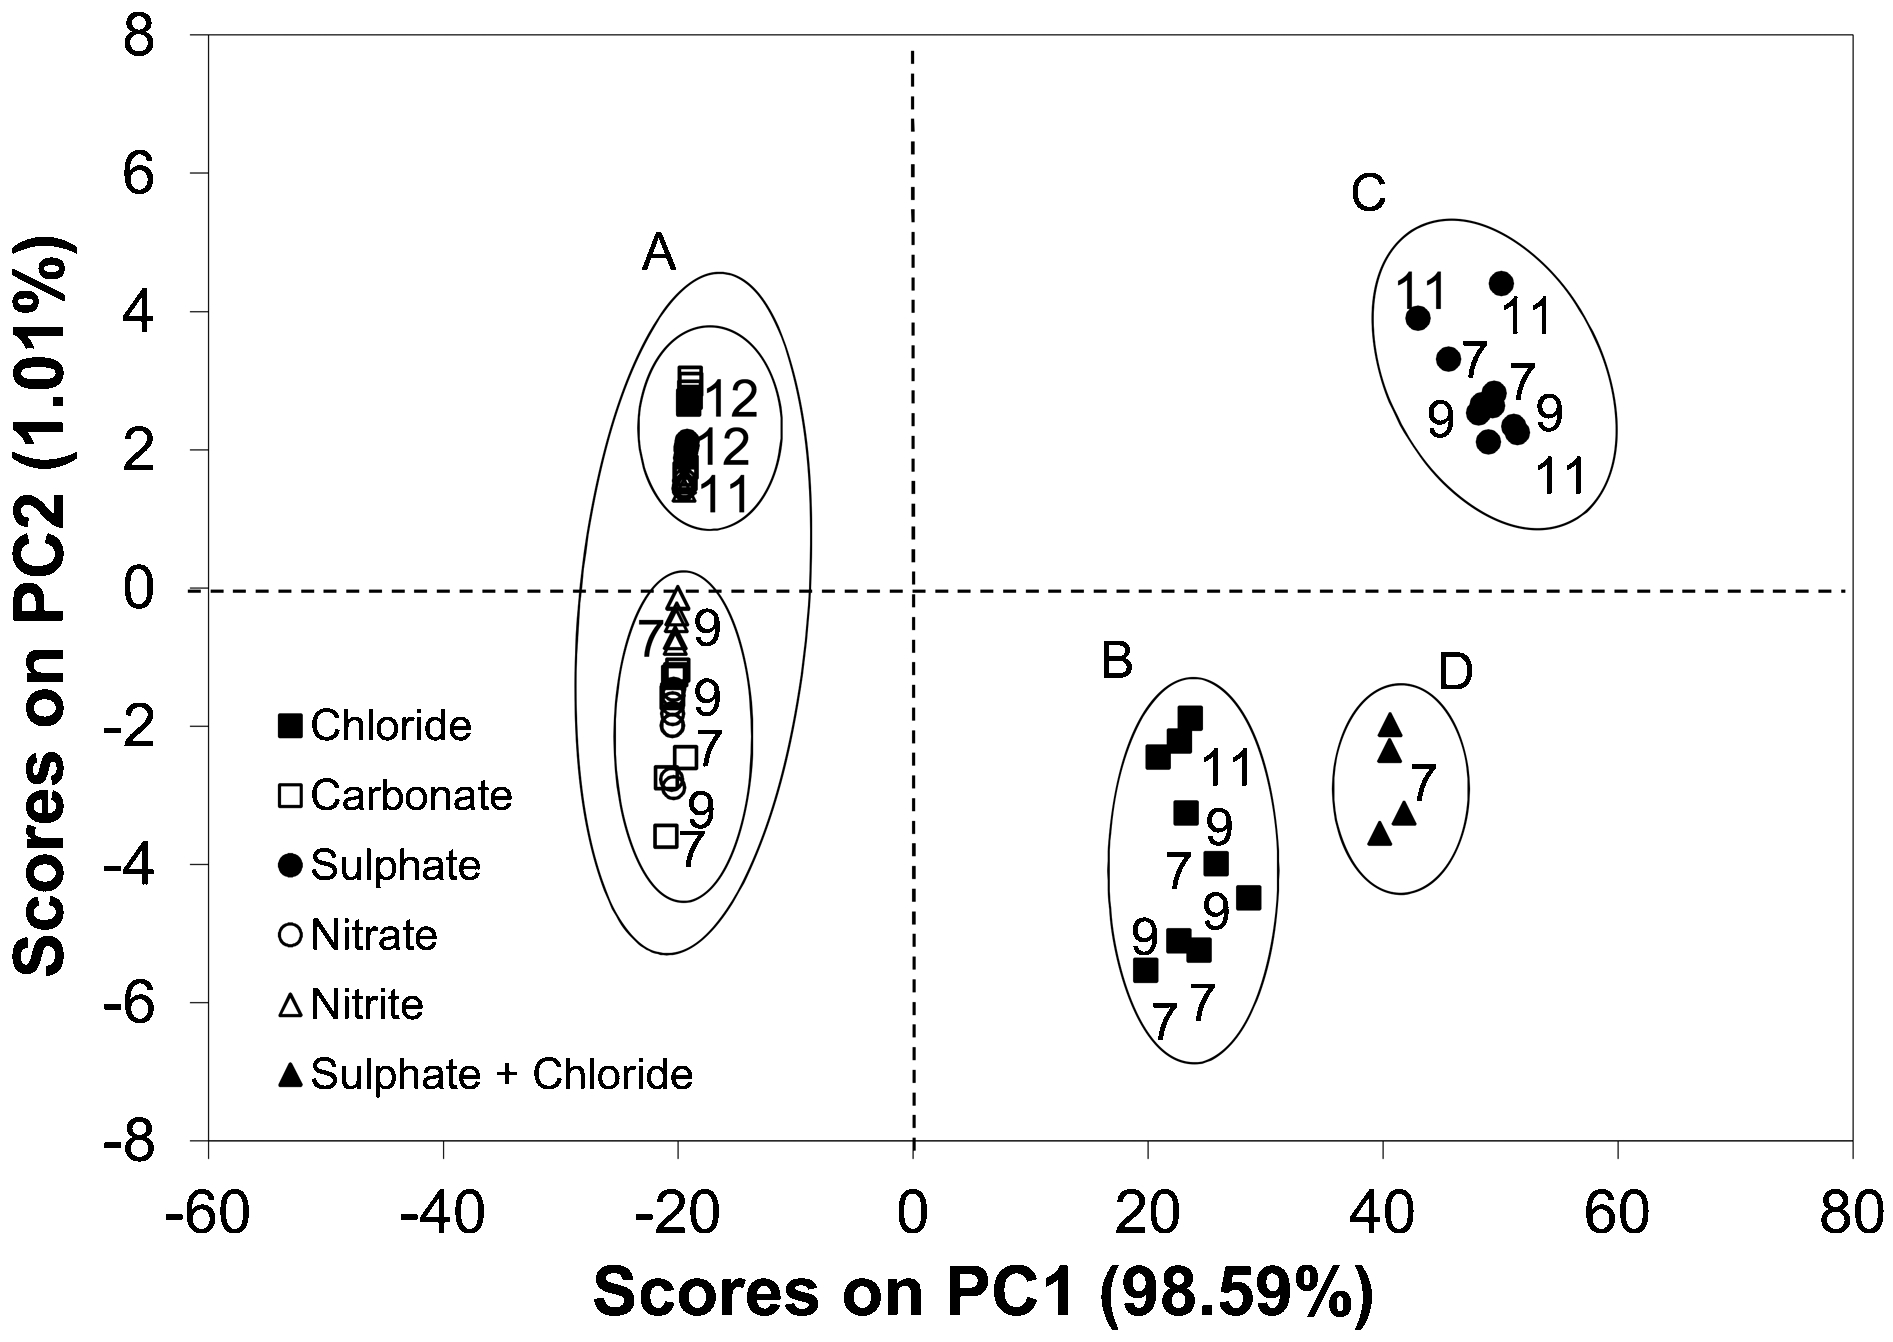
PCA scores plot created for studied anions with steel RDE at 1500 rev min−1: chloride (black square), carbonate (white square), sulphate (black circle), nitrate (white circle), nitrite (white triangle) and mix sulphate+chloride (black triangle) from voltammetric data of stainless steel electrodes. Number close to each point corresponds to its pH value
Principal component analysis scores plot in Fig. 10 shows that the data variance of the first principal component (PC1) is 98·59% which indicates that it contains essential information and establishes the fundamental bases for the discrimination and classification of the system, while PC2 contains 1·01% of the information. The data variance represented by the first two components is 99·6%, indicating that these two components contain the necessary information to perform the study of the system and the interpretation of the results.
As it can be seen in Fig. 10, all the samples are grouped in four different clusters. Cluster A appears again in the negative zone of the first component PC1 while the remaining three groups are located in the positive values of PC1. Group C, which displays the most positive values in PC2 is formed by sulphate anion at different pH values (7, 9 and 11). In a different region of PC2 appears group B which comprises chlorides at pH 7, 9 and 11. These results are very similar to those obtained from the static electrodes.
Given that the system distinguishes chloride and sulphate corrosion events individually, a study to analyse the system's response to an attack produced by a mixture of these two anions has been performed. These solutions were prepared as follows: sulphate–chloride, 1∶1 at pH 7, at a concentration 0·05 mol dm−3 of chlorides and sulphates, thereby the total molarity of the previous study (0·1 mol dm−3) was maintained constant. Cluster D in Fig. 10 comprises these samples which are placed in between the clusters corresponding to the individual corrosive anions (B and C).
Just as with the static setup, cluster A contains anions nitrate, nitrite and carbonate at the four studied pH values. Chlorides and sulphates also appear inside this cluster at pH 12. A zoom of this cluster is represented in Fig. 11.
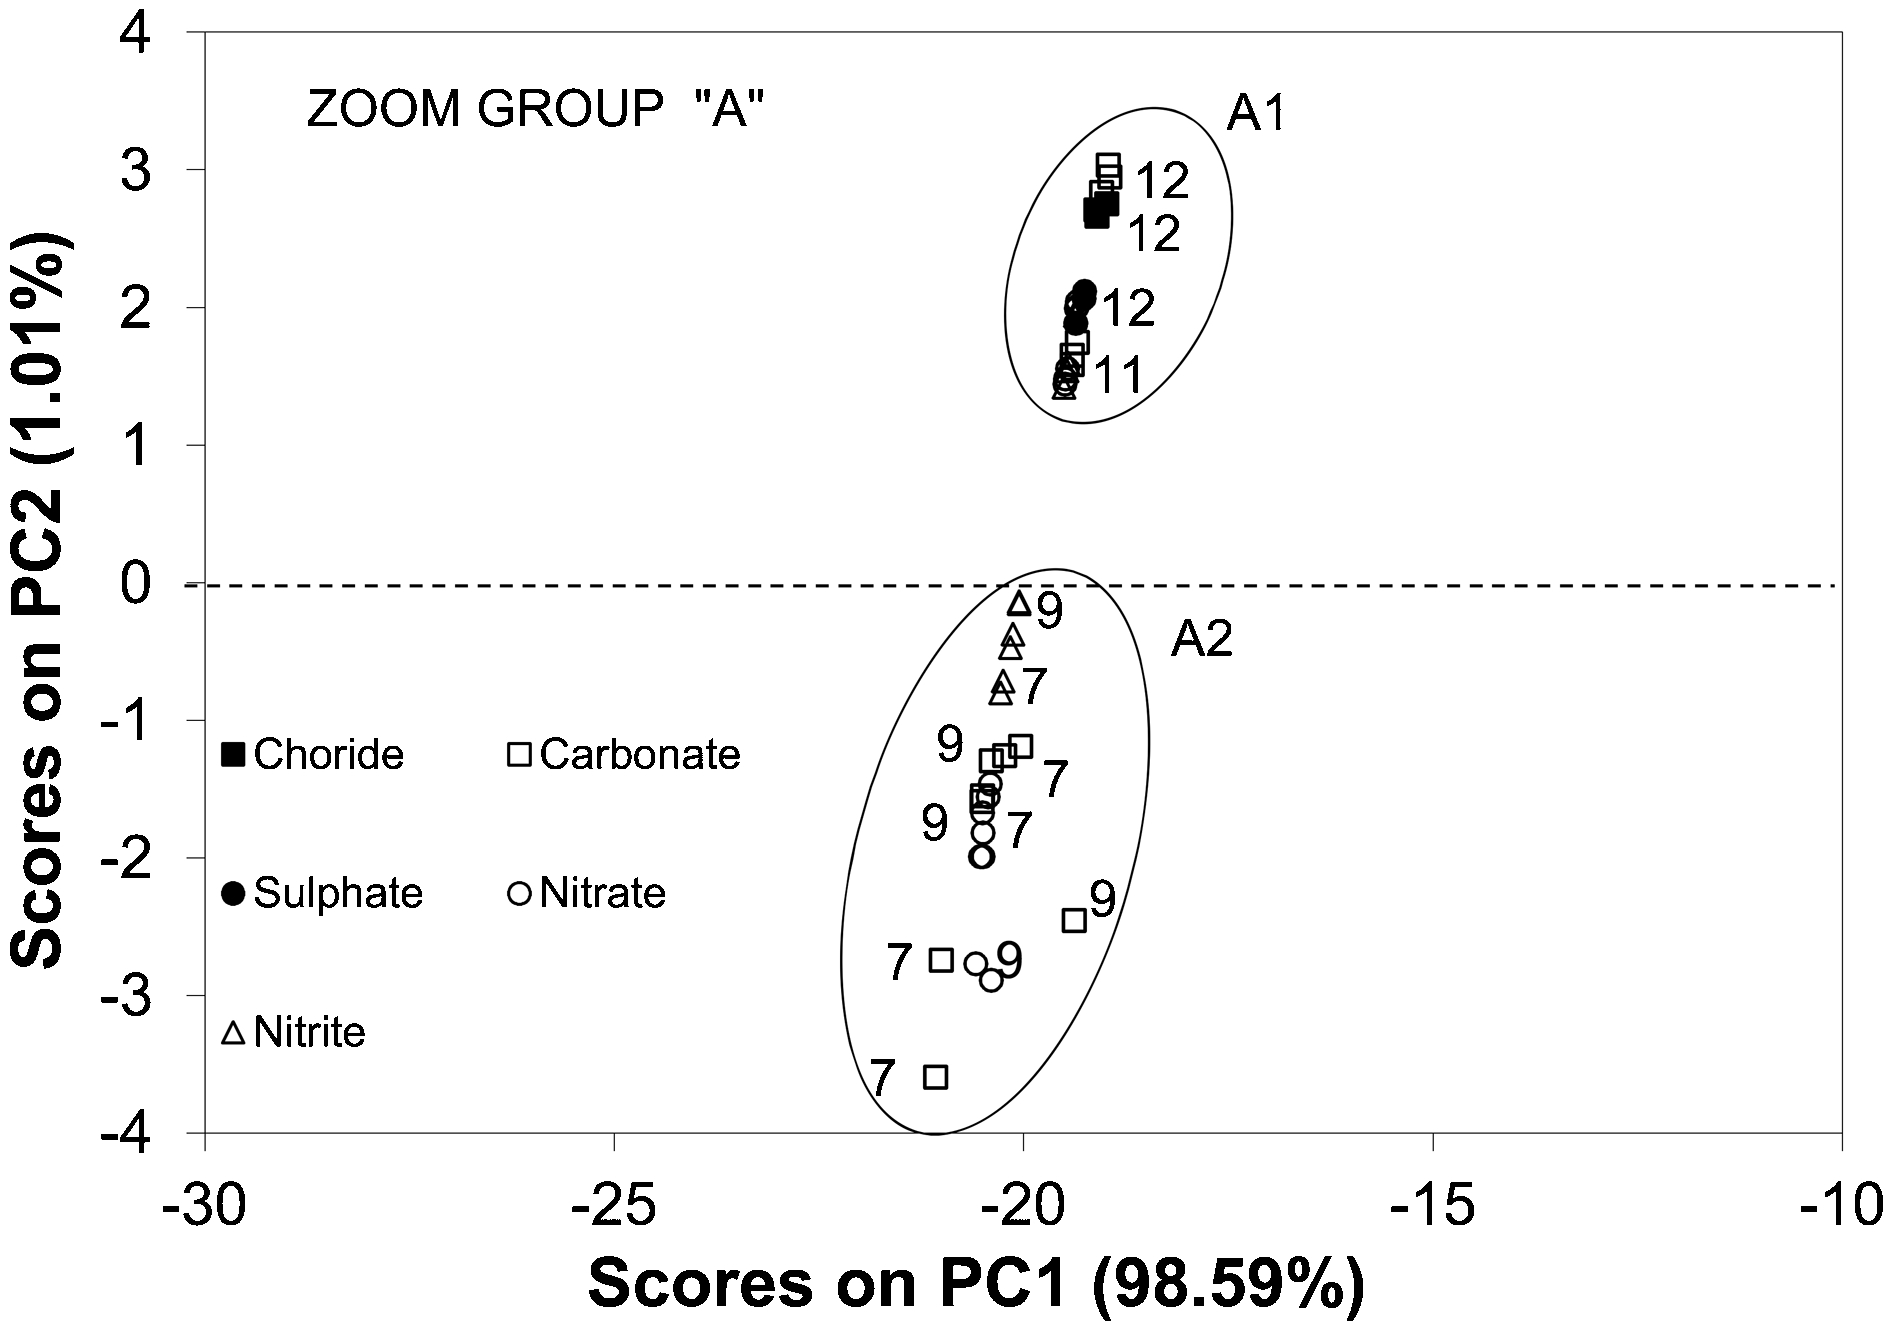
PCA scores plot created for cluster A
As it can be seen, this cluster can again be divided into two new subclusters. Subcluster A1 contains nitrite, nitrate and carbonate anions at pH 11 and 12, and chlorides and sulphates at pH 12. The corrosion density obtained for this situation is very low. Moreover, cluster A2 is formed by the anions nitrite at pH 7-9, and nitrate and carbonate at pH values of 7, 9. This subclustering achieves the total discrimination of pH inhibition, that is, A1 comprises all samples at pH 12 as well as the samples at pH 11 of nitrite, nitrate and carbonate which always present low corrosion activity as the samples at lower pH values are placed in subcluster A2.
To conclude, it can be stated that the PCA scores plot are able to distinguish different systems based on their corrosion rates. Furthermore, these results denote that PCA has a great capacity to point out the existence of corrosion processes induced by chlorides or sulphates compared to other anions such as carbonates. The fundamental difference between the corrosion processes caused by carbonates compared to chlorides lies in the fact that with carbonates the corrosion is a fundamentally uniform process while in presence of chlorides the corrosion process is very localised, commonly known as pitting. Principal component analysis seems to clearly distinguish these two forms of corrosion. This is why this technique should be explored deeply due to its promising potential and feasible application to metallic corrosion studies.
The analysis of the generated loadings in the PCA study sometimes permits to establish some correlations between the principal components and the measured variables. Figure 12 corresponds to the loading plots, which allow representing the percentage weight of the variables in each of the principal components. It is interesting to observe the plot considering that the order in which the variables have been introduced in the data matrix goes from 0·4 V (variable 1) to −0·6 V (variable 411) and then return to 0·4 V (variable 821). In Fig. 12 it can be observed that PC1 largest variance is contained in variables 1 to 340 and 481 to 821. In the variables in between (potential steps from −0·43 to −0·6 V) the loadings in PC1 are relatively smaller. Loadings at PC1 seem to be related to the current intensities and therefore related as well to a greater corrosion probability.
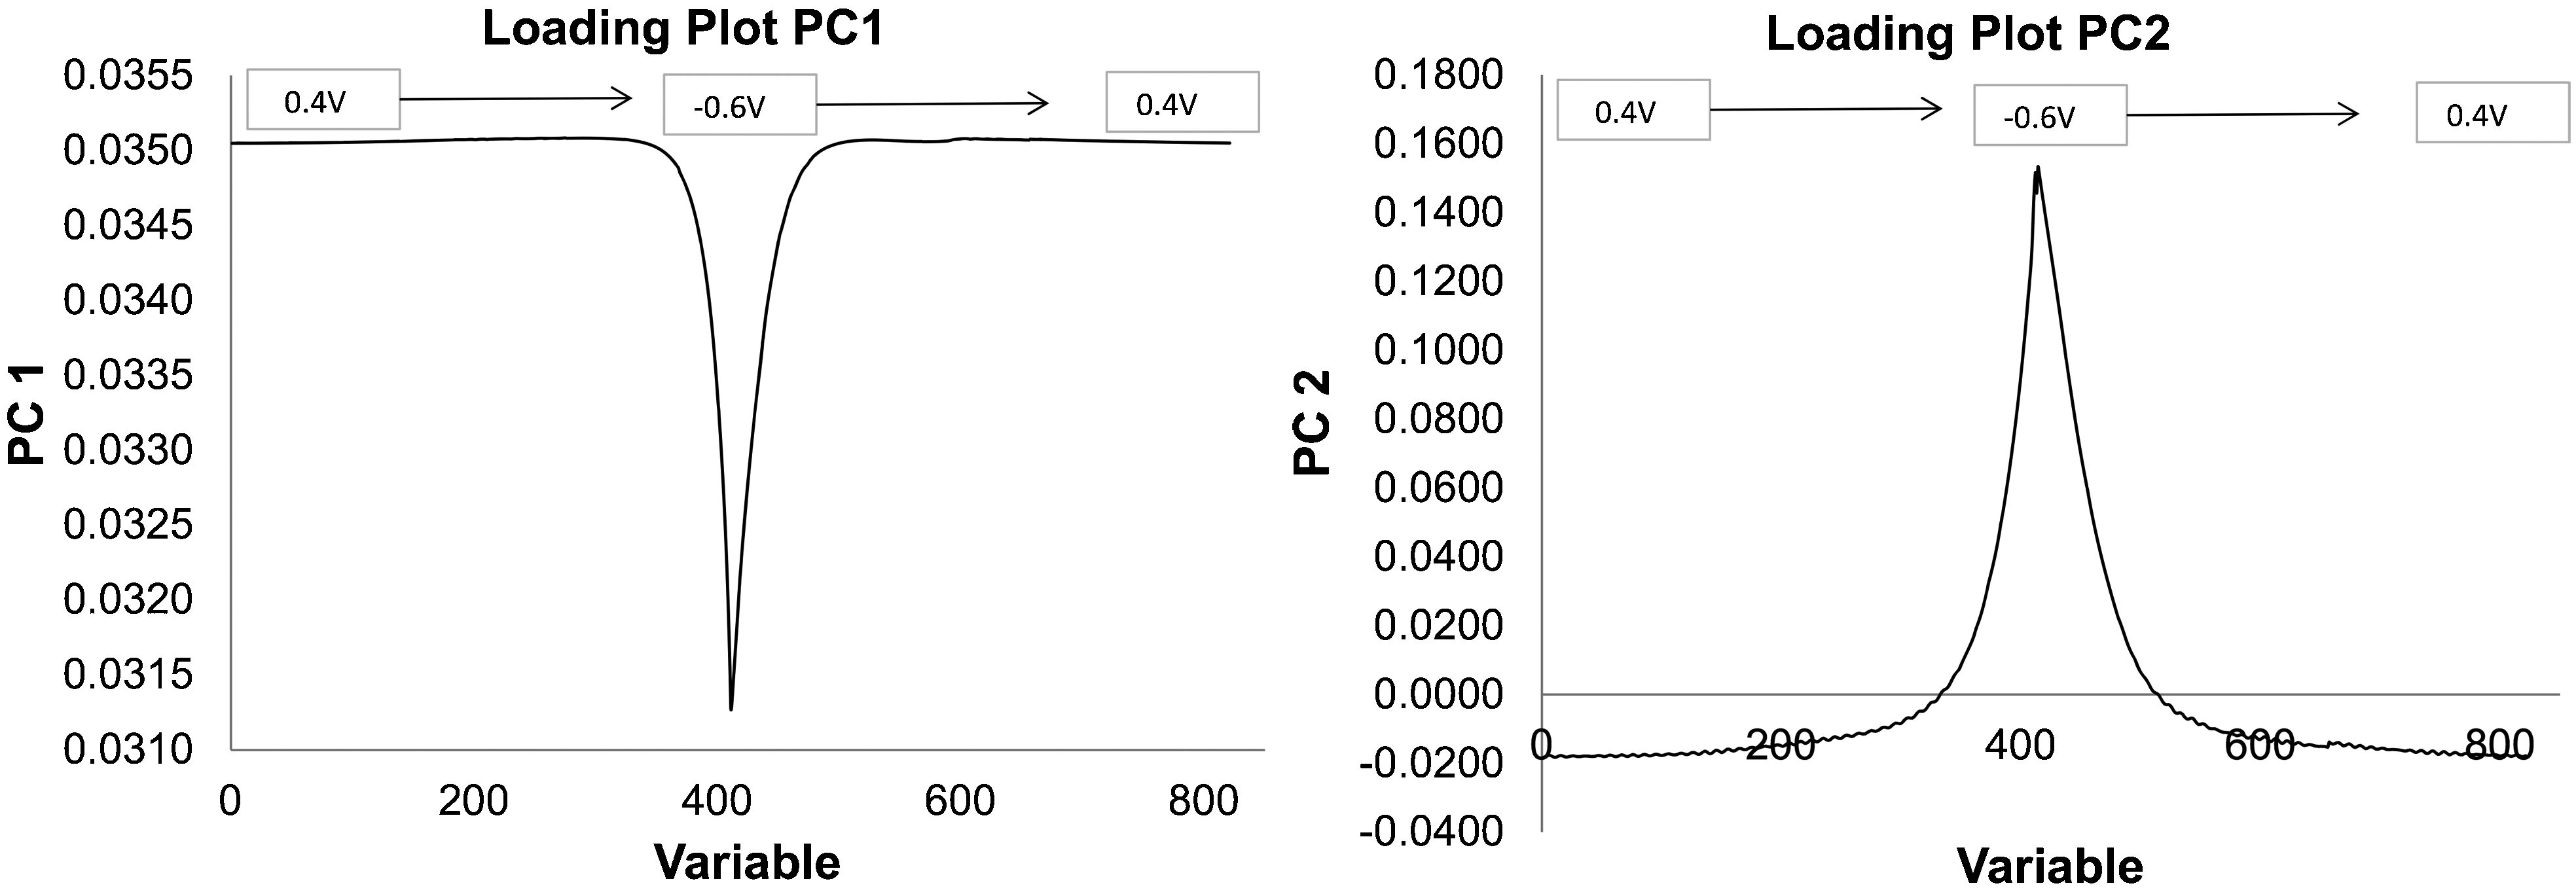
Loading plots
In PC2, only the variables corresponding to the peak (variables 319 to 532; highest loading around variable 414) have a considerable weight. Loadings at PC2 seem to be related to the polarisation curves close to −0·6 V.
Figure 13 displays the cyclic voltammograms of  ,
,  , Cl− 0·1M and the mixture
  (0·05M) with Cl− (0·05M) at pH 7. Both included rectangles gather the potential ranges where PC1 and PC2 have a higher statistical weight. From this figure it can be inferred that PC1 is related to the corrosion currents at the anodic region of the voltammograms. While in the potential range from −0·43 to −0·6 V, associated to PC2, it seems to be related to the most cathodic values of the studied range.

Cyclic voltammograms of ,  , Cl− 0·1M and mixture
  (0·05M) with Cl− (0·05M) at pH 7
This work is only a proof of concept of our final goal for which carbon steel has been used as a sensor to monitor the corrosion processes and to determine the agents causing this phenomenon.
Conclusions
Voltammetric techniques (half cell potential, linear polarisation resistance and cyclic voltammetry) have been applied to the study of low carbon steel corrosion. This study has been performed in aqueous media with different compositions and different pH values.
In this study, the current and potential data obtained by large amplitude voltammetric scans have been used. In addition, LPR analysis has been applied to obtain the values of corrosion rates and corrosion potentials by means of the current–potential curves. This was achieved by applying small voltammetric scans around the open circuit potential to minimise electrode polarisation. Principal component analysis with voltammetric data shows that it is possible to evaluate the corrosion stability of the steel when the metal is in direct contact with aqueous media.
It has been discussed that hydrodynamic techniques enhance the performance of this study. A simple way of achieving this was to use an RDE which forced the sample under study to flow uniformly towards the electrode surface, intending to emulate a situation where the water flows around the electrode. The results improved compared to the static study.
The analysis of the matrix formed by the current versus potential of the voltammetric data allows the determination of the stability of steel against corrosion by means of PCA. Besides, in the event of a corrosion process, it allows the diagnosis of the type of ion (sulphate, chloride or mixtures chloride/sulphate and the pH) causing it.
Moreover, the information obtained by means of LPR permits the observation of the corrosion tendency of the system, but it is not able to clearly discern the species that cause it. Principal component analysis plots also show that the disposition of samples depends on the pH value and on the anion used in the particular study.
Finally, PCA diagrams allow the evaluation of the ability of nitrite to act as a corrosion inhibitor by observing its position in the PCA plot.
Acknowledgements
The financial support from the Spanish Government (project MAT2009-14564-C04) Generalitat Valenciana (Valencian Regional Government; project PROMETEO/2009/016) and to ‘Programa de Apoyo a la Investigación y Desarrollo’ de la Universidad Politécnica de Valencia (PAID-05-12) is gratefully acknowledged.