
Abstract
A series of experiments were conducted in autoclave to investigate corrosion properties of low Cr oil country tubular goods in CO2/H2S saturated brine solution (3 wt-%NaCl) at 90°C. Test material is 3Cr-80, which is gradually accepted in oil and gas industry, especially for downhole tubing and casing. The CO2 partial pressure was fixed at 4·0 bar in all experiments, and the H2S partial pressure was varied from 0, 2, 4, 8, 20, 40 and 800 mbar to 4000 mbar (4 bar). The results show that when the pH2S varied at a lower range (2-40 mbar), 3Cr-80 materials’ corrosion rates were restricted, and coupons’ surface morphologies became glossy compared to the pure CO2 corrosion. Under the condition of pH2S = 800 mbar, H2S no longer have a retardation effect on CO2 corrosion but acceleration. The average corrosion rate was higher than pure CO2 corrosion. When the pH2S rise to 4000 mbar (equal to the CO2 partial pressure), 3Cr corroded much more severe and serious mesa attack was observed.
This work was supported by the funding of “Introduction Talents Scientific Research Project (YJRC-2013-19)”, China University of Petroleum, Beijing.
Introduction
CO2/H2S corrosion is one of the most prevalent forms of degradation of transportation pipe line, downhole tubing and refine facilities. In past several years, researches gradually tend to accept that trace amounts of H2S can retard CO2 corrosion in carbon steel,1–5 including general corrosion and pitting attack. The main reason for this retardation is the fast formed protective iron sulphide layer.5,6 In an H2S present environment, many types of iron sulphides may form such as amorphous ferrous sulphide, mackinawite, cubic ferrous sulphide, smythite, greigite and pyrrhotite, among which mackinawite is considered to form first on the steel surface by a direct surface reaction, 7 and performs a good protection. Even very small amounts of H2S still can form this FeS layer. Smith and Pacheco presented a detail work on predicting minimum H2S concentration for reduction of CO2 corrosion in mild steel in slightly sour environment. He found that basic thermodynamic principles can be used to calculate the minimum H2S levels for retarding CO2 corrosion, and 25 ppm H2S was the critical value for his experimental condition. 7 Based on their calculation, most of previous studies were in reduction zone; thus, lower corrosion rate was obtained.
This type of inner layer was observed also at high temperature and seemed much denser than the outer layer. 4 It also was reported in an early time that the crystalline precipitation product of ferrous ions by H2S was solely composed of mackinawite <100°C in the absence of oxidants. 8
However, some researchers who hold an opposite opinion still argue that a certain amounts of H2S will lead to severe localised corrosion in mild steel. Tang et al. reported that the corrosion rate of SAE-1020 carbon steel at 90°C increased with the increase of H2S concentrations from 58·91 to 408·44 mg L−1, and severe localised corrosion on the carbon steel surfaces was observed in H2S containing solutions. 9 For carbon steel, pitting attack usually related to the cementite structure in steel, which acts as a cathode with respect to ferrite in acidic solution. 10 In addition, galvanic coupling between FeS covered and uncovered area is another possible reason for localised attack in sour environment. 11
Another popular topic in this area was the difference of sweet or sour environment, which was based on the partial pressure ratio of CO2/H2S.12–15 The earliest mention of a value of 500 for the CO2/H2S ratio was posted by Dunlop et al. in 1983. 16 Based on their research, Srinivasan and Tebbal presented a more detail diagram for clarifying the corrosion environment. If the ratio of CO2/H2S is less than 200, the environment was dominated by sour corrosion; if this ratio is between 200 and 500, it was mixed control; and if this ratio is less than 500, the environment was dominated by CO2. 13 A few years later, Bernardus et al. changed this lower border from 200 to 20. 17 This rule of thumb has been cited in a lot of paper. However, Smith pointed out that this rule of thumb value (500) was obtained just by chance selection from a wrong iron sulphide free energy data in the early time (1983). In addition, this value was extremely sensitive to thermodynamic data inputs. This rule of thumb value actually makes no sense to the sweet or sour environment. 12 The only useful values for corrosion research are the CO2 and H2S absolute partial pressures in gas phase or the concentrations in aqueous phase.
In addition, most of the previous studies focus on carbon steel; few of them mentioned low Cr content steel. This paper presented a full range of experiments on 3%Cr materials in oil and gas industry and tries to find the critical point for H2S retarding on CO2 corrosion.
Experimental
Materials
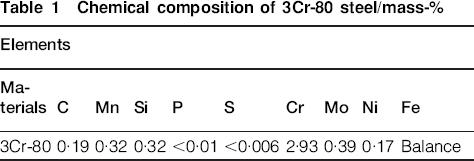
Low Cr content steels were used and gradually accepted in recent 10 years because of the low cost and good performance on resisting CO2 pitting attack. Chemical composition of 3Cr-80 steel is shown in Table 1.
Chemical composition of 3Cr-80 steel/mass-%
Test matrix and solutions
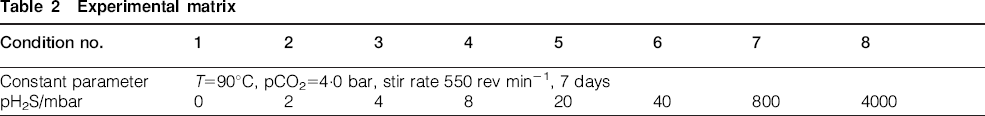
In total, eight series test conditions were performed in this study and test matrix is shown in Table 2. Temperature, CO2 partial pressure, liquid velocity and solution chemistry were not varied. The only varied parameter was H2S partial pressure.
Experimental matrix
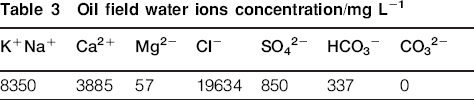
The solution was simulated oilfield water. The original solution pH is 6·8, and the ion concentrations are shown in Table 3.
Oil field water ions concentration/mg L−1
Equipment and procedures
All of the experiments in this study were conducted in a 2.0 L autoclave (Fig. 1). This autoclave was described specifically in an earlier study. 18 The specimens were polished with silicon carbide no. 320 and no. 600 papers, rinsed with distilled water, degreased in acetone and then weighed after drying. The specimens were mounted on a holder, which was made of poly(tetrafluoroethylene). The holder was placed in the autoclave, then the brine solution was added into the vessel and the autoclave was closed. In the beginning, the temperature was raised to 45°C to remove some of the dissolved oxygen from the solution, and then purged with N2 gas for ∼2 h. After purging with N2, CO2 or CO2/H2S mixed gas (pre-prepared) was injected into the autoclave and kept flowing for about 5 min in order to remove the residual N2, then the outlet valve was closed, and the temperature and pressure were raised to designed values. The gas saturated process usually takes ∼1 h to fully saturate, and the judgment is pressure drop <0·1 bar within 30 min after the inlet was closed. Flow velocity was ∼1·7 m s−1 (rotation speed, 550 rev min−1). The testing duration was 7 days (168 h).
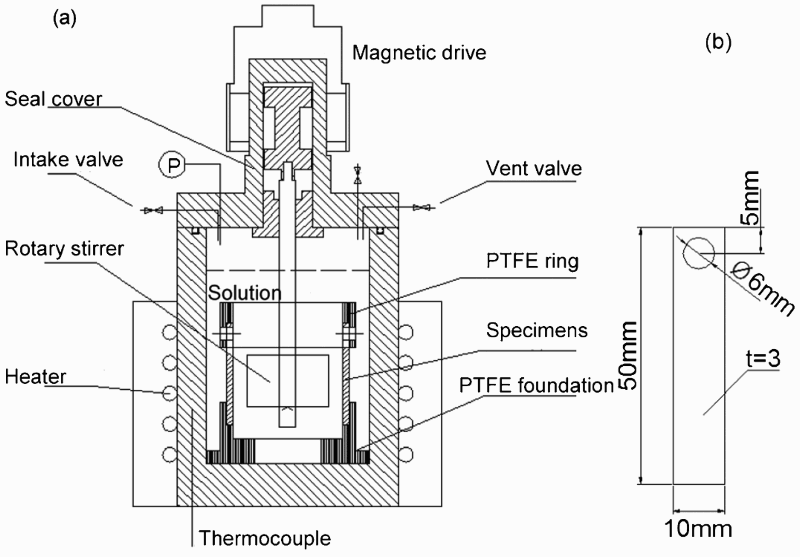
a high temperature and high pressure dynamic autoclave; b coupon specimen
Two parallel samples of each material were tested in the same condition. One specimen was used to calculate the average corrosion rate; the other one was used for morphology analysis.
After the experiment, weight loss specimens were rinsed with distilled water and corrosion scale was removed by Clark's solution. Then, the specimens were dried and photographed to record the corrosion status. Finally, the residual masses of the specimens were determined using an electronic balance (accuracy, 0·1 mg), and the average corrosion rate was calculated by the weight loss method. The analysed specimens were carefully wetted with deoxidised isopropanol and DI water without creating physical damage to the corrosion product. All samples are stored in a vacuum desiccator before and throughout the analysis process.
Surface analysis
Scanning electron microscopy (SEM) and energy dispersive spectrometer (EDS) were used to analyse the corrosion product layer, and profilometer was used to analyse the surface condition after removing corrosion product.
Results and discussion
Corrosion rate
General corrosion rates under different conditions are shown in Fig. 2, and the corresponding coupon pictures are shown in Fig. 3. In pure CO2 corrosion condition, the general corrosion rate is 1·15 mm/a. General corrosion was observed and no localised corrosion appeared in the coupon surface. Keeping the CO2 partial pressure constant, with increasing H2S partial pressure from 2 to 20 mbar, the general corrosion rates were decreased continuously. The surface condition became better than the pure CO2 corrosion. Some polishing gloss still can be seen after removing the scale. The minimum corrosion rate value appeared at a certain H2S partial pressure between 20 and 40 mbar. However, when the H2S partial pressure reached 800 mbar, the corrosion rate no longer was restricted by the adding H2S but accelerated 30% compared to the pure CO2 environment. General corrosion was observed as well, but the coupon surface changed from gloss to rough. Under the condition of 4000 mbar H2S, the same as CO2 partial pressure, the corrosion rate was almost twice of the pure CO2 condition. Severe localised corrosion (mesa attack) occurred.
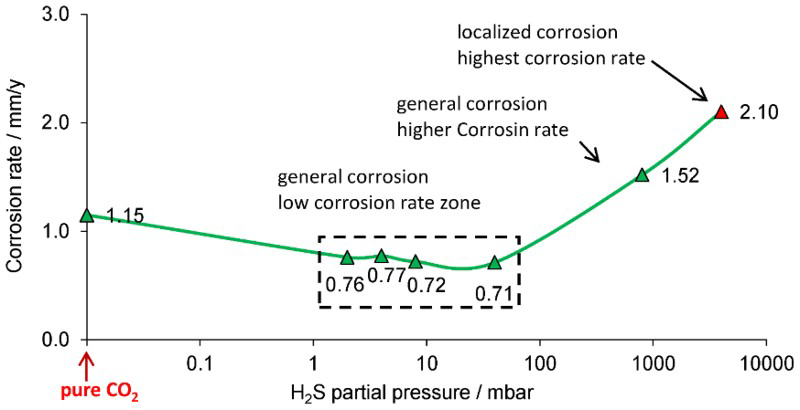
Corrosion rate versus pH2S (T = 90°C, pCO2 = 4·0 bar, 1·7 m s−1, 7 days)
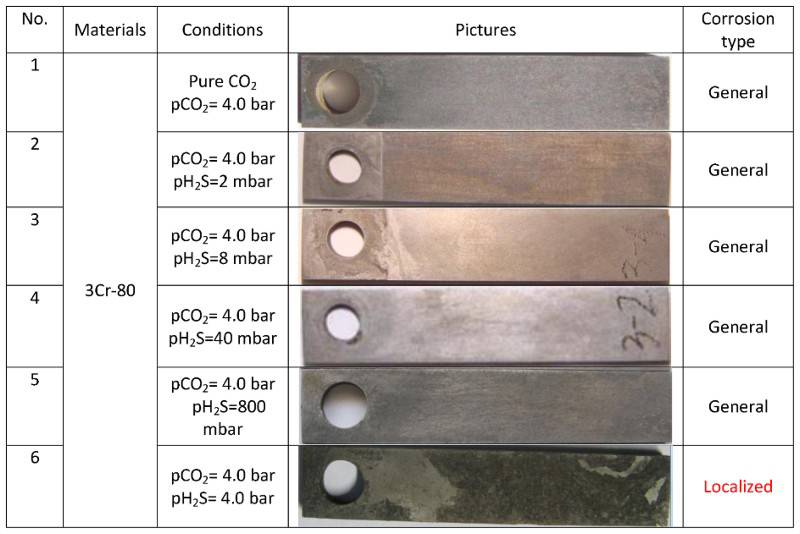
3Cr specimen pictures after corrosion product cleaning (T = 90°C, pCO2 = 4·0 bar, 1·7 m s−1, 7 days)
Corrosion product analysis
Surface morphology images of corrosion products were shown in Fig. 4. EDS analysis results were shown in Fig. 5. For pure CO2 corrosion (Fig. 4a), typical cubic FeCO3 grains were observed and the grains were distributed evenly. EDS data (Fig. 5a) show that a little CaCO3 also coexisted with FeCO3. Underneath these crystals, a Cr rich product layer could also be formed, which has a barrier effect on ion exchanging. 18 After very small amount of H2S added in the system, these cubic grains disappeared and some fluffy structure formed on the surface (Fig. 4b). Based on previous research, 9 this type of corrosion products could be fluffy mackinawite (FeS). According to the EDS analysis (Fig. 5b), FeS and FeCO3 should be coexisted. As the H2S partial pressure increases but <40 mbar, the fluffy mackinawite FeS was transferred into granular FeS gradually (Fig. 4c and d ). FeS and FeCO3 coexisted as well. However, when the H2S partial pressure reached 800 mbar (Fig. 4e), a density FeS grain layer was formed and some fluffy structure was formed on top of this FeS grain layer. According to the EDS analysis, almost all of the corrosion products are purely FeS and no C and O elements were detected (Fig. 5e). H2S corrosion dominated the corrosion process, and this type of sole FeS corrosion products cannot protect the surface well and a higher corrosion rate happened. A seriously localised corrosion happened in the final corrosion condition; a much higher H2S content (4000 mbar) induced product layer, generating an “internal stress” and then leading to film cracking (Fig. 4f); and severe localised attack occurred (Fig. 3, no.6). EDS data show that FeS2 formed under this condition (Fig. 5f). This type of corrosion products has the worst protectiveness.
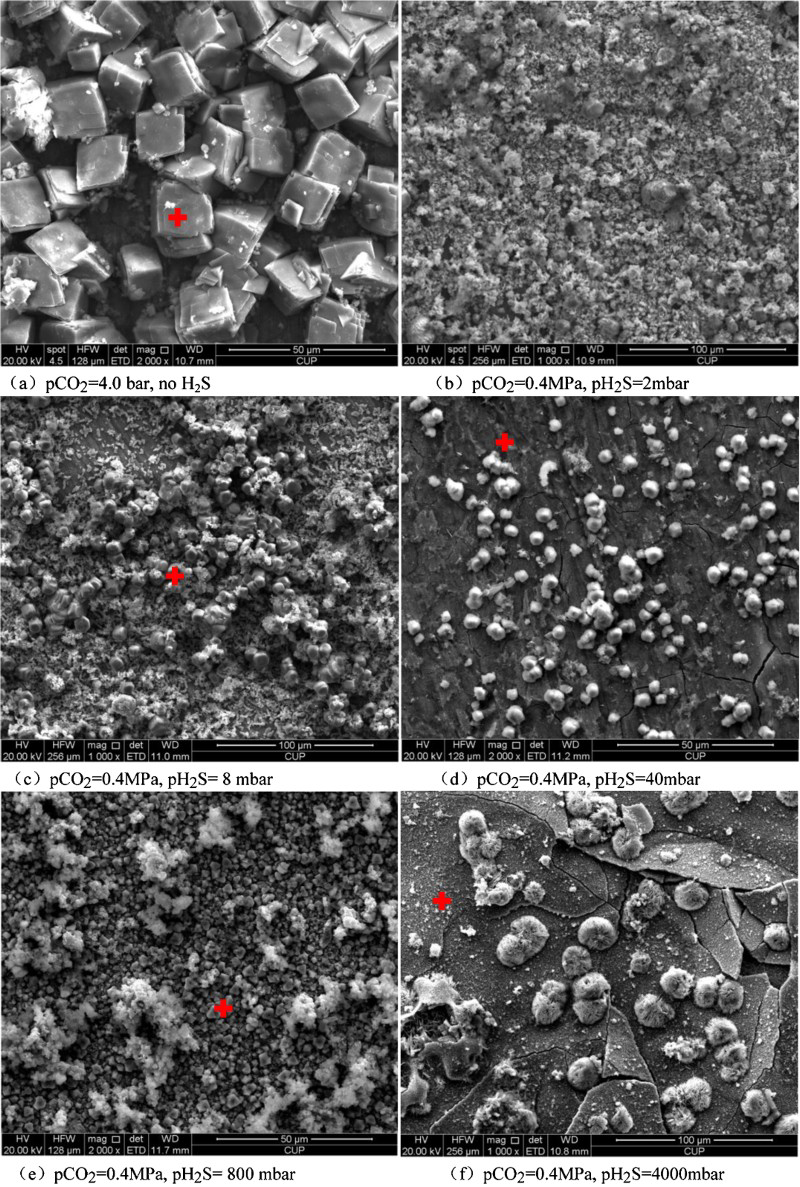
a pCO2 = 4·0 bar, no H2S; b pCO2 = 0·4 MPa, pH2S = 2 mbar; c pCO2 = 0·4 MPa, pH2S = 8 mbar; d pCO2 = 0·4 MPa, pH2S = 40 mbar; e pCO2 = 0·4 MPa, pH2S = 800 mbar; f pCO2 = 0·4 MPa, pH2S = 4000 mbar
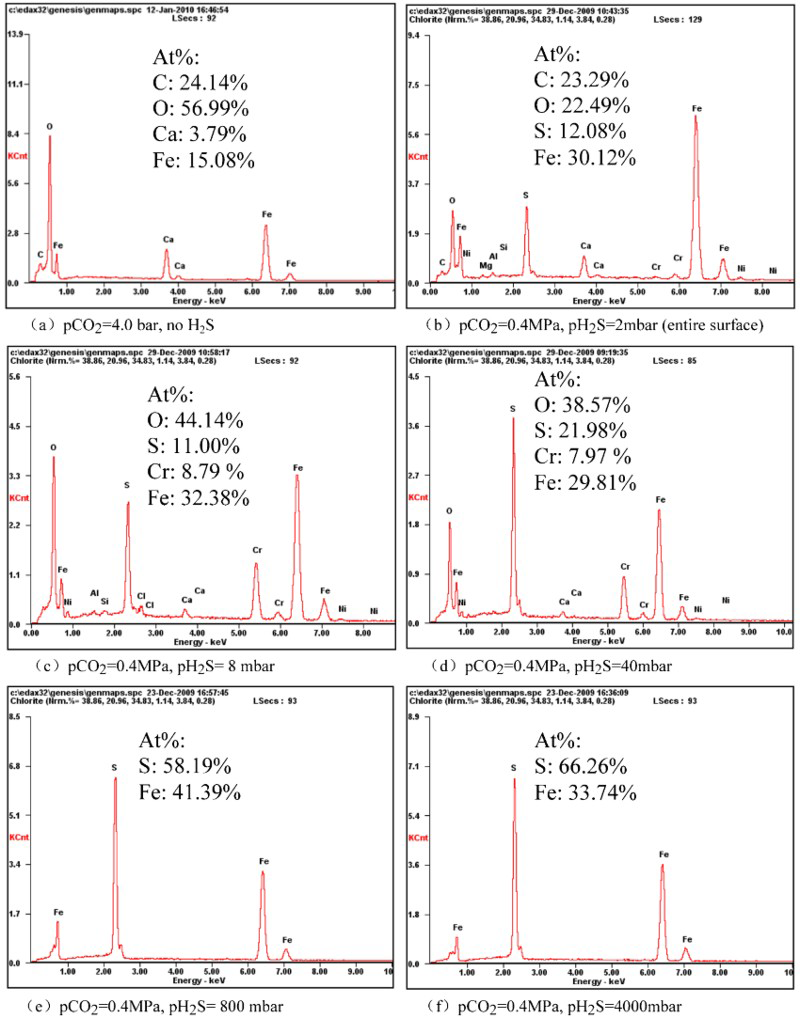
a no H2S; b pH2S = 2 mbar; c pH2S = 8 mbar; d pH2S = 40 mbar; e pH2S = 800 mbar; f pH2S = 4000 mbar
Sulphur element content (At%) in corrosion product layer that changed with H2S partial pressure is shown in Fig. 6. X-ray diffraction (XRD) analysis results are shown in Fig. 7. Sulphur content increased with the H2S partial pressure. When the H2S partial pressure are <40 mbar, the maximum sulphur content are <25%(At), FeCO3 and FeS coexisted (Fig. 7), and the trace amount of H2S restricted the CO2 corrosion (Fig. 2). Nevertheless, when the H2S partial pressure rises to 800 mbar, the products sulphur content exceeds 50%, FeS or FeS2 are the dominated corrosion products, and this type of product layers is less protective. In some circumstances, it will induce film cracking and lead to localised attack (Fig. 4f). It needs to be stressed that under the condition of 4000 mbar H2S, the product layer cracked seriously and parts of the layer fell off during the XRD sample preparation process, so the full surface XRD scanning pattern did not show a typical peak. It did not reflect the real crystal structure of the corrosion products. Fortunately, the EDS data clearly show that the atom ratio of S/Fe is quite closed to 2∶1 and FeS2 speculation is reasonable. Figure 8
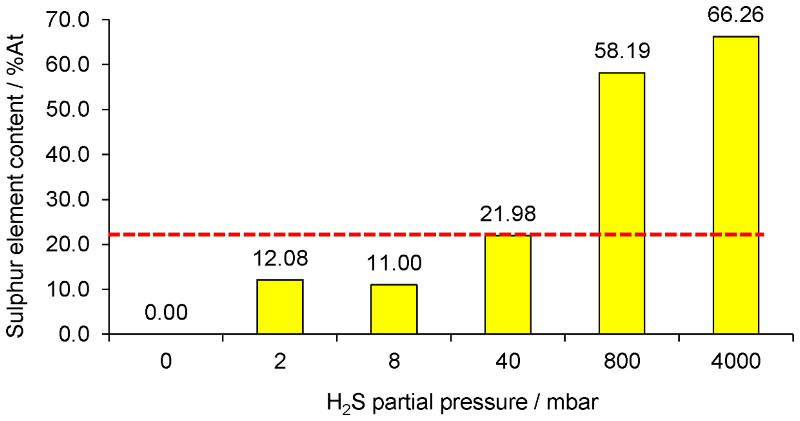
Comparison of sulphur element contents at different pH2S environment
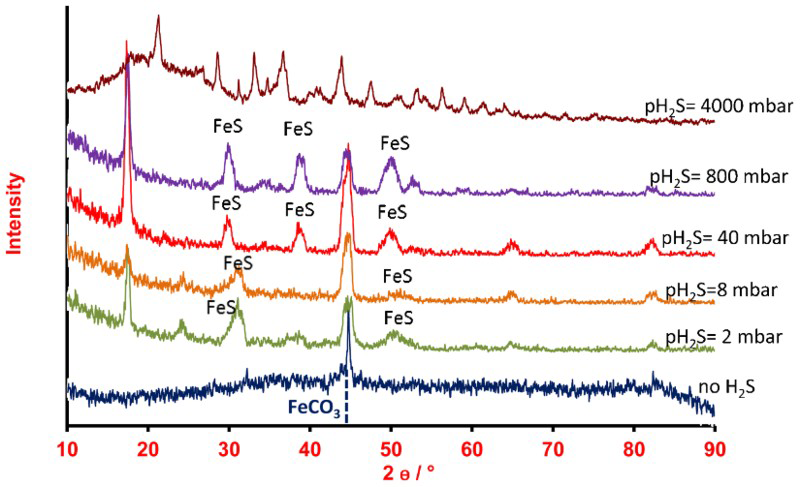
XRD patterns of 3Cr specimens at different pH2S
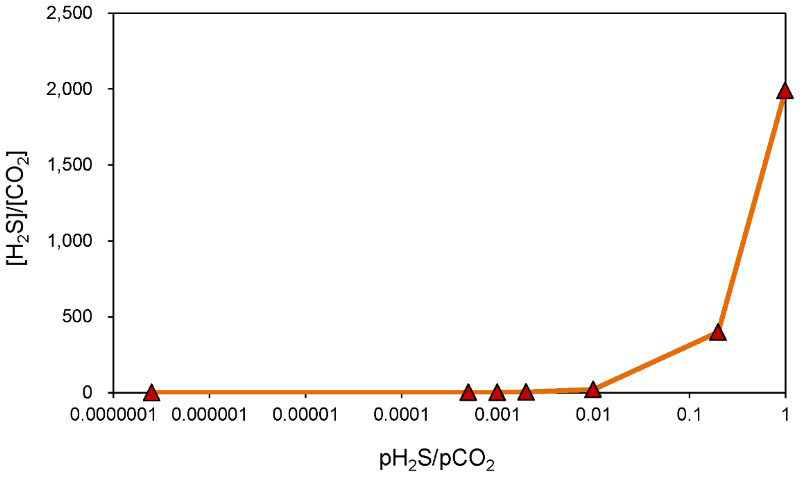
Concentration ratio of [H2S]/[CO2] that varied with partial pressure ratio of pH2S/pCO2 (90°C, pCO2 = 4·0 bar,1·7 m s−1,7 days)
Water chemistry analysis
Nordsveen et al. have published a series of influential papers to demonstrate the process of CO2 and H2S corrosion. 19 A brief introduction is summarised as follows.
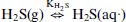
When CO2 is dissolved in water:


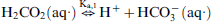

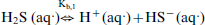
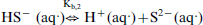
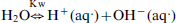
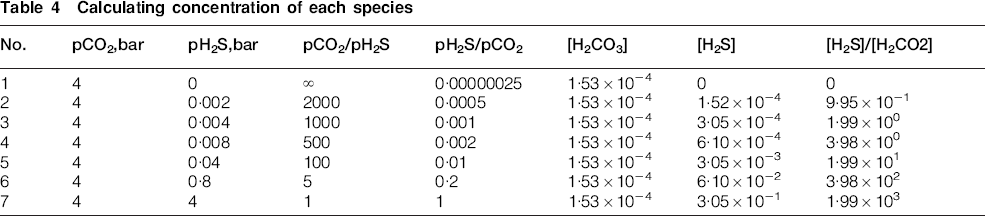
It is assumed that the direct reductions of H2CO3(aq.) and H2S(aq.) are dominantly reducing the reaction during the corrosion process. Many researchers hold this opinion. The concentration of this two main species is shown in Table 4, and the curve between concentration ratio of [H2S]/[CO2] and partial pressure ratio of pH2S/pCO2 is shown in Fig. 8. When the pH2S/pCO2 ratio is <1∶100, the concentration ratio of [H2S]/[CO2] is located in a low range and [H2S] is lower than [H2CO3] or they are at the same order of magnitude. Under this condition (H2S partial pressure are <40 mbar in Fig. 3), H2S will retard the CO2 corrosion and lower corrosion rates occurred compared to the pure CO2 corrosion; meanwhile, a better surface condition was obtained (Fig. 3, nos.2-4). However, when pH2S/pCO2 ratio reached 1∶5 (the partial pressure of H2S is 800∶mbar), [H2S]aq. is almost 400 times of [H2CO3]aq., and H2S no longer have the retardation effect on CO2 corrosion, but acceleration. Under this condition, H2S dominated the corrosion process and the mechanism is totally different from the previous one. Less protective sulphide film leads to a higher corrosion rate (Fig. 3). This situation became more serious when pH2S/pCO2 is equal to 1·0, pH2S = 4000∶mbar. Concentration of [H2S]aq. is almost 2000 times of [H2CO3]. H2S(aq.) reducing reaction dominated the corrosion system absolutely, and it can be considered as a pure H2S corrosion. The corrosion products will dominantly controlled the outward diffusion of Fe2+ and inward diffusion of [H2S]aq. under this condition. 20
Calculating concentration of each species
Conclusions
In a CO2 dominated corrosion environment, a trace amount of H2S (<40 mbar, pH2S/pCO2<1∶100) will decrease the CO2 corrosion rate in 3%Cr steel and the steel surface became better as well. However, when the H2S partial pressure increases to a certain value (800 mbar in this paper), the system will change from CO2 domination to H2S domination and the corrosion rates will increase compared to the pure CO2 corrosion.
A seriously localised corrosion happened when H2S partial pressure is 4000 mbar; a possible reason is that FeS2 product layer generates an “internal stress” and then leads to film cracking. This type of corrosion products has the worst protectiveness, and severe localised attack occurred consequently.
Because of the huge solubility difference of CO2 and H2S gas in brine water, 1∶500 of H2S partial pressure in CO2 can form the same order of magnitude of corrosion species H2S (aq.) and CO2 (aq.). When the partial pressure of H2S is 1∶5 of CO2, the concentration of H2S (aq.) is almost 400 times of H2CO3(aq.). H2S corrosion takes over the system domination, and corrosion mechanisms are totally different.
H2S not always restricts or accelerates CO2 in low alloy steel; it depends on the partial pressure of both corrosive gas and their ratios. Generally, it can be concluded that trace amount of H2S will retard CO2 corrosion and a much higher H2S will induce a seriously localised attack on low alloy steel.
Acknowledgements
The authors would like to acknowledge the support from the Institute for Corrosion and Multiphase Technology, Ohio University, USA, and the China National Offshore Oil Corporation Research Institute.