
Abstract
Corrosion behaviour of 304 austenitic stainless steel in simulated oilfield produced water at ∼25°C was investigated. The electrochemical properties of 304 stainless steel were assessed experimentally employing potentiodynamic polarisation and electrochemical impedance spectroscopy measurements. The corrosion mechanism of 304 stainless steel in simulated oilfield produced water along with appropriate modelling equivalent electrical circuits were deducted. Results showed that the corrosion rate is reduced with time. This behaviour does not indicate protection of 304 stainless steel. Instead, pits were formed on the surface of the specimens, and their evolution continued with time.
Introduction
Oil and gas production processes generate large volumes of liquid waste. Among these, oilfield wastewater or produce water contains various organic and inorganic components. 1 High salinity, CO2, acetic acid, volatile organic acids and petroleum hydrocarbons are some of the components that enhance the corrosion of metallic parts of an oilfield facility like pipelines, storage containers, etc.2,3 Carbon steels and stainless steels are used extensively in oil industries as construction materials for pipeline tubes, storage tanks, processing and reaction vessels, pumps, different types of fasteners and valves. Many researches show that carbon steels are susceptible to corrosion in oilfield wastewater environments. More particular, Zhang et al. 2 examined the behaviour of X65 carbon steel in simulated oilfield produced water showing that the corrosion rate of X65 carbon steel generally increases with rising temperature, acetic acid concentration and/or CO2 partial pressure. Zhang and Cheng3–5 also investigated the corrosion behaviour (localised corrosion) of X65 carbon steel in CO2 saturated oilfield formation water in the absence and presence of acetic acid using a number of electrochemical measurement techniques like potentiodynamic polarisation and electrochemical impedance spectroscopy (EIS). Furthermore, Jiang et al. 6 investigated the susceptibility of N80 steel to pitting corrosion in different CO2–CaCl2–NaCl aqueous solutions. Finally, Li et al. 7 examined the CO2 corrosion characteristics of N80 steel in stratum water with saturated CO2. More specifically, Li et al. 7 examined the microstructure and characteristics (protectiveness) of any formed corrosion products.
Although several investigations were performed on the corrosion behaviour of carbon steels in oilfield wastewater environments, no reports investigating the corrosion behaviour of stainless steels in simulated oilfield produced water are available. The aim of this work is to investigate the corrosion behaviour and evaluate the phenomenon through time, of a common austenitic stainless steel alloy like 304, 8 in a new proposed simulated oilfield produced water. For this purpose, electrochemical measurement techniques such as potentiodynamic polarisation and EIS were used. Based on the experimental results, equivalent electrical circuits were proposed, and the mechanism of corrosion of 304 stainless steel in the new proposed simulated oilfield produced water at ∼25°C was investigated. The analysis was made by relating different electrical circuit elements with electrochemical phenomena that occur during corrosion.
Materials and experimental procedures
Materials and solution
Commercial 304 stainless steel (UNS S30400) was used for this study with composition of Fe–0.08C–20Cr–2Mn–0.045P–0.003S–0.75Si–12Ni (wt-%). The steel was checked in accordance to ASTM standard A262 to verify if it was sensitised, with negative results.
9
Corrosion tests were performed on rectangular samples with a total exposure surface of 4 cm2, polished by silicon carbide (SiC) paper (120 grid), washed in distilled water and left to dry in air. The formation water in oil/gas production usually contains ions of Na+, K+, Mg2+, Ca2+, Cl− ,  and
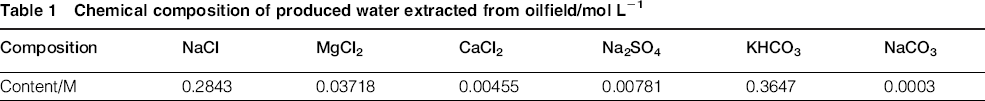
and  with or without the presence of acetic acid (C2H4O2).2,5 Based on this composition, a novel simulated oilfield produced water with no acetic acid and with relative small number of ingredients was prepared. The pH of this solution, measured with an electronic pH meter, was 7.8 ± 0.1. The overall chemical composition of the simulated oilfield produced water is shown in Table 1.
Chemical composition of produced water extracted from oilfield/mol L− 1
After corrosion tests, the corroded specimens were rinsed with distilled water, and the corrosion products were removed in accordance with ASTM G1-03 (2011) norm in order to investigate their microstructure. Optical microscopy was used to characterise the microstructure of the surface of the specimens after electrochemical measurements.
Electrochemical measurements
Polarisation measurements were used to monitor the electrochemical behaviour of 304 stainless steel. All electrochemical experiments were performed using a conventional three electrode cell containing the novel simulated oilfield produced water. Saturated calomel electrode (SCE) and platinum wire were used as reference and auxiliary (counter) electrode respectively. The experimental setup of the electrochemical corrosion apparatus was in compliance with ASTM G69-97 and ASTM G71-81 norms. All electrochemical measurements were carried out using Voltalab PGZ 402 advanced electrochemical system at room temperature (∼25°C). Before potentiodynamic polarisation and EIS measurements, the working electrode was immersed into the test solution at open circuit potential (OCP) for 30 min to attain a steady state condition. Potentiodynamic polarisation measurements were performed only the first day (0 day) of the experiments in the range of − 600 to +600 mV around OCP with a scanning rate of 0.5 mV s− 1. Corrosion current density values were estimated and normalised to the true surface area of each sample.
Electrochemical impedance spectroscopy measurements in the test solution were performed for a 5 day period according to the following schedule: 30 min (reported as 0 day), 24 h (1 day), 48 h (2 days), 72 h (3 days) and 96 h (4 days). Every 24 h, the test solution was replaced by a fresh one. Electrochemical impedance spectroscopy was carried out at OCP (E OCP) in the frequency range of 0.01 Hz–4 kHz using a 10 mV peak to peak voltage excitation. The EIS results were normalised to the true surface area of each sample. Tests were repeated three times to ensure reproducibility. The corresponding mean values were used in the relative diagrams. Polarisation curves and EIS results were analysed using Voltamaster 4 and EIS Spectrum Analyser 1.0 program (using Powell's algorithm) respectively.
Results and discussion
Electrochemical measurements
Open circuit potential and potentiodynamic curves
The OCPs of 304 stainless steel in the novel simulated oilfield produced water measured for 5 days are shown in Fig. 1. OCP measured for a time period of 30 min (Fig. 1) stabilises (E ocp) after ∼10 min. Specifically, OCP shows a relative small decrease of ∼35.5 mV [from − 499 to − 534.5 mV(SCE)] after 1 day of immersion in test solution due to the formation of passive thin films on the surface of the specimens. For the rest of the experimental period (days 2-4), OCP decreases in the beginning by a very small amount of ∼21.5 mV and then remains almost stable with values laying between about − 508 and about − 520 mV(SCE). This stability is related with a seamless formation of passive films with respect to the formation of metastable pits and/or of pits on the surface of the specimens.
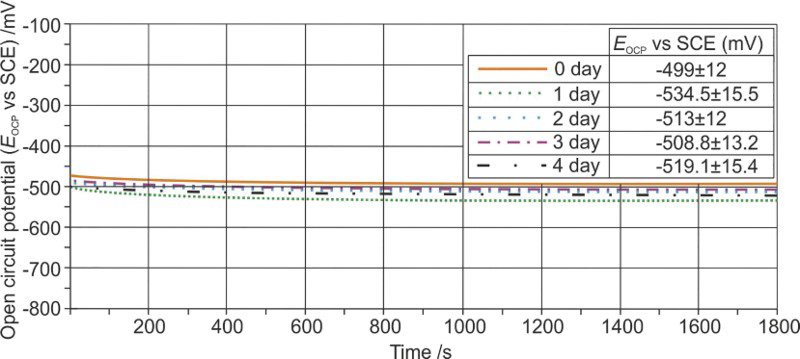
Open circuit potential E cor curves and their values of 304 stainless steel for each day of 5 day experimental measuring period as function of time (30 min OCP measuring time in simulated oilfield produced water solution at ∼25°C)
The potentiodynamic polarisation diagram of 304 stainless steel in simulated oilfield produced water under investigation at 0 day (30 min) is presented in Fig. 2. The current density values are normalised to the true surface area of the sample. As shown in Fig. 2, the corrosion potencial (E corr) of stainless steel is − 458 mV(SCE), and the corrosion curreent (i corr) is 16.4 × 10− 6 A cm− 2. This value of i corr was estimated by taking into consideration several zones from 50 to 200 mV to optimise the fitting of the Tafel slope. Three regions are evident in the cathodic part. The first one (Fig. 2, region A) is related to activation polarisation probably due to the reduction of dissolved oxygen, and the second one (Fig. 2, region B), in more electronegative values, is correlated to the diffusion controlled cathodic reactions (concentration polarisation) where a limited value of i is reached. Eventually, a new reaction, possibly the evolution of hydrogen, becomes operative (Fig. 2, region C).
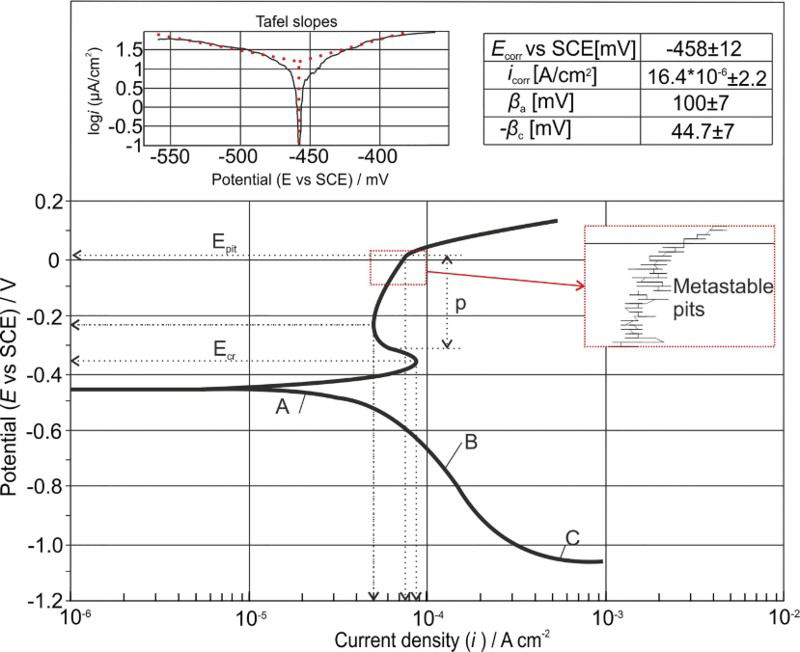
Potentiodynamic polarisation curve of 304 stainless steel immersed in simulated oilfield produced water solution at ∼25°C (0 day) (E cr: critical ‘passivation’ potential for stage p; E pit: pitting potential); current density values are normalised to true surface area of sample
In the anodic section of the polarisation curve (Fig. 2), active dissolution stops at a critical ‘passivation’ potential E cr of − 350 mV(SCE) with a current density of i cr = 8.7 × 10− 5 A cm− 2. After E cr, current density decreases, and as observed in Fig. 2, the potential range of − 310-35 mV(SCE) (p) lies in a passive-like region (current remains in the same order of magnitude as i cr). 10 Current density starts again to increase at − 230 mV (SCE) from 5 × 10− 5 to 7.6 × 10− 5 A cm− 2 at 35 mV (SCE) (Fig. 2). The potential − 230 mV (SCE) can be considered as the onset of passive film breakdown where the passive film starts to change, 11 and the stability of metastable pits (illustrated as small current density variations in Fig. 2) increases leading to the formation of pits. Beyond pitting potential [E pit, 35 mV(SCE)], current density increases significantly as a consequence of pit formation on the surface of 304 stainless steel specimens.
Electrochemical impedance spectroscopy analysis
Nyquist and Bode plots as well as the total impedance–frequency plots offer valuable information on the general behaviour of the materials and on the progress of the corrosion phenomenon even at early stages of corrosion. 12 Figures 3–5 show Nyquist diagrams, Bode plots and total impedance–frequency curves respectively for 304 stainless steel obtained after 30 min (0 day), 24 h (1 day), 48 h (2 day), 72 h (3 day) and 96 h (4 day) of immersion in simulated oilfield produced water solution at ∼25°C.
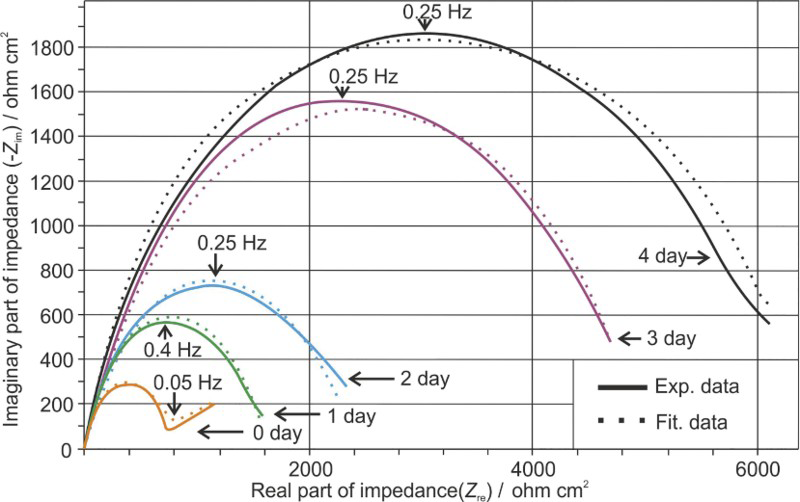
Nyquist plots for 304 stainless steel obtained after 30 min (0 day), 24 h (1 day), 48 h (2 days), 72 h (3 days) and 96 h (4 days) of immersion in simulated oilfield produced water solution at ∼25°C. Z im and Z re are the imaginary part and the real part of complex number normalised to true surface area of each sample respectively
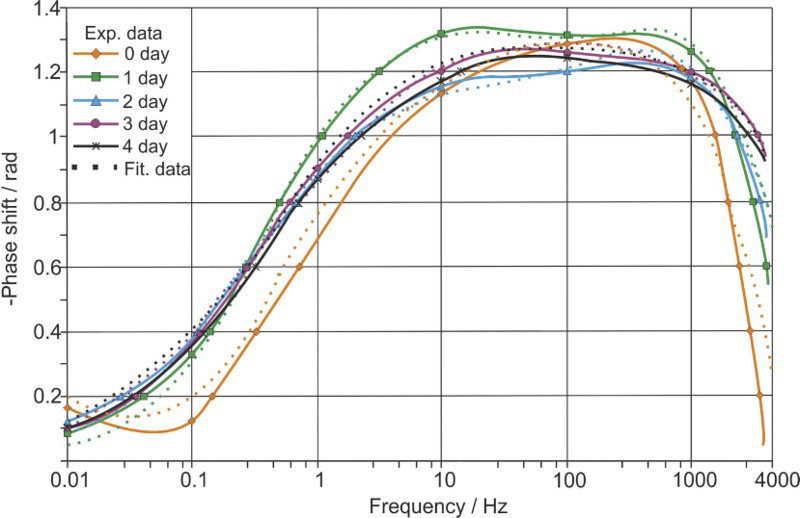
Bode plots for 304 stainless steel obtained after 30 min (0 day), 24 h (1 day), 48 h (2 days), 72 h (3 days) and 96 h (4 days) of immersion in simulated oilfield produced water solution at ∼25°C
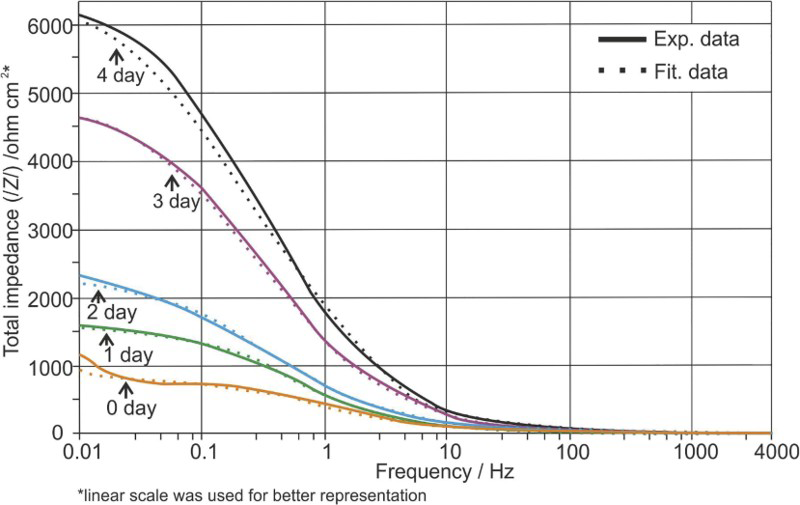
Total impedance–frequency plots for 304 stainless steel obtained after 30 min (0 day), 24 h (1 day), 48 h (2 days), 72 h (3 days) and 96 h (4 days) of immersion in simulated oilfield produced water solution at ∼25°C. Where /Z/ is the impedance metre of complex number normalised to true surface area of each sample
Nyquist plot at 0 day (Fig. 3) shows a not perfect semicircle (attributed to the frequency dispersion) at high frequency range, which ends at low frequency range to a straight line, which is characteristic of reactions controlled by ion diffusion. 12
The spectra recorded after 0 day of immersion in simulated oilfield produced water solution (1-4 days) show a remarkable increase in the diameter of the not perfect semicircles and the absence of a straight line at a low frequency range (Fig. 3). These changes are related with the change in nature of the corrosion behaviour. The absence of a straight line at low frequencies (1-4 days) is characteristic of reactions not totally controlled by ion diffusion,
12
while the increase in the overall impedance values is related to the decreasing of the corrosion rate.
13
This decrease in the corrosion rate by the increase in the overall impedance can be explained by taking into account that:
the increase in overall impedance values with time are generally related with the interfacial (solution/metal interface) charge transfer reactions; thus, the increase in the overall impedance is related with existing charge transfer resistance of the solution/metal interface area (corrosion rate is proportional to charge transfer resistance)4,14 the presence growth of a reaction product layer (a ‘protective’ film) that continuously improves the corrosion resistance of the material.
6
Bode plot at 0 day (Fig. 4) shows one clear time constant at ∼200 Hz, while for 1-4 days, a second time constant appears as well. The presence of two time constants indicates the formation of a reaction product layer on the test piece's surface.
12
Bode plots and total impedance–frequency plots (Figs. 4 and 5) show three features in the analysed frequency range. These are associated with the development of localised corrosion by pitting (kHz domain), the overall corrosion rate (Hz domain) and the adsorption of intermediate corrosion products (mHz domain).13,15 The slope of the total impedance–frequency curve (Fig. 5) at 0 day at low frequencies (0.02 Hz) shows a constant increase in the impedance reaching a dc limit. This constant increase in impedance at low frequencies is an indication of diffusion controlled electrochemical reactions and of the commencement of pitting corrosion on the surface of the specimen.
16
The impedance at low frequencies rapidly increases with the days of immersion (days 1-4) reaching a clear dc limit ranging from ∼1600 Ω cm+ 2 (1 day) to ∼6000 Ω cm+ 2 (4 days) (Fig. 5). The presence of a clear dc limit may indicate a complete lack of diffusion mechanism and mitigation of pitting corrosion.17–19 Furthermore, at frequencies over 10 Hz, the impedance reaches zero for all the experimental days (Fig. 5).
In order to evaluate the EIS results, theories related to the corrosion behaviour of stainless steel in environments containing Cl− and/or  and/or
  that can become
  ions according to the equilibrium reaction
  = H++
= H++  , must be taken into consideration.
Stainless steels, in general, owe their corrosion resistance to a thin protective film formed on the surface with limited ionic and electronic conductivity. 11 As Freire et al. reported, 20 despite the increased corrosion resistance of stainless steel, these alloys are susceptible to pitting in the presence of chlorides. This behaviour is associated with the process of continuous dissolution and/or regeneration of passive films and with continuous diffusion of Cl− ions from the solution to the pits. 21
Furthermore,  and
and  can be related to the formation of oxides (e.g. Fe2O3, Cr2O3) or iron carbonates scale (e.g. FeCO3) on the surface of stainless steel.3,4,22,23 Apart from the presence of iron oxides, carbonates such as CaCO3 and MgCO3 may be formed in the solution due to the relative high pH of the experimental medium (∼7.8).
5
In general, the simulation of EIS experimental data with equivalent electrical circuits and its physical interpretation is still a controversial matter, due to the different models suggested in the literature even for the same material at similar conditions.
20
In any case, the aim of these models is to relate different electrical circuit elements to the electrochemical phenomena that occur at each one of the existed or formed interfaces (metal/‘double’ layer/solution) allowing a better understanding of the corrosion mechanism.
can be related to the formation of oxides (e.g. Fe2O3, Cr2O3) or iron carbonates scale (e.g. FeCO3) on the surface of stainless steel.3,4,22,23 Apart from the presence of iron oxides, carbonates such as CaCO3 and MgCO3 may be formed in the solution due to the relative high pH of the experimental medium (∼7.8).
5
In general, the simulation of EIS experimental data with equivalent electrical circuits and its physical interpretation is still a controversial matter, due to the different models suggested in the literature even for the same material at similar conditions.
20
In any case, the aim of these models is to relate different electrical circuit elements to the electrochemical phenomena that occur at each one of the existed or formed interfaces (metal/‘double’ layer/solution) allowing a better understanding of the corrosion mechanism.
In regard to the corrosion of 304 stainless steel in different environments, few proposed equivalent electrical circuits can be found in the literature.20,21,24–26 Based on the resulted impedance curves (Figs. 3–5) and the previous discussion, two equivalent circuits (Fig. 6) were chosen in order to describe the early stages (0 day) and the evolution of corrosion through time (1-4 days) of 304 stainless steel in the simulated oilfield produced water. These equivalent circuits seem to offer the most coherent physical interpretation of the results.
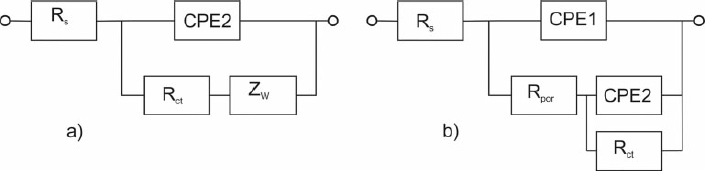
Equivalent electrical circuit representing corrosion behaviour of 304 stainless steel after a 30 min (0 day) and b 1-4 days of immersion in simulated oilfield produced water at ∼25°C
The adopted equivalent circuit for the 0 day (Fig. 6a) consists of the following:
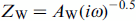
the resistance R s of electrolyte solution a charged transfer resistance R ct, which characterises the polarisation of the 304 stainless steel solution due to the formation of the electric double layer on the interface between the 304 stainless steel and the solution an impedance Z CPE2 of a constant phase element CPE2, which characterises the capacitance contribution C dl of the formed electric double layer on the interface between the 304 stainless steel and the solution a Warburg resistance Z w related to the diffusion of the oxidants–ions to the electric double layer on the interface between the 304 stainless steel and the solution.
The impedance of the constant phase elements can be expressed by equation (1)
12

For days 1-4, the equivalent circuit (Fig. 6b) was chosen in order to explain both the formation of solid products (e.g. oxides, carbonates) on the surface of the specimens (passivity behaviour) as well as the corrosion activity of the 304 stainless steel with the solution on anodic (usually uncovered) areas.
The equivalent circuit consists of the following:
the resistance R s of electrolyte solution an impedance Z CPE1 of the constant phase element CPE1 that characterises the capacitance C C of the formed solid products on the surface of the 304 stainless steel a solution resistance R por within a formed pit due to solid product dissolution a charged transfer resistance R ct, which characterises the polarisation of the 304 stainless steel solution due to the formation of an electric double layer inside metastable micropits or pits an impedance Z CPE2 of the constant phase element CPE2 that characterises the capacitance contribution C dl of the formed electric double layer on the interface between 304 stainless steel and the solution inside the pits.
The parameters of the equivalent circuit elements of Fig. 6 after analysing a considerable amount of fitted spectra are listed in Table 2. Besides, as shown in Figs. 3–5, the fit between Bode and Nyquist plots are well adjusted to the proposed equivalent electric circuit, demonstrating a good agreement between the experimental and simulated data (calculated standard error < 10%). Finally, the variation with time (0-1 day) of the values of the most significant electrical elements, from Table 2 (R por, R ct, CPE1 and CPE2), is illustrated in Fig. 7.
Parameters of equivalent circuit elements (Fig. 6) representing corrosion behaviour of 304 stainless steel after 30 min (0 day) and 1-4 days of immersion in simulated oilfield produced water at ∼25°C*
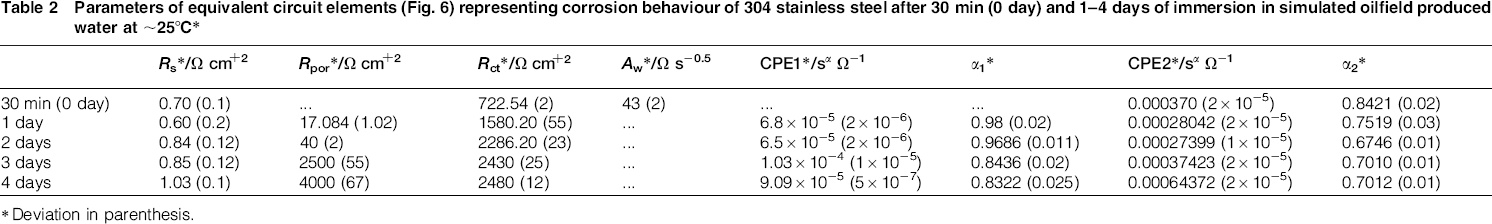
* Deviation in parenthesis.
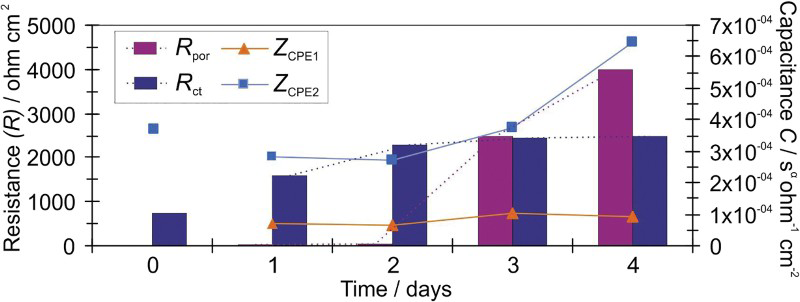
Differences between parameters of equivalent circuit elements representing corrosion behaviour of 304 stainless steel after 30 min (0 day) and 1-4 days of exposure in simulated oilfield produced water at ∼25°C
As shown in Fig. 7, R por increases significantly after the second day of immersion in the electrolytic solution (three orders of magnitude), whereas R ct increases almost linearly for the first 3 days (0-2 days) of immersion in electrolytic solution reaching a relative steady value ∼2480 Ω cm+ 2 in a 1 day period. In addition, there is a rising trend of the impedance Z CPE2 of the constant phase element CPE2 in terms of capacitance C dl after the second day of exposure in electrolytic solution, whereas the impedance Z CPE1 of the constant phase element CPE1 in terms of capacitance C C is relatively stable with time.
According to the proposed equivalent circuits (Fig. 6) and the values of their parameters (Table 2 and Fig. 7), the corrosion mechanism of 304 stainless steel in simulated oilfield produced water varies with time as illustrated in Fig. 8.
After 30 min (0 day) of immersion, carbonates like FeCO3 and oxides like Fe2O3 and Cr2O3 will start to form on the surface of the specimens. Furthermore, there are areas (e.g. inhomogeneities, small cavities, due to the roughness of the samples) that form active regions where metastable micropits will occur due to the reactions of iron (Fig. 8a).6,27 The formation of carbonates and oxides on the surface of the specimens at the initial stage of the exposure may be porous, thin and rather inhomogeneously distributed. Thus, their resistance is much smaller than the charge transfer resistance R ct (Fig. 7). This can explain the absence of second CPE at the proposed equivalent circuit (Fig. 6a), which is in agreement with the no clear appearance of the second time constant in the EIS Bode plot (Fig. 4).12,27 In any case, any electrochemical reaction of the 304 stainless steel corrosion at 0 day is related to the early stage of evolution and is controlled by ion diffusion. This is also supported by the divergence of coefficient α2 from the value 1 (Table 2), indicating a lack of stability of the formed electric double layer, which can be attributed to the presence of reaction products that affect the evolution and stability of metastable pits.
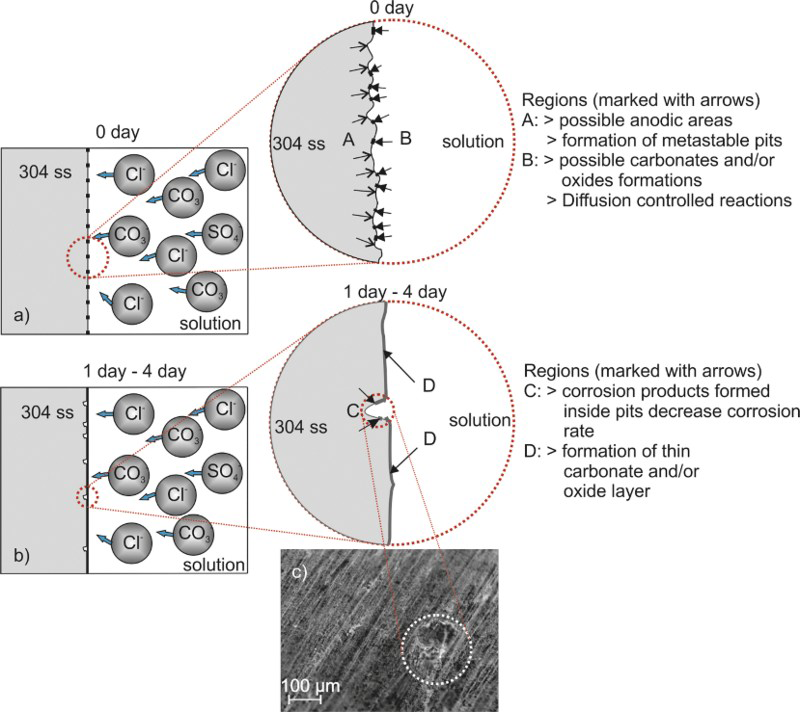
a initial diffusion controlled reactions, formation of metastable pits; b gradual evolution of pits; c pit on 304 stainless steel after 5 days of exposure in solution and after removal of corrosion products (optical microscopy)Schematic representation of corrosion behaviour of 304 stainless steel in simulated oilfield produced water at ∼25°C based on proposed equivalent electrical circuits through time
Following the 1 day immersion, a relative stable layer of corrosion products is formed on the surface of the specimens (Fig. 8b). In addition, pits have just begun to form, with no record of intense ion diffusion (Fig. 6b, absence of diffusion resistance). This is due, most probably, to the local gradual degradation of the formed ‘protective’ film that do not allow halide ions to move freely to the metal surface. 12 The relative homogeneity of this layer is confirmed by the minimal divergence of coefficient α1 from the value 1 (Table 2), whereas the divergence of coefficient α2 from 1 (Table 2) indicates a lack of stability of the electric double layer formed inside the pits. This may be due to the presence of reaction products inside the pits and/or the deposition (Fig. 8) of products such as CaCO3 and MgCO3. In a later period of time (2-4 days), Z CPE1 of the CPE1 time constant element remains almost constant (Fig. 7), whereas the value of α1 coefficient decreases slightly (Table 2). CPE1 time constant element is related to the stability of the ‘protective’ film formed on the surface of the specimen and to the area that covers. 20 The reduction of the coefficient α1 indicates that the stability of the surface films decreases with time leading to breakdown. It should be mentioned that carbonates like FeCO3 are usually less stable than oxides like Cr2O3. 27 Furthermore, as the number of pits increases with time, the areas that the protective film covers are reduced. These factors cancel the possible increase in the size of the pits and consequently the increase in Z CPE1 impedance. Z CPE2 impedance is strictly connected with the active part of the surface area inside an active pit. 20 The increase in this parameter through time especially after 2 days of exposure (Fig. 7) is related to the increase in the active area and consequently to the growth of active pits. The divergence of coefficient α2 from value 1, for the time period of 1-4 days (Table 2), indicating a lack of stability of the electric double layer formed inside the pits, may be due to the presence of reaction products inside the pits. As already has been mentioned, R por and R ct resistances increase with time so the corrosion rate shall decrease, but the evolution of pits does not stop. The equivalent circuit of Fig. 6b shows this trend. For the first 3 days of exposure (Fig. 7), R por resistance is comparatively much smaller than the charge transfer R ct resistance indicating that the interfacial properties of 304 stainless steel solution inside pits play a dominant role in the evolution of corrosion. 12 The increase in the R ct resistance is related to ‘protective’ species that partially block the active areas inside and around the pits (Fig. 8b). These ‘protective’ species most likely are chromium oxides or hydroxides since Cr is more stable than Fe. 20 After the second day of exposure, R por increases significantly and becomes dominant due to the continuous dissolution of the ‘protective’ species inside the pits that eventually block the pit lips. Finally, Fig. 8c shows a pit on 304 stainless steel after 5 days of immersion in simulated oilfield produced water at ∼25°C (corrosion products were removed), which indicates that pits were formed on the surface of the specimens and continued to evolve over time.
Conclusions
Potentiodynamic polarisation showed a passive-like behaviour with the formation of metastable pits that eventually transform to pits. Electrical models simulating the corrosion mechanism both at early stages as well as with the progress of corrosion with time in the novel solution were proposed. Corrosion mechanism of 304 stainless steel in the novel simulated oilfield produced water was determined. Solid products and metastable micropits are formed in the early stage, and stable pits appear subsequently. Corrosion rate is directly related to the solution resistance inside the pit and to the formation of film on SS304. The evolution of pits does not stop with the formation of film and the increase in the solution resistance within the pit.