
Abstract
The present paper assesses the ultimate bending moment of steel box girders subjected to intensive non-uniform corrosion degradation. A comparison between the experimental results of three corroded box girders and different existing formulations has been performed. The moment–curvature relationship for the three corroded box girders has been calculated using the Common Structural Rules iterative process and the finite element method, leading to a development of corrosion scale factors to account for both geometrical and mechanical properties changes. Based on the experimental results, a relationship has been developed to calculate the equivalent Young's modulus of corroded structures as a function of the total reduction in cross-sectional area. A systematic procedure for the application of the newly developed fast approach and the new equivalent Young's modulus has been presented that can be used for any ultimate bending moment–curvature calculation tools.
List of symbols
 ,
,  ,
,  and
and 
total sectional area of the deck, outer bottom, inner bottom and side shell respectively

reduction in the net sectional area of the structural part under compression

difference between the calculated and experimentally defined ultimate bending moments

hull depth

normalised Young's modulus

transition function

neutral axis position above the baseline in the sagging condition

depth of the hull section in a linear elastic state

function of the ratio of the areas of the one side shell to the compression flange
 and
and 
corrosion scale factors

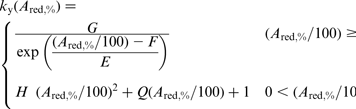
plastic bending moment

slope coefficient of the linear trend of the moment–curvature relationship

elastic section modulus at the compressed flange

plate slenderness

ultimate buckling strength of the compressed flange
 ,
, 
ultimate buckling strength for deck and side
 ,
,  and
and 
yield strength of outer bottom, inner bottom and side respectively

column slenderness
Introduction
The ultimate strength of the entire structure and its components represents a real measure of strength in the sense that the ultimate strength is the maximum capacity that they can sustain. Furthermore, the global behaviour of the structural components is important for the structural integrity assessment. Often, box girder structures are used to simulate a mid-ship section model of ship hull structures and to analyse it experimentally against compressive loads. Previous studies on the development of different fast approaches for predicting the hull ultimate strength may be classified into three groups.
The first one is a linear approach where the behaviour of the structure up to collapse of the compression flange is assumed to be linear elastic without buckling, and the ultimate moment capacity of the hull is expressed as the ultimate strength of the compression flange multiplied by the elastic section modulus with a simple correction for buckling and yielding.1–4 This approach is quite simple, but its accuracy may not be good because after the buckling of the compression flange, the behaviour of the structure is no longer linear and the elastoplastic neutral axis changes its position.
The second group of approaches includes empirical ones, where an expression is derived based on experimental or numerical data from scaled hull models. Empirical formulas may provide reasonable solutions for conventional hulls, but one has to be careful in using empirical formulas for new or general type hulls since they are derived based on limited data.5,6
The third group of approaches is the analytical one, which is based on an assumed stress distribution over the hull section, from which the moment of resistance of the hull is theoretically calculated, taking into account buckling in the compressed flange and yielding in the tension flange. The analytical derivation of a hull ultimate strength formula taking into account buckling in compression and yielding intension was first proposed by Caldwell, 7 after that the method has been modified by Paik and Mansour 8 and Paik et al. 9 After that, the formula has been modified by Paik et al. 10
To simulate the progressive collapse of the hull girder, many approaches and methods have been proposed in the last decades. Smith 11 proposed a simplified method, which is now commonly called Smith's method. This method enables to perform progressive collapse analysis on the cross-section of a hull girder subjected to longitudinal bending. The cross-section is divided into small structural elements composed of stiffener with attached plating. At the beginning, the average stress–strain relationship of any individual structural element is derived under the axial load considering the influences of yielding and buckling. Then, a progressive collapse analysis is performed assuming that a plane cross-section remains plane and each structural element behaves according to its average stress–strain relationship.
Dow et al. 12 developed an incremental curvature procedure that defines a moment–curvature relationship for a complete hull. This procedure was calibrated with experimental data derived from collapse tests on three box girders and ultimate longitudinal strength test carried out on the destroyer ALBUERA, which was a riveted ship. Yao and Nikolov 13 developed a progressive collapse method taking into account the flexural torsional behaviour of angle bar stiffeners welded to continuous plating. A series of elastoplastic large deflection analyses have also been performed. A large scale frigate model was analysed using the developed code HULLST. Gordo et al. 14 developed a method to estimate the ultimate moment based on a simplified approach moment based on the behaviour of stiffened plate columns.
The International Association of Classification Societies 15 introduced a simplified approach for calculating the ultimate strength of the intact ship structure based on an incremental–iterative approach. The hull girder transverse section is divided into structural elements, that is, stiffeners with attached plates and hard corners.
Experimental results provide first hand information for understanding the collapse behaviour of ship structures; therefore, intensive work has been carried out to simulate the behaviour of ship hull by box girders loaded up to its ultimate strength limit. The box girders have been designed to reproduce the behaviour of the ship's structure subjected to bending moment. The typical elements of box girders are plates with a bar stiffener, which have been proved to be a good replica of the mid-ship hull structure.
For intact box girders, several tests have been carried out by many authors.16–19
Materials commonly used for marine structures comprise carbon and low alloyed steels. In a sea water environment, they are affected by corrosion, which is one of the most important factors influencing the structural capacity during the structure service life.
Two main corrosion mechanisms are generally present in steel plates: general wastage that results in a generalised decrease in plate thickness and localised one, which generally consists of local areas of extensive and deep damage.
Several traditional models that assume a constant corrosion rate, leading to a linear relationship between corrosion thickness and time, have been developed by Hart et al., 20 Guedes Soares, 21 Shi, 22 and Guedes Soares and Garbatov. 23 However, experimental evidence of corrosion kinetics, reported by various authors, shows that a non-linear model is more appropriate. Southwell et al. 24 observed, in data collected under tropical conditions, that the wastage increases non-linearly in a period of 2 to 5 years of exposure, but afterwards becomes relatively constant. This means that after an initial non-linear corrosion transient, the oxidised material (i.e. rusts) that is produced remains on the surface of the plate and provides an element of barrier protection to the plate surface by restricting access to the corrosive environment.
Melchers25,26 has proposed a more refined phenomenological model incorporating aspects of earlier models and achieving mathematical consistency. The model divides the corrosion process into three stages: initial corrosion, oxygen diffusion controlled by corrosion products and micro-organic growth and limitation on food supply for aerobic and anaerobic activities. The model has been developed from different types of laboratory and full scale corrosion data, explaining the corrosion mechanisms than being a practical prediction tool.
Another model has been proposed by Yamamoto and Ikegami 27 for a localised corrosion mechanism supported by extensive plate thickness measurement data. In this model, the corrosion and wear seen in structural members are assumed to be the consequence of an extremely large number of generated progressive local corrosion sites, each of which grows individually.
Guedes Soares and Garbatov28,29 and Garbatov et al. 30 proposed a non-linear corrosion model that describes a non-linear increase in corrosion as a function of time in three phases; in the first phase, there is no corrosion because the protection of the metal surface (generally an organic coating) works properly. The second phase is initiated when the corrosion protection is damaged and corresponds to the start of corrosion, which decreases the thickness of the plate. The third phase corresponds to a slow increase in corrosion damage, and the last one corresponds to a reduction in the corrosion process when the corrosion rate becomes almost zero. This model has been validated with corrosion data from tankers. 30 Paik et al. 31 suggested that the corrosion behaviour could be categorised into several phases. The coating life is assumed to follow the log normal distribution with the transition time considered to be exponentially distributed random variable.
Qin and Cui 32 proposed a model in which the coating protection system was assumed to deteriorate gradually and the corrosion may start as localised attack before the coating protection system loses its complete effectiveness.
The corrosion rate was defined by equating the volume of localised corrosion to uniform corrosion. The models of corrosion wastage, referred up to now, assumed time as a unique parameter and defined various corrosion phases. However, to improve the corrosion models, it is necessary to not only account for time but also include contributing variables. Several environmental factors have been identified as important for the corrosion wastage of steel structures and have been taken into account in the corrosion model.33–35
For corroded structures, that is, box girders, limited tests have been performed up to the moment. Saad-Eldeen et al. 36,37,38 carried out a series of ultimate strength tests of aged steel box girders subjected to different corrosion degradation levels. The box girders were subjected to four-point loading, resulting in a uniform bending moment along the specimens. The experimental results and the collapse modes have been analysed, and the expected global deformation shape and strength capacity were confirmed as a result of corrosion deterioration. Corrosion thickness measurements have been performed, and the corrosion wastage has been fitted to the non-linear time variant degradation model. The behaviour of the three tested corroded box girder specimens has been analysed with respect to collapse modes, strain measurements, residual stresses, load–displacement and moment–curvature relationships in Ref. 39.
A corrosion dependent analysis of the ultimate strength analysis of the corroded steel box girders based on experimental results has been performed. 40 Two corrosion dependent formulas for assessing the ultimate strength as well as the ultimate bending moment of corroded structures were proposed. Using a time dependent corrosion growth model, equivalent time dependent formulations were developed. The effect of corrosion degradation on the residual stresses during the service life was also analysed, and a regression equation for predicting the remaining residual stresses along the service life was proposed. Finally, a corrosion dependent moment–curvature relationship had been developed accounting for the changes in geometrical characteristics and material properties of the tested box girders.
Saad-Eldeen et al. 41 investigated the effect of corrosion degradation on the ultimate strength, dissipated energy, compliance, ductility and elastic limit of the corroded steel box girders. A significant reduction in the stiffness, stress–strain relationship and elastic modulus was observed. Saad-Eldeen et al. 42 evaluated numerically the ultimate bending moment of two box girders subjected to different levels of corrosion degradation and experimentally tested under pure vertical bending moment. A series of non-linear finite element (FE) analyses have been conducted. Two models of corrosion degradation have been used to represent an average general corrosion thickness reduction and the real corrosion thickness. A relationship has been developed to predict the expected difference in the ultimate strength calculations based on the FE models representing the corrosion degradation as an average thickness reduction or as the real measured corrosion reduction.
It was concluded that the welding toe has a significant effect on the ultimate bending moment when the steel structure is subjected to relatively high corrosion degradation. The strainhardening has no effect on the ultimate bending moment by increasing the corrosion degradation. In addition, the average thickness reduction model is suitable to be used for predicting the global structural behaviour of hull girder, and the real corrosion model has to be used for local stress analysis.
Saad-Eldeen et al. 43 performed a series of non-linear FE analyses of a severely corroded box girder subjected to uniform vertical bending moment. Two models of corrosion degradation have been adopted: one is an average general corrosion thickness reduction, and the other is the real thickness of the corroded plates. New stress–strain relationships have been developed accounting for the effect of corrosion on the flexural rigidity. Comparative FE analyses between the results achieved using the existing and developed stress–strain models and the test results of a severely corroded box girder have been conducted. The comparison showed good agreement and supported the choice of the newly developed stress–strain relationships of the corroded structures.
The small scale specimens taken from the box girders have been corroded in sea environment 44 and then tested up to ultimate strength, showing an important reduction in strength 40 as compared with non-corroded structures are fatigue tested, and the analysis presented by Garbatov et al. 45 demonstrated that the severe corrosion degradation of a stiffened panel may reduce the fatigue strength from fatigue design curve, FAT 100 to 65 MPa as a result of the crack propagation starting from corrosion pits and due to changes in mechanical properties of the corroded steel.
The work presented by Garbatov et al. 46 estimated the effect of corrosion deterioration on small scale coupons taken from the large scale specimens analysed in Ref. 41 subjected to tensile loading. For the corroded steel specimens with >20% of the degree of degradation, the reduction in strength is significant. There is a difference between reductions in yield stress and tensile strength. The reduction in yield strength is non-linear, but in the case of tensile strength, it is linear. The change in material parameters are caused by corrosion and stress concentration due to local corrosion pits, which are the two most important factors that have a big impact on strength reduction in addition to section loss. An equivalent stress–strain curve of corroded steel plates as a function of the corrosion degree of degradation was developed based on the regression equations, which identify the relation of the experimental true stress strain curve with Young's modulus, yield stress, toughness and hardening parameter.
The study presented here develops a fast approach to predict the behaviour and ultimate bending moment of corroded steel thin walled structures. Extensive calculations have been performed using different existing formulas to calculate the ultimate bending moment of the three corroded box girders. The new fast approach has been developed and validated based on experimental results and different existing approaches to account for the changes in both geometrical and mechanical properties of corroded steel structures.
Existing ultimate moment capacity approaches
There are many existing formulations for predicting the ultimate strength of the ship's hull under vertical bending moment and may be classified into three groups of approaches: linear, empirical and analytical.
Linear approach
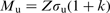
The linear approach defines the behaviour of the ship hull up to the collapse of the compression flange to be linear elastic without buckling, and the ultimate moment capacity of the hull is expressed as the ultimate strength of the compression flange multiplied by the elastic section modulus with a correction for buckling and yielding. Vasta
1
suggested an expression for predicting the hull ultimate strength based on the assumption that the ship hull would reach the ultimate limit state when the compressed flange, that is, the upper deck in the sagging loading condition or the bottom plating in the hogging loading condition, collapsed, and the relationship between the bending moment and the curvature is linear. Based on these assumptions, the following expression was suggested to predict the ultimate bending moment of the hull girder

 is the elastic section modulus at the compressed flange, and
  is the ultimate buckling strength of the compressed flange.
Mansour and Faulkner
2
criticised the formulation's assumptions because the location of the neutral axis will be shifted after buckling of the compression flange. They suggested a slight modification of the formula given in Ref. 1 as
 is a function of the ratio of the areas of the one side shell to the compression flange. For a frigate, they calculated the value of
  to be ∼0.1.
Viner
3
assumed that the elastic behaviour is maintained up to the point where the longitudinals of the compressed flange reach the collapse state, and this leads to immediate hull collapse. Based on this assumption, an expression for calculating the ultimate strength was proposed

 is a factor that normally varies in the range of 0.92 to 1.05 (mean, 0.985).
On the basis of elastoplastic large deformation FE solutions for large scale box girders and full scale ship hulls, Valsgaard and Steen
4
found that hull sections have a reserve strength beyond the onset of the collapse of the compressed flange. For this reason, they introduced a concept of the hull section strength margin and suggested a formula based on the actual shape of the hull cross-section

 varies according to the actual shape of the hull cross-section. For the single hull VLCC, which collapsed in 1980, they calculated the mean value of
  as 1.127.
Empirical approach
The second group of approaches is the empirical ones, where the formulations are derived based on experimental or numerical data from scaled hull models. By taking into account systematic errors associated with the yield strength and the ultimate compressive strength, Faulkner and Sadden
5
suggested an empirical formula for calculating the ultimate bending moment
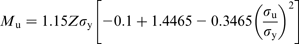
 is the plastic bending moment.
Analytical approach
The analytical approaches are based on an assumed stress distribution over the hull section, from which the moment of resistance of the hull is calculated taking into account the buckling in the compressed flange and the yielding in the tension flange.
The analytical derivation of a hull ultimate strength formula taking into account buckling in compression and yielding in tension was first proposed by Caldwell, 7 where the ship hull cross-section was idealised as an equivalent section with uniform plate thicknesses in the deck, bottom or sides. A distribution of longitudinal stresses of the equivalent single hull section was made, assuming that all structural members have the same yield strength. The entire net sectional area in compression was assumed to have reached its ultimate buckling strength, while full yielding was assumed for the material in tension.
The ultimate strength of the compressed flange is not necessary to be the same as that of the sides shell. The change of the neutral axis position was taken into account. The ultimate bending moment capacity of the hull was then analytically calculated by the integration of the moment resulting from the stresses with respect to the neutral axis.
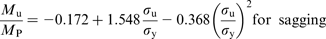
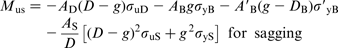
This method has been modified in Ref. 8, where the stress distribution of the hull section allows for the case where the yield strengths of the tension flange and side shell under tension are not necessarily the same. Similarly, the ultimate buckling strength of the compressed flange is not necessary to be the same as the side shell buckling strength; after that, the procedure was modified to account for the buckling of the structural element also to include the double hull arrangement, as given
 ,
,  and
and  are the total sectional areas of the deck, outer bottom, inner bottom and side shell respectively; is the hull depth; g 1 is the neutral axis position above the baseline in the sagging condition;
  and
and  are the ultimate buckling strengths for deck and side; and
  ,
,  and
and  are the yield strength of the outer bottom, inner bottom and side respectively.
Paik and Mansour 8 derived an analytical expression for predicting the ultimate strength of single and double hull ships under vertical bending moments. A credible distribution of longitudinal stresses over the hull section of the overall collapse state was assumed. It was postulated that parts of the compressed side shells as well as the compressed flange will reach their ultimate limit state in compression.
The tension flange will reach the yield stress of the material while compressing side shells in the immediate vicinity of the neutral axis as well as all side shells under tension are assumed to remain elastic and the stress distribution there is assumed linear
To calculate the ultimate compressive strength, Paik and Thayamballi
47
derived an empirical formula for the ultimate compressive strength of a stiffened panel as a function of the plate  and column
  slenderness based on existing collapse test results of stiffened panels as given
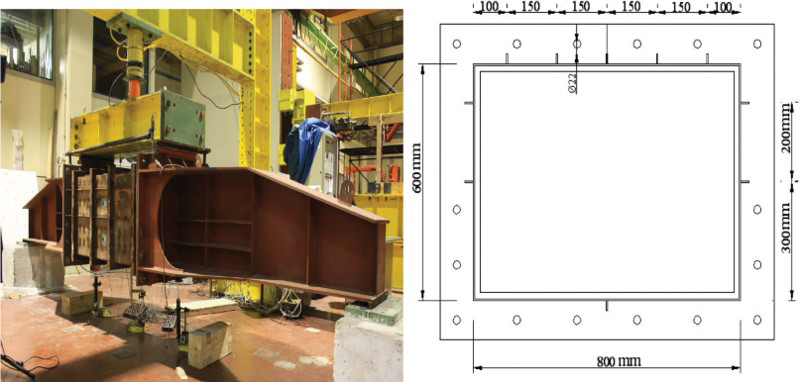
Experimental set-up (left), cross-section of analysed box girders (right) 38
The box girders were made of steel of minimum yield point equal to 235 MPa and Young's modulus of 206 GPa. The specimens were exposed to Baltic sea water without any corrosion protection system (no coating). One of the box girders was tested in cold water and the others in hot water.
The box girders were placed in large tanks, and sea water was continuously pumped into the tanks. The temperature of the sea water was increased, and the oxygen depolarisation subprocess rate was increased by agitation of the sea water, which resulted in corrosion rate increase. To model corrosion rate acceleration, anodic polarisation of the metal surface was used. Anodic electric current was supplied by an external source. The test durations were 30 days for experiments with application of external electrical current and 90 days for the test performed without polarisation.
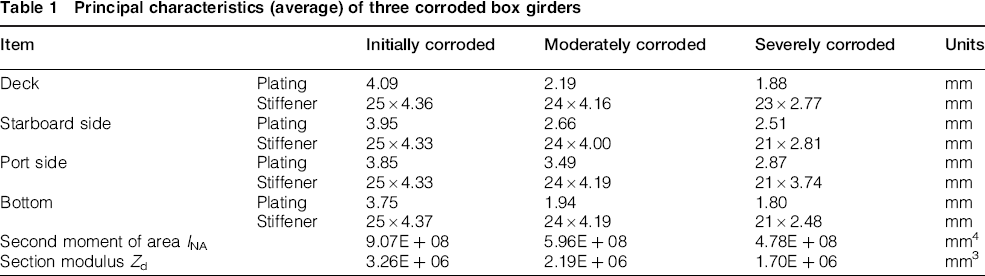
A survey of corrosion thickness on the three corroded box girders plating was analysed. The corrosion data consisted of 636 measurements of corrosion thickness, with 212 measurements collected for each box girder. The as built thickness of measured plates and stiffeners was 4.5 mm. As can be seen from Fig. 2, the corrosion distribution was non-uniform, and several places were subjected to aggressive corrosion deterioration, as can be observed. According to the corrosion degradation, three different corrosion degradation levels are defined as initial moderate and severe corrosion. The average thicknesses of the main structural items of the three corroded box girders, based on the thickness measurement survey, are given in Table 1.
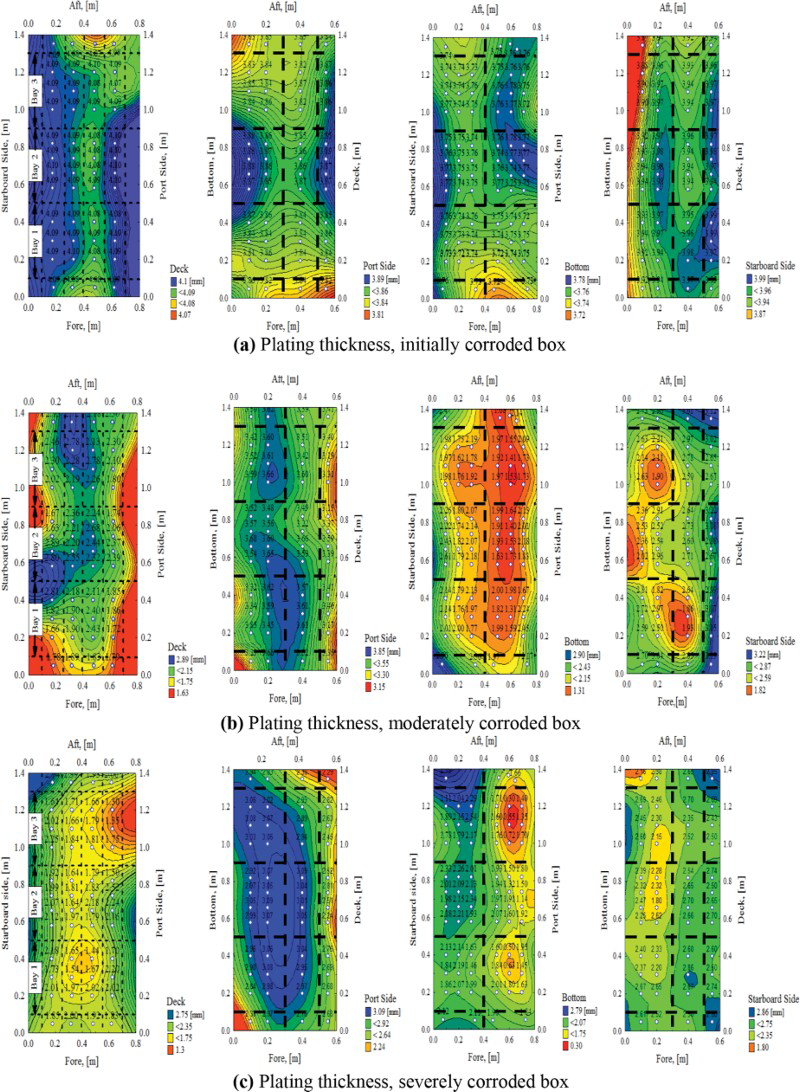
a plating thickness, initially corroded box; b plating thickness, moderately corroded box; c plating thickness, severely corroded box
Principal characteristics (average) of three corroded box girders
The three corroded box girders have been experimentally tested under vertical loading, producing a constant pure vertical bending moment along the box girder length.36–38 The box girder has been mounted between two stiff supporting arms using bolt connections, as shown in Fig. 1 (left). The box girder was subjected to four-point vertical bending moment. The bottom part is subjected to tension, and the upper part (deck) is under compression.
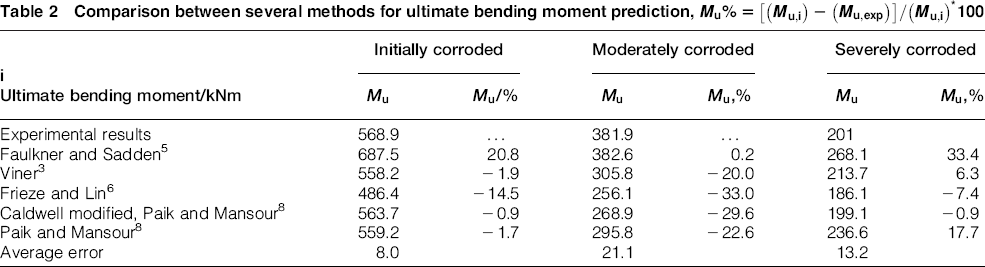
To avoid shear effects, the load is applied on a certain distance away from the ends of the box girder (the connections between the box girder and the supporting arms). The load is applied using a 700 kN hydraulic jack, and it is transmitted to the box girder through a horizontal beam, as shown in Fig. 1 (left). The resultant ultimate bending moment of the three corroded box girders is given in Table 2.
Comparison between several methods for ultimate bending moment prediction,

 /%
/%
 ,%
,%
 ,%
,%With the use of the above mentioned expressions, the ultimate bending moment of the three defined corroded box girder analysed 36-38 with the given characteristics in Table 1 has been calculated and presented in Table 2.
It has to be pointed out that for the initially corroded box girder, the approaches presented by Viner 3 , Paik and Mansour 8 show good agreement with the experimental result (see Table 2). On the other hand, for the moderately corroded box girder, the only expression that gives a good prediction of the ultimate bending moment is the one proposed in Ref. 5. For the severely corroded box girder, the only expression that gives a good prediction of the ultimate bending moment is the modified Caldwell (approach by Paik and Mansour 8 )
Various approaches have been applied to analyse the ultimate bending moment of the three corroded specimens subjected to initial, moderate and severe corrosion degradation. The differences between the three box girder models, as introduced in those expressions, were only the different thickness of the corroded members. Therefore, if this was the only effect of corrosion (geometry effect), then the variation of the results using the above mentioned methods should be approximately the same for the three boxes.
However, it is consistent that the results of the three box girders, given in Table 2, show an average change of ∼13.1% and 5.2% in a comparison of the initially corroded to the moderately and severely corroded boxes respectively. The observed difference with respect to the total reduction in the cross-sectional area of the three boxes is shown in Fig. 3. It can be seen that in addition to the reduction in thickness, the presence of corrosion has an additional influence of changing the mechanical properties.
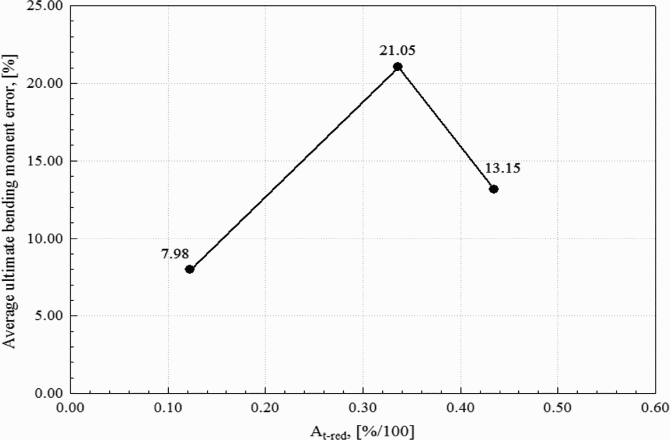
Ultimate bending moment error
New fast approach
Using the Common Structural Rules, CSR iterative process, 15 the moment–curvature relationships for the three box girders tested36–38 have been established using the original material properties as yield stress, Young's modulus and the Poisson's ratio of 235 MPa, 206 GPa and 0.3 respectively.
For the initially corroded box girder (Fig. 4), it may be observed that the calculated ultimate bending moment is less than the experimental one with ∼17.2%. This lower bending moment can be explained with the safety factors that the Classifications Societies Rules are using. From the global strength point of view, quantifying how the moment–curvature behaviour matches the experimental results (see Fig. 4, right), the predicted relationship based on CSR showed a value of 1.08, as is given in Fig. 4 (right) and Table 3.
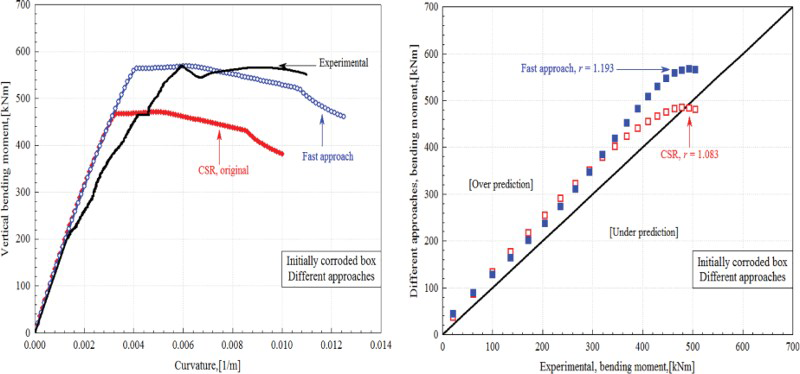
Moment–curvature relationship (left), data fitting (right), initially corroded box
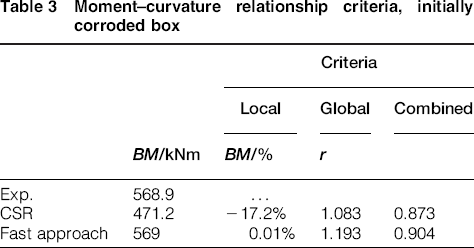
Moment–curvature relationship criteria, initially corroded box
 /kNm
/kNm /%
/%
According to the developed combined criteria proposed by Saad-Eldeen et al.
42
as given in equation (10), the matching of the combined prediction of the both ultimate bending moment and behaviour of the initially corroded box girder based on the CSR procedure is 0.873, as tabulated in Table 3.
 is the difference between numerically and experimentally defined ultimate bending moments in (%) and the judgment of the adequacy r. The coefficient r is the slope coefficient of the linear trend of the moment–curvature relationship for both FE and experimental results. If r = 1, this is the best fitting, when r < 1 is an under estimation, and if r >1, then it is an overestimation.
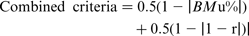
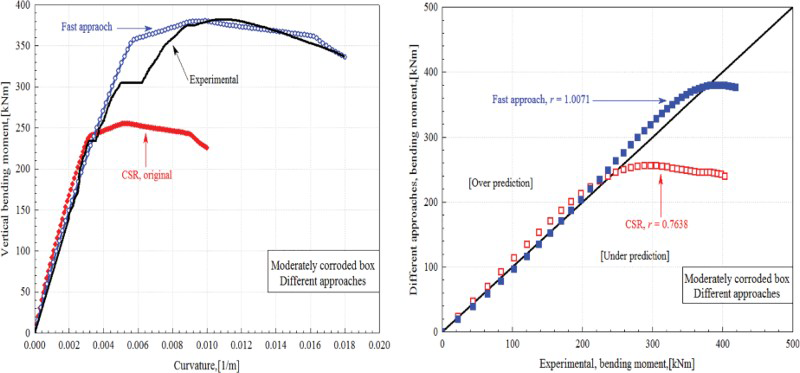
In the case of moderately corroded box girder, with the application of the CSR procedure, the same observation occurred in the initially corroded box; the calculated ultimate bending moment is less than that of the experimental one with 33.2%, as shown in Fig. 5 (left) and as is given in Table 4. Comparing the global behaviour of the moderately corroded box girder based on the CSR with the experimental output, a value of 0.7638 was determined as shown in Fig. 5 (right). Combining both local evaluation (ultimate bending moment) and global prediction ( ), the prediction based on the CSR with respect to the experimental results of the moderate corroded box girder is 0.716, which is quite poor estimation, as given in Table 4.
Moment–curvature relationship (left), data fitting (right), moderately corroded box
Moment–curvature relationship criteria, moderately corroded box
 /kNm
/kNm /%
/%
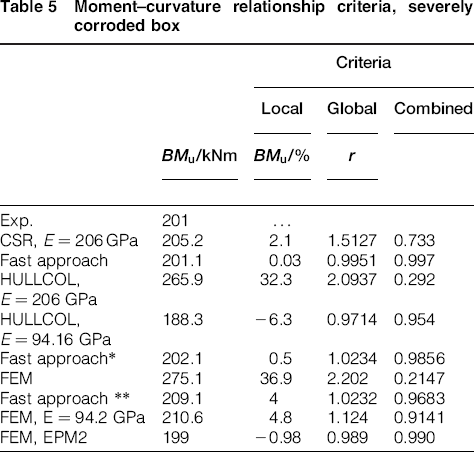
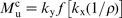
Using the CSR approach for predicting the behaviour of the severely corroded box girder shows that the predicted ultimate bending moment is bigger than the experimental one with 2.07%, as may be seen in Fig. 6 and is given in Table 5, which is in contradiction with the initially and moderately corroded boxes. This higher ultimate strength can be explained with the fact that corrosion has also a significant effect on the mechanical properties beside the geometry in case of severe corrosion.
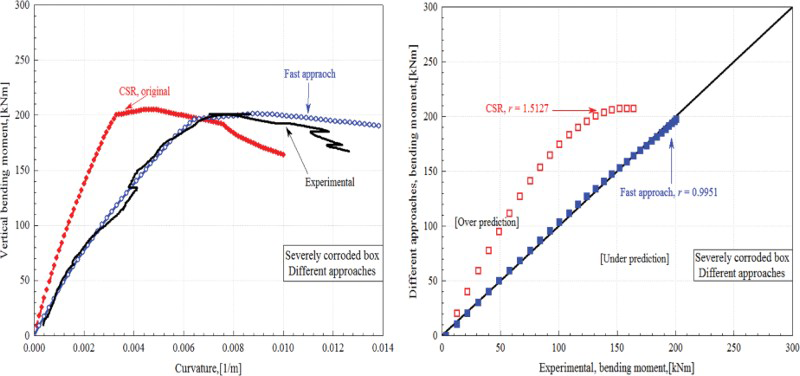
Moment–curvature relationship (left), data fitting (right), severely corroded box
Moment–curvature relationship criteria, severely corroded box
 /kNm
/kNm /%
/%
Therefore, if the original mechanical properties of the steel material are used, especially the Young's modulus, the prediction of the ultimate bending moment will be overestimated. From the global strength point of view, the box girder registered a higher value of 1.513, as may be seen in Fig. 6 (right), and confirms the explanation given above. Furthermore, the combined criterion shows a value of 0.733 (see Table 5), which gives an indication that the prediction of the total behaviour of the severely corroded box girder based on the CSR formulation accounting for corrosion degradation is not satisfactory.
From the three corroded box girder predictions, based on the CSR procedure, it is necessary to adopt the procedure to have a better prediction of corroded steel thin walled structures.
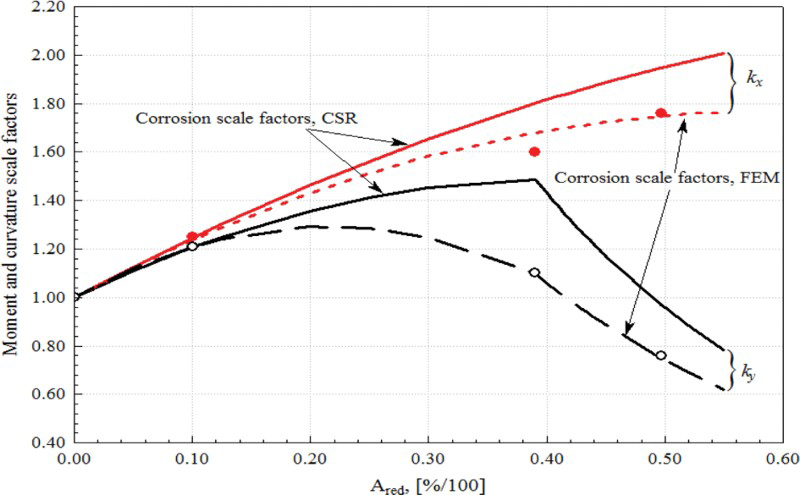
Based on the prediction of the CSR procedure, a fast approach has been developed here for estimating the ultimate strength behaviour of corroded steel box girder structures. The principal contribution is the development of corrosion scale factors to account for both geometrical and mechanical properties, as shown in Fig. 7. The expression for adjusting the results obtained using the classical approach for calculating the ultimate bending moment as a function of curvature, accounting for the corrosion effect, is given as
 and
and  are corrosion scale factors defined based on experimental results and the new CSR simplified approach

 is the reduction in the net sectional area of the structural part under compression, which in this study is deck panel and a part of the side structure. This means that the developed corrosion scale factors are related to the sagging loading condition of the tested box girders. The governing parameters C and D given in equation (12) have been defined based on a regression analysis as − 1.4 and 2.6 respectively
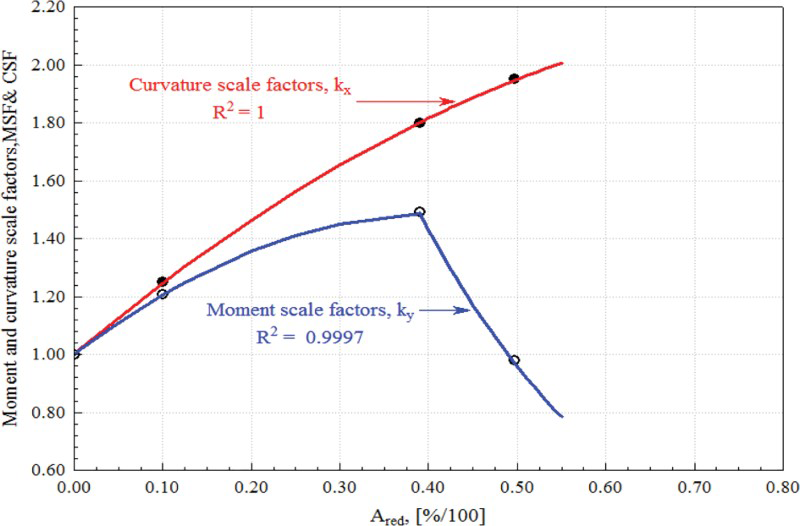
Moment and curvature corrosion scale factors, CSR
Application of new developed fast approach
Different approaches have been used for predicting the ultimate bending moment of the corroded box girders. The first one is the FE method, and the second one is employing the HULLCOL code developed by Gordo et al. 14 For both approaches, the original material properties define as yield stress, Young's modulus and Poisson's ratio of 235 MPa, 206 GPa and 0.3 respectively have been used.
For the first approach (FE), the geometry of the box girder structure is modelled in the way as the real one has been used during the ultimate strength test without any simplifications based on the general non-linear FE commercial code ANSYS, 48 as may be seen in Fig. 8. The FE analysis utilises the full Newton–Raphson equilibrium iteration scheme. The large deformation option is activated to solve the geometric and material non-linearities and to pass through the extreme points. The automatic time stepping features are employed allowing the programme to determine appropriate load steps.
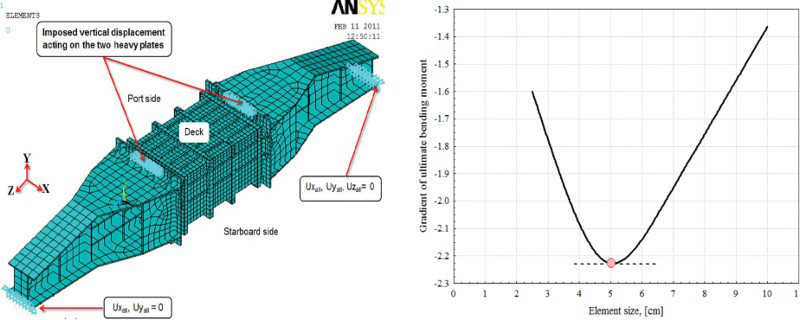
Finite element model (left) and gradient of ultimate bending moment vs. element size (right)
Shell elements were used to generate the entire FE model. The shell element, SHELL 93, is defined by eight nodes, four nodal thicknesses, with six degrees of freedom at each node: translations in nodal x, y and z directions and rotations about the nodal x, y and z axes.
The deformation shapes are quadratic in both in-plane directions. The element has plasticity, stress stiffening, large deflection, and large strain capabilities.
Extensive measurements were performed for plating imperfections along the deck panel between the stiffeners using a three-dimensional Photogrammetry measurement technique as reported by Chen et al., 49 where a three-dimensional measurement technique and central projection imaging as a fundamental mathematical model was used to model the deformed surfaces.
The recorded imperfection data were analysed 50 and fitted to a lognormal distribution with a mean value and standard deviation of 3.13 and 2.05 mm respectively, as may be shown in Fig. 9 to Fig. 11 (left). The measured initial imperfections for each box girder are represented by triangles and fitted to an appropriate shape defined by dash line, as given in Fig. 9 to Fig. 11 (right). According to the measurements and the fitting, the initial imperfection amplitudes are 1.72, 3.94 and 3.92 mm for initially, moderately and severely corroded box girders respectively, as shown in Fig. 9 to Fig. 11 (right).
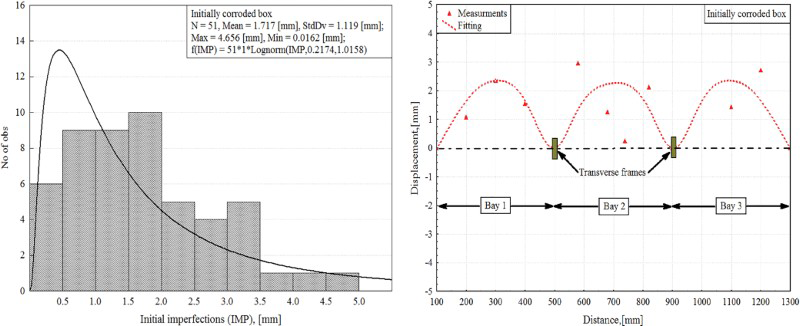
Histogram of initial imperfection amplitude (left) and shape (right), initially corroded box
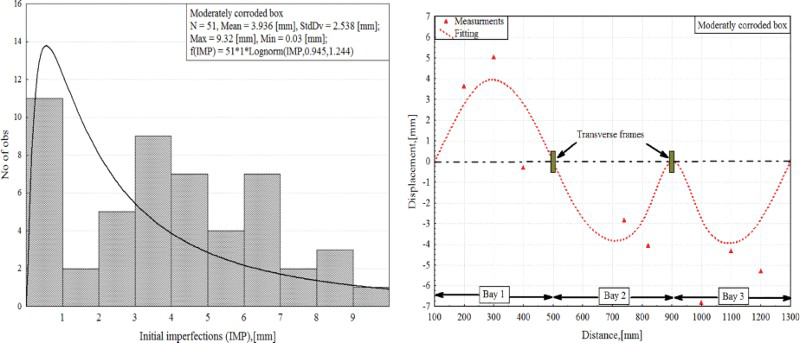
Histogram of initial imperfection amplitude (left) and shape (right), moderately corroded box
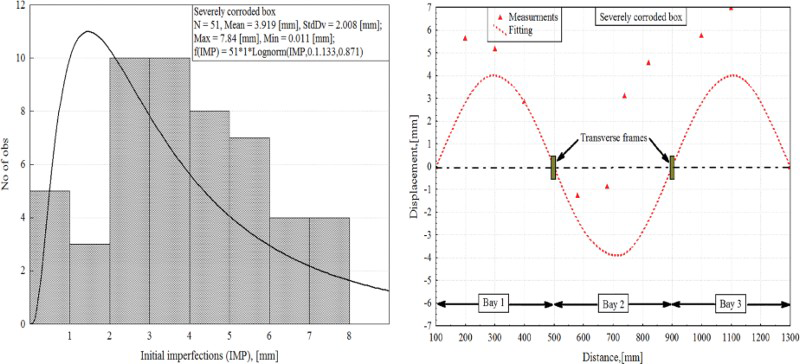
Histogram of initial imperfection amplitude (left) and shape (right), severely corroded box
In order to obtain precise results and to find out an appropriate element size to be used for the FE model, systematic FE analyses have been carried out 51 for an intact box girder having the same configurations of the analysed one here. It has been concluded that the appropriate FE size is 5 cm, as may be seen from Fig. 8 (right). It can also be observed from Fig. 8 (right) that there is an inflection point at the level of the element size of 5 cm, which refers to the change in the gradient of the ultimate bending moment behaviour.
The load is generated by imposing vertical displacement acting on the two heavy plates, which are located outside of analysed box girder on the supporting arm connection in order to avoid the shear effect (see Fig. 8, left). The displacement load is applied by small increments to ensure that the analysis would closely follow the structural load–response curve. The considered boundary conditions are as follows; both ends are constrained from translations in the vertical and transverse directions. The translation in the longitudinal direction is only constrained at the one of the ends. No rotation is prevented, as shown in Fig. 8, left.
The box girder element surfaces (plates, stiffeners, web frames and brackets) have been modelled using the average corrosion thickness given in Table 1, which represent the mean values of the measured thicknesses data for each element.
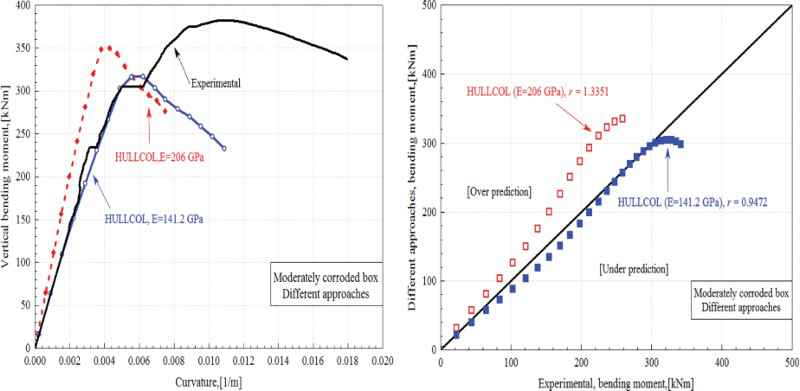
For the second approach (HULLCOL), the box girder has been split into stiffened plates and hard corners. With the application of both approaches, the behaviour of the moderately corroded box girder has been predicted, as shown in Fig. 12. As presented in Fig. 12 (left), both approaches are coinciding with each other, registering lower ultimate strength in comparison to the experimental results with 1.34% and 8.55% for the FEM and HULLCOL respectively (see Table 4). From the global strength behaviour point of view, it is clear that both approaches are far from experimental results with r ∼1.3357 and 1.3351 for FEM and HULLCOL respectively, as may be seen in Fig. 12 (right). Taking into account both local and global behaviours, the combined criteria that indicate how better prediction is, the two approaches FEM and HULLCOL registered a value of 0.825 and 0.789 respectively.
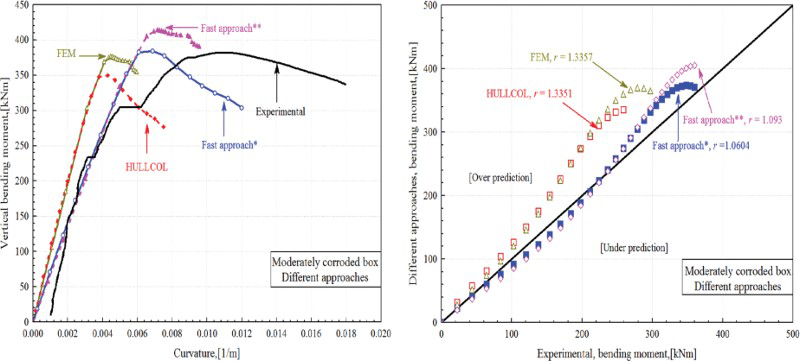
Moment–curvature relationship (left), data fitting (right), moderately corroded box
With the use of the new developed fast approach, for adopting both FEM and HULLCOL, the resultant moment–curvature relationship is given in Fig. 12 (left). The given notations (fast approach** and fast approach*) represent the new adopted relations for FEM and HULLCOL respectively. It is obvious that the slope of both fast approaches (* and **) is equal to that of the experimental one, accounting for the geometry corrosion effects on the mechanical properties. The calculated local and global parameters that define both relationships are given in Table 4. From the combined criteria point of view, Table 4 with the use of the fast approach for both FEM and HULLCOL, the box girder registered a value of 0.9108 and 0.9669 respectively.
It has to be pointed out that the corrosion scale factors used to adopt both FEM and HULLCOL results are less than the ones given in CSR. This is because the proposed corrosion scale factors for the CSR are the upper bound due to the safety factor they are using. The location of the corrosion scale factors used for the FEM and HULLCOL approaches for the moderately corroded box girder with respect to the developed fast approach is shown in Fig. 14 at 0.39 of  .
.
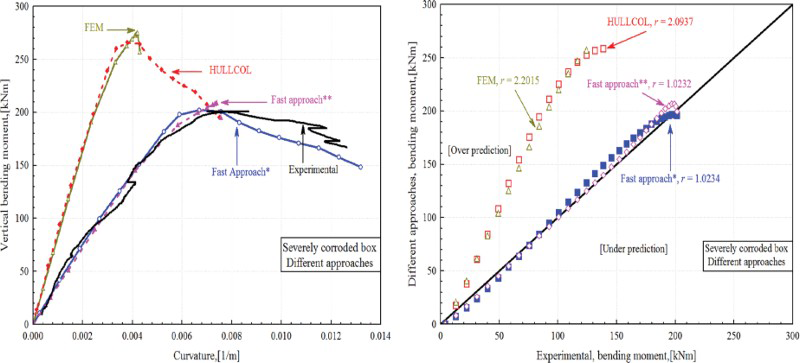
Applying both FEM and HULLCOL for the severely corroded box girder, the calculated moment–curvature relationships are given in Fig. 13 (left). Both FEM and HULLCOL registered higher bending moment rather than the experimental one with 36.87% and 32.28% respectively and given in Table 5.
Moment–curvature relationship (left), data fitting (right), severely corroded box
From the slope point of view, it is clear that the estimations based on the FEM and HULLCOL approaches are not satisfactory 2.20 and 2.09 respectively (see Fig. 17, right), which indicates that, for corroded structures, beside the effect of corrosion on the geometrical configurations, another additional effect has to be taken into account, which is the Young's modulus.
Using the new developed fast approach for adopting the FEM and HULLCOL approaches for predicting the strength behaviour of the severely corroded box girder, it is evident that the adopted results using the fast approach showed good agreement with the experimental results of ∼4.02% and 0.54% higher ultimate bending moment, as given in Table 5. From the global criteria point of view, the behaviour of the box girder registered a value of 1.02 and 1.02, as may be seen in Fig. 13 (right). Combining both local ultimate bending moment and the global behaviour of the adopted approaches (fast approach ** and fast approach*), the combined criteria give a better prediction of 0.968 and 0.986 respectively, as tabulated in Table 5.
It has to be noted that the corrosion scale factors used to adopt both FEM and HULLCOL results are less than the ones given for the CSR approach. This is because the proposed corrosion scale factors for the CSR approach are the upper bound due to the safety factors they are using.
The location of the corrosion scale factors used for the FEM and HULLCOL approaches for the severely corroded box girder with respect to the fast approach is shown in Fig. 14 at 0.49 of  . Based on the regression analysis, the governing parameters defining equations (12) and (13) in the case of the FEM and HULLCOL approaches (C, D, E, F, G, H and Q) have been determined as − 2.2, 2.6, 0.28, 0.39, 1.1, − 6.23 and 2.73 respectively.
Moment and curvature scale factors, FEM and HULLCOL
It can be concluded that the new developed fast approach is the upper bound for the assessment of ultimate bending moment of corroded steel thin walled structures; therefore, with the use of any different approaches, the corrosion scale factors should be less or equal, which has been confirmed using the FE analysis and the HULLCOL software.
Effective Young's modulus approach
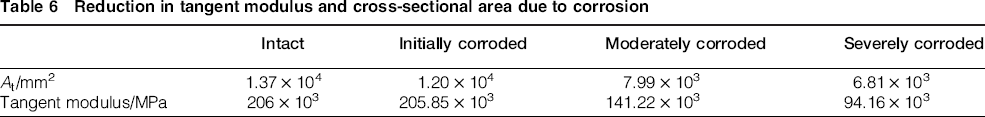
Based on the experimental observations, there is significant reduction in the apparent elastic modulus of the moderately and severely corroded box girders37,38 and confirmed with other experimental data
41
, as given in Table 6. A relationship has been developed to calculate the equivalent tangent modulus of corroded structures as a function of the total reduction in the cross-sectional area based on the experimental observations, as may be seen in Fig. 15. The proposed expression is given by
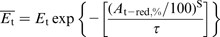
 is the normalised tangent modulus with respect to the intact one, and
  is the total reduction in the cross-sectional area. Based on regression analysis, the governing parameters, S and
  , defining equation (14) have determined as 3.87 and 0.09 respectively. The quality of fitting the proposed expression with the experimental results r is 0.9993, as given in Fig. 15.
Reduction in tangent modulus and cross-sectional area due to corrosion
Equivalent Young's modulus
According to the experimental results, the tangent modulus of the moderately corroded box girder is equal to 141.2 GPa, as reported in Ref. 37. With the use of the given tangent modulus (mechanical properties) as input beside the reduction in plating thickness (geometry), the calculated moment–curvature relationship using the HULLCOL approach is shown in Fig. 16. As can be seen, with the use of the tangent modulus of intact steel structures (206 GPa), the behaviour of the box girder is far away from the experimental results, which has been evaluated by the combined criterion of 0.7897, as is given in Table 4. On the contrary, with the use of the newly defined tangent modulus, the bending moment–curvature behaviour of the box girder matches with the experimental one with combined criteria of 0.8879, as given in Table 4.
Moment–curvature relationship (left), data fitting (right), moderately corroded box
For the severely corroded box girder, the observed experimental tangent modulus was 94.2 GPa; considering this value for FEM and HULLCOL, Fig. 17 shows the resultant moment–curvature relationship. In the case of the traditional tangent modulus of 206 GPa in both FEM and HULLCOL approaches, it is clear that the prediction of box girder bending moment–curvature is too far away from the experimental one checked by the combined criteria of 0.214 and 0.292 respectively, as given in Table 5. On the other hand, with the use of the newly defined tangent modulus, the box girder showed good agreement with the experimental results from the point of view of the ultimate bending moment and the global behaviour, with a combined criteria value of 0.9141 and 0.954, as given in Table 5.
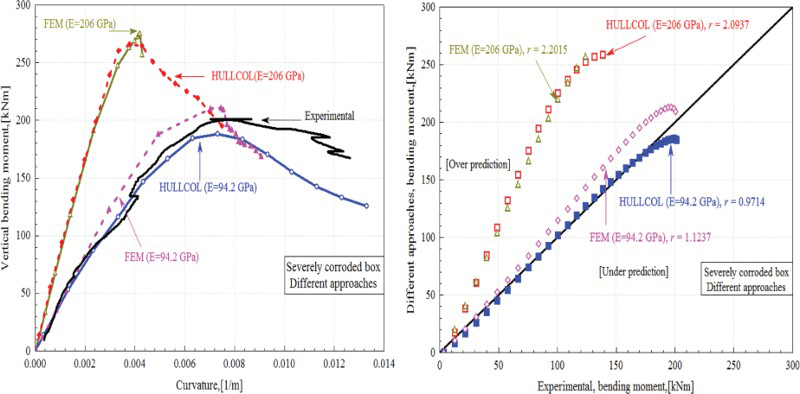
Moment–curvature relationship (left), data fitting (right), (different tangent modulus) severely corroded box
A systematic procedure for the application of the newly developed fast approach to any ultimate bending moment–curvature calculation tool and the use of the new equivalent tangent modulus approach within FEM is shown in Fig. 18.
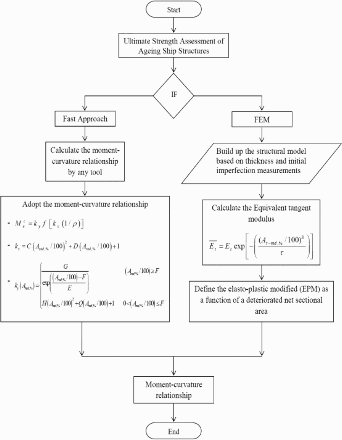
Flow chart of ultimate strength assessment of aging ship structures
Conclusions
The ultimate bending moment of the three corroded box girders has been calculated using different existing formulations, showing big deviations between the applied formulations.
A new fast approach has been developed for predicting the entire behaviour of corroded steel thin walled structures. Different approaches, FEM and HULLCOL, have been used to predict the behaviour of the corroded steel box girders.
Based on experimental observations, a relationship has been developed to calculate the equivalent tangent modulus of corroded structures as a function of the total reduction in the compressed cross-sectional area.
The behaviour of aging box girder ship structures can be predicted using the newly developed effective Young's modulus. It is concluded that, for all of the approaches used for the ultimate strength analyses, with increasing corrosion level, the newly developed effective tangent modulus should be used to account for corrosion effects on the material properties. The developed approach may be easily employed in any new or already developed software codes or in a non-linear FE analysis to account properly for the corrosion deterioration.
Acknowledgements
The experimental work analysed here has been performed within the project ‘‘MARSTRUCT-Network of Excellence on Marine Structures’’ (http://www.mar.ist.utl.pt/ marstruct/) and has been partially funded by the European Union through the Growth program under contract TNE3-CT-2003-506141. The first author has been funded by the Portuguese Foundation for Science and Technology (Fundação para a Ciência e Tecnologia - FCT) under contract SFRH/BPD/84823/2012.