
Abstract
In this work, the corrosion fatigue behaviour of steel armours used in the flexible pipes, in aqueous solutions initially containing different concentrations of Fe2+, was investigated by four-point bending testing under saturated 1 bar CO2 condition. Corrosion fatigue results were supported with ex situ measurements of Fe2+ and pH. Characterisation of the corrosion scales and crack formations was performed using microscopic and diffraction techniques. Fatigue results showed two times better fatigue life, at the stress ranges of 250 MPa, for samples tested in solutions containing the concentration of Fe2+ marginally above the solubility limit of FeCO3 compared to the samples tested in highly supersaturated solution of Fe2+. Results revealed that the impact of the alternating stresses on the corrosion behaviour of samples reduces with lowering the applied stresses. At the stress range of 100 MPa, fatigue samples experienced the same corrosion rate as samples that were not subjected to dynamic loading.
Introduction
Flexible pipes, which are used in the oil and gas industry, are an attractive alternative to rigid pipes due to their shorter installation times and longer durability. The typical structure of flexible pipes is composed of polymeric and steel layers, which are not bonded together, to ensure the flexibility of the pipe. 1 The fatigue life of a flexible pipe is determined by the fatigue life of the steel armours, which is placed in the annular space between the inner liner and outer sheath. It was reported 2 that the fatigue life of tensile armour depends on the applied stresses, which are generated due to waves and water current, and the corrosive operating environment. The annulus region might be water filled either due to diffusion and condensation of water from the bore or as a result of a breakage of the outer sheath allowing the entry of sea water. In addition, the severity of the corrosion environment may be increased due to diffusion of small molecules such as methane (CH4), carbon dioxide (CO2) and hydrogen sulphide (H2S) from the pipe bore through the inner liner into the annulus.1–3 However, due to a low ratio of free water volume (V) to steel surface area (S), typically < 0.1 mL cm− 2, 3 a rapid, high supersaturation of Fe2+ in the liquid is possible. As a consequence, low corrosion rates, usually < 10 μm year− 1, are achieved.3,4
The corrosion behaviour of steel in aqueous CO2 solution is influenced by the formation of protective films, which might decrease their corrosion rate.5,6 Typical corrosion scales, formed in such an environment, consist of iron carbonate (siderite, FeCO3) and undissolved cementite (Fe3C).7,8 A large number of environmental variables, such as pH,9–11 temperature, 9,12,13 partial pressure 11 and flowrate,14–17 influence the corrosion behaviour of steel. Further, material characteristics such as microstructure, chemical composition and heat treatment condition18–20 will also have a significant impact.
The concentration of Fe2+ in the solution is one of the main factors influencing the kinetics of scale formation.21,22 It was reported7,14,23,24 that the precipitation rate of FeCO3 at temperatures < 60°C is relatively slow due to high solubility of FeCO3. In order to form a protective FeCO3 scale, supersaturation of Fe2+ (SR>1) is necessary, particularly at temperatures < 20°C. 11 No passive films develop when the concentration of Fe2+ does not exceed the solubility limit of FeCO3. 25
Corrosion fatigue is defined as a sequential damage of material subjected to cyclic load in a corrosive environment 26 and it accumulates in four stages: (i) cyclic plastic deformation, (ii) microcrack initiation, (iii) small crack growth including linkup and formation of crack networks, and (iv) macrocrack propagation.26,27 Rate of crack growth reported to increase significantly under corrosive conditions.28,29 This leads to significant reduction in fatigue life 30 and the endurance limit, as under atmospheric conditions, might no longer be observed.26–28 On the other hand, corrosion products could also blunt the crack tips, leading to crack retardation.31,32 Corrosion fatigue is a complex process and involves interactions between mechanical, metallurgical, chemical and electrochemical variables.22,23,33 Many mechanisms are responsible for corrosion fatigue damage, such as hydrogen embrittlement, scale rupture, dissolution and repassivation, and enhanced localised plasticity.26,34,35 Pitting is one of the principal mechanisms for crack initiation in corrosive environments.27,28,36
When exposing steels to aqueous CO2 solutions, their fatigue life is reduced compared to air conditions.28,37,38 Experiments revealed 37 that by exposing samples to corrosive CO2 environment, the time to failure is ∼10-50 times shorter compared to the fatigue life in air conditions. The results showed37,39 that the fatigue life decreased as a function of CO2 partial pressure, and the effect of CO2 content was more evident at lower stress ranges, such as 400 MPa. 37 Both pH and the composition of the electrolyte play an important factor in corrosion fatigue mechanisms.26,40,41 However, very little work has been published on the influence of the initial Fe2+ content in CO2 environment and on the fatigue behaviour of steel. Fatigue studies of the conditions found in flexible pipes have focused on developing test methods 2 and methodologies used in fatigue analysis.42,43 Only few publications detail on the corrosion fatigue data in an aqueous CO2 environment.37–39,44–46 The publications are based on limited datasets, while detailed analysis of the impact of corrosion mechanisms on the fatigue performance is still not explored. This includes the effect of highly supersaturated solution of Fe2+, typically found in annulus conditions.
The objective of the present paper is to investigate the influence of the initial Fe2+ concentration and corresponding alkalinity of the solution (HCO3 − ), together with resulting pH on the corrosion fatigue life of the steels used in flexible pipes. Experiments were performed under dynamic conditions by applying a four-point bending test, while simultaneously exposing materials to the corrosive media. Tests were performed in sea water saturated at 1 bar CO2 under atmospheric pressure at room temperature. The obtained fatigue results were supported by metallographic analysis of cracks and corrosion scales.
Experimental
Testing conditions
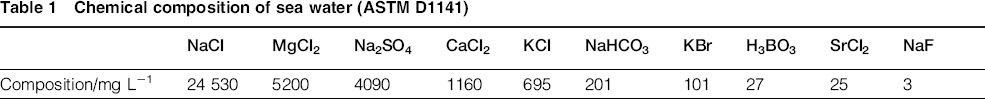
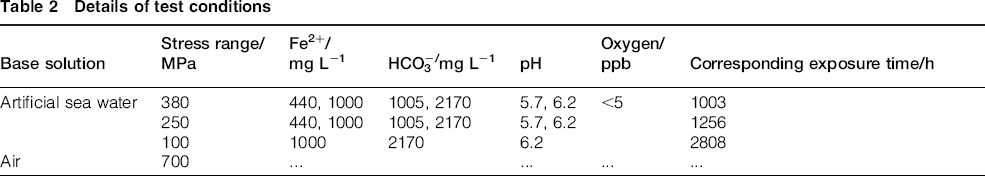
Experiments were conducted in artificial sea water with a chemical composition according to ASTM D1141 (Table 1) at 1 bar CO2, and the flowrate of the CO2 gas was 250 mL min− 1.The temperature of the solution was 20 ± 3°C. The solution was de-aerated in a de-aeration vessel by supplying oxygen free nitrogen gas until the oxygen content was < 5 ppb. The dissolved oxygen was measured using optical oxygen sensor (Visiferm DO 225). In addition, the remaining set-up was flushed with nitrogen in order to remove any oxygen. With the aim of obtaining an electrolyte with different concentrations of Fe2+, and consequently a range of different pH, steel wool was exposed to de-aerated sea water with 1 bar CO2 in the precorrosion vessel for different periods of time. Fatigue experiments were carried out with two initial Fe2+ concentrations, namely, low (440 mg L− 1) and high (1000 mg L− 1). The corresponding alkalinity (HCO3 − concentration) of the test solutions is shown in Table 2. The Fe2+ content was measured by a spectrophotometric method using a Shimadzu UV-1800 Spectrophotometer. The pH of the water taken from the vessel was measured using a pH meter (Radiometer Analytical pHC3081-8). The water free volume to steel area ratio was 20 mL cm− 2.
Chemical composition of sea water (ASTM D1141)
Fatigue tests were performed with a constant R value (0.1) with two different stress ranges, namely, high (380 MPa) and medium (250 MPa) for tests performed with low and high initial Fe2+ content. An additional fatigue test at the low stress range (100 MPa) was performed for high initial Fe2+ content. Six rectangular specimens, with a length of 275 mm, were tested at each stress range. The frequency used for fatigue testing was 0.5 Hz between 0 and 106 cycles, while 2 Hz >106 cycles. Fatigue testing performed at high and medium stress ranges continued until the fracture occurred. Owing to prolonged time needed for samples to fracture, the fatigue test performed at low stress range was continued for 2808 h. Parameters used for fatigue tests are listed in Table 2. Additional fatigue tests were also performed in air for comparison. Air fatigue tests were performed with a stress range of 700 MPa. In order to compare results from air conditions with those generated in the corrosive media, regression of an S–N curve with a fixed slope of − 6 was used.42,47
Details of test conditions
Test set-up
The fatigue behaviour of steel samples was analysed by applying a deflection controlled four-point bending test set-up (see Fig. 1).
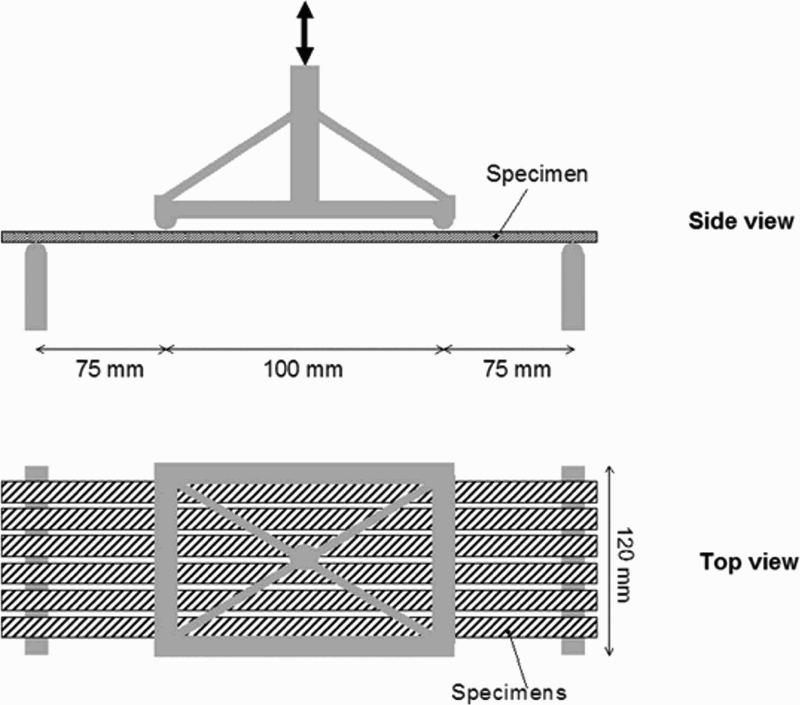
Schematic illustration of four-point bending set-up used for corrosion fatigue testing
The deflection of the sample, δ, in four-point bending test is described by equation (1), while generated stresses, σ, in the sample refer to equation (2).
48
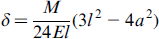
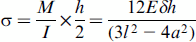
 is the second moment of area, h is the thickness of the sample, l is the distance between supports, and a is the distance from the support to the loading point.
The test set-up was equipped with a de-aeration vessel, precorrosion vessel and a special test chamber that made it possible to expose samples to the corrosive environment while testing them dynamically 2 (see Fig. 2). All vessels were made of Duplex 2205, while tubings were made of AISI 316 L stainless steel, and the set-up was constructed with the aim of avoiding ingress of oxygen in order to maintain a virtually oxygen free environment.
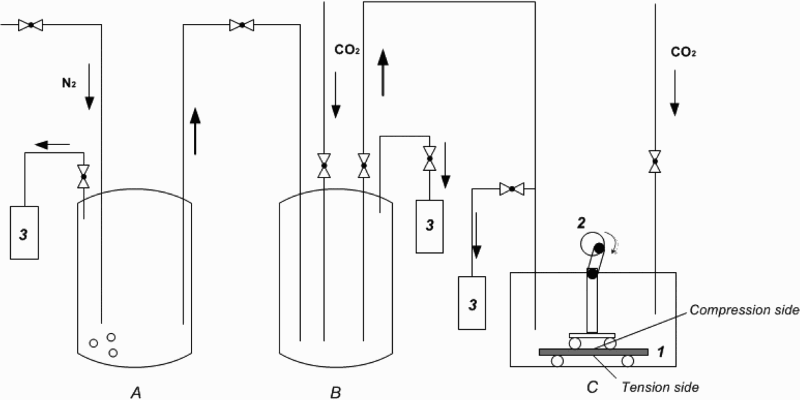
Schematic drawing of test set-up for corrosion fatigue testing: a de-aeration chamber; b precorrosion chamber; c test chamber [(1) FS, (2) eccentric, (3) wash bottle]
Material and specimen preparation
Six samples (length 275 mm, width 12.5 mm, thickness 4 mm) were tested for each applied stress range and initial Fe2+ content of the solution. The total area of fatigue samples (FSs) was 550 cm2. The material used for fatigue experiments was carbon steel with a composition of 0.77 wt-% C, 0.24 wt-% Si, 0.65 wt-% Mn, 0.17 wt-% P, 0.06 wt-% S, Fe as the balance. The material has a ferritic–pearlitic microstructure. All experiments were performed on samples in as received (i.e. cold rolling) conditions in order to simulate the material's behaviour as in the flexible pipe, except that before each experiment, the surface of the samples was thoroughly degreased with petrol and acetone, cleansed with ethanol, and dried in a hot air flow. Owing to cold rolling process, the microstructure of the material contained grains elongated in a longitudinal direction, which were oriented perpendicular to the applied load during fatigue testing.
Corrosion assessment
To measure the corrosion rate, six rectangular weight loss coupons (WLCs) with a length of 91 mm, width 12.5 mm, and thickness 4 mm, were placed in the test vessel. The total area of WLCs was 186 cm2. The WLCs were not subjected to dynamic loading. In addition, for each stress range for tests performed with high initial concentration, one FS was dedicated for descaling in order to analyse its corrosion rate under dynamic conditions. To measure the corrosion rate of WLC and FS, the weight of each sample was measured before test, and when the test was finished, specimens were descaled with inhibited hydrochloric acid solution (10% HCl+0.4% Armohib 28) and their weight was determined again.
To evaluate the morphology of the corrosion scales formed under dynamic conditions (for samples dynamically loaded), a scanning electron microscope (SEM; Zeiss EVO MS10) was used. The corrosion scales were analysed on both sides, where samples experienced tensile and compressive stresses during fatigue tests. Corrosion scale analysis was performed in locations where maximum stresses were applied during the fatigue testing. Phase analysis of the corrosion products was performed by means of X-ray diffraction (XRD) by applying a Bruker AXS Diffractometer D8 Discover. Measurements were performed with Cr K α radiation and carried out on the surface of the samples, resulting in a penetration depth of up to 17 μm.
Crack analysis
To elucidate the mechanism of fatigue failure, cross-section of one sample, exposed to each stress range and initial Fe2+ content of the solution, was analysed to observe the secondary cracks originating from the surface. The cracks were investigated on both sides of the sample, where compressive and tensile stresses respectively were induced during fatigue testing. The average depth of the cracks was estimated based on the measurements of 10 cracks. The cracks were investigated using light optical microscopy (LOM; Leica Dm Irm).
Results
Fatigue results
The S–N plots, for samples exposed to solutions with a low and high initial Fe2+ concentration, are shown in Fig. 3. Results from fatigue tests in air are included for comparison. Owing to the confidentiality reasons, the number of cycles could not be provided. However, a direct comparison can be made from the axis.
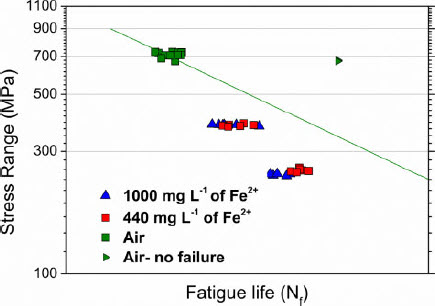
Stress range as function of fatigue life of samples exposed to air and sea water with 1 bar CO2 with initial Fe2+ concentration of 440 and 1000 mg L− 1
Fatigue results showed that when exposing samples to sea water at 1 bar CO2, fatigue life was decreased compared to the air conditions. Based on the fitted S–N curve for air fatigue results, with a fixed slope of − 6 (see S–N line in Fig. 3), the fatigue life was ∼7 and 33 times better in air than in corrosive media for high and medium stress ranges respectively. In addition, two samples tested in air did not fracture despite of a relatively high stress range.
For samples tested under high stress range, the initial Fe2+ and HCO3 − concentration in the solution, together with resulting pH, did not affect the fatigue life significantly. Samples tested in a solution with a low and high initial Fe2+ concentration showed similar fatigue life (see Fig. 3).
At the medium stress range, the fatigue life of samples increased by factors 4 and 5 for samples tested in a solution with a high and low Fe2+ content respectively. In addition, the scatter in fatigue data was smaller compared to the loading at high stress range. The fatigue life of samples exposed to low Fe2+ content was approximately two times better than that of samples exposed to a solution with a high initial Fe2+ content. Fatigue tests in a solution with high Fe2+ concentration and low stress range did not fracture within the period of testing, and consequently, results are not included in the graph.
Evolution of pH and Fe2+ concentration
The Fe2+ and pH (Fig. 4) analysis revealed, for corrosion fatigue tests, that the trend of pH evolution followed deviations in Fe2+ concentrations as a direct consequence of changing the HCO3 − concentration in the solution. An increase in Fe2+ concentration, up to the maximum concentration of ∼1400 mg L− 1 (pH 6.3), took place when exposing samples to the solution with low initial Fe2+ content (Fig. 4a and c).
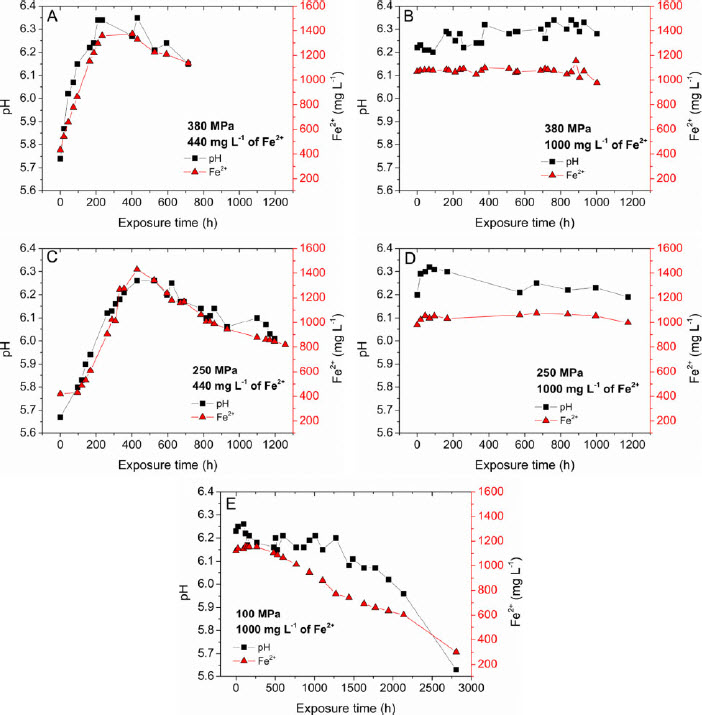
pH and Fe2+ development as function of exposure time for corrosion fatigue tests performed at 1 bar CO2 and stress range of 380 MPa (a and b), 250 MPa (c and d) and 100 MPa (e) with solutions with initial Fe2+ of 440 mg L− 1 (a and c) and 1000 mg L− 1 (b, d and e)
However, depending on the applied stress range, the maximum Fe2+ concentration and the maximum pH were reached after ∼210 h (Fig. 4a) for the high stress range and after 430 h (Fig. 4c) for the medium stress range. Further exposure decreased the Fe2+ content to its final value of 1100 mg L− 1 (pH 6.15) for the high stress range and 800 mg L− 1 (pH 6) for the medium stress range.
In the corrosion fatigue test in the solution with high initial Fe2+ concentration at high and medium stress range (Fig. 4b and d respectively), the Fe2+ content was relatively constant during the experiments (∼1100 mg L− 1). The pH was also relatively stable at a value of 6.2 ( ± 0.1) at both stress ranges. For the test performed at the low stress range, the Fe2+ concentration started decreasing after ∼480 h of exposure, reaching the final concentration of 300 mg L− 1.
Corrosion scale analysis
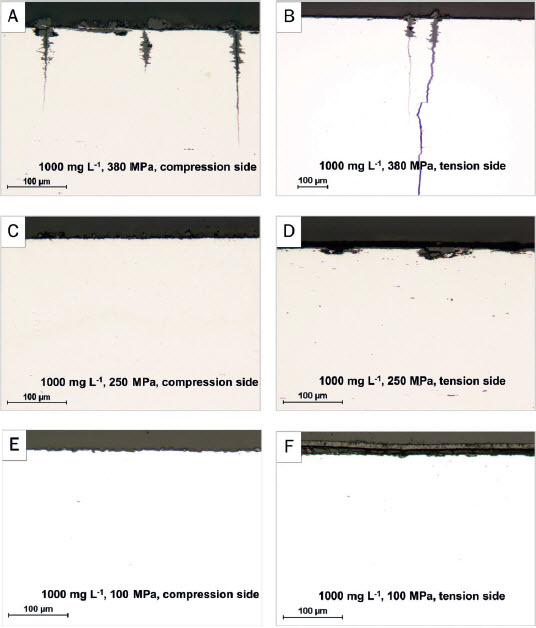
Figure 5 shows top view and cross-section images of scales formed in corrosion fatigue tests in solutions with high initial Fe2+ concentration. Depending on the stresses present in the two sides (tensile or compressive), different morphologies of corrosion scales were apparent. The corrosion product formed on the compression side of the samples tested at high and medium stress range (Fig. 5a and c) was not continuous and not well adherent. However, the top surface scale analysis (Fig. 5b and d) revealed a compact scale with a rough surface topography for samples tested at both stress ranges. This indicates that due to the poor adhesion, the spallation of the corrosion scale, seen in Fig. 5a and c, might have occurred during the metallographic embedding process. When testing samples at the low stress range, the corrosion scale formed on the compression side was also poorly adherent and porous (Fig. 5e).
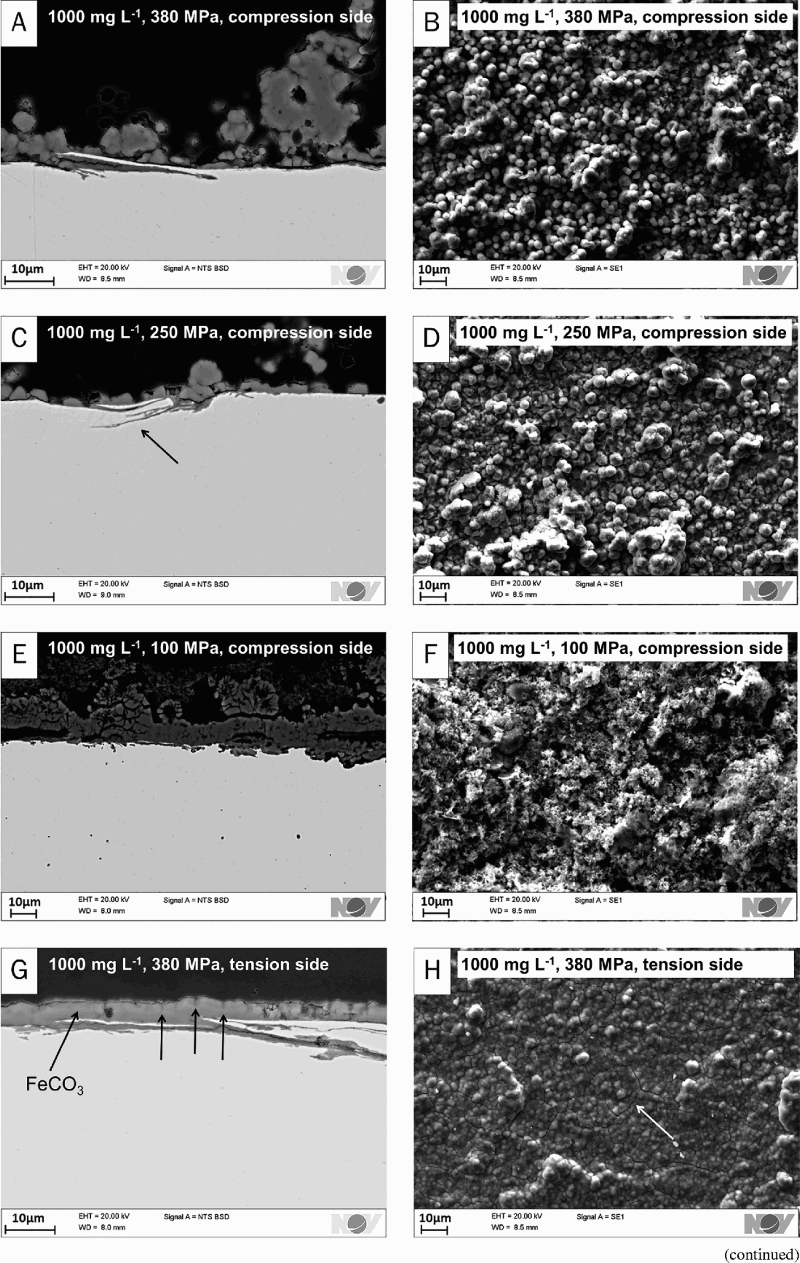
SEM images of corrosion scale build-up during fatigue test in sea water saturated with 1 bar CO2 and initial Fe2+ of 1000 mg L− 1; images present corrosion scales developed on compression and tension side at 380, 250 and 100 MPa
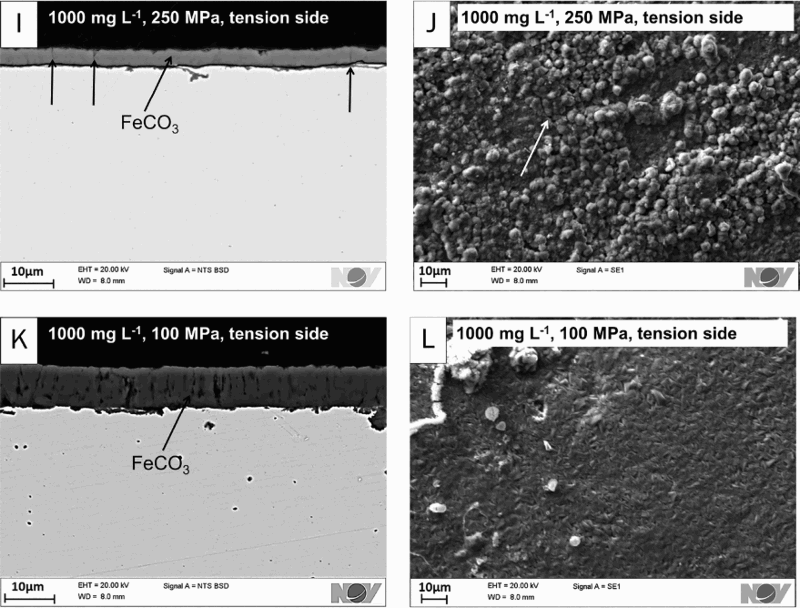
Scales formed on the tension side of the samples (Fig. 5g, i and k) were continuous and covered the whole surface of the samples at all stress ranges. The thickness of the corrosion scale was ∼5 μm at the high stress range, ∼3 μm at the medium stress range and ∼9 μm at the low stress range. The XRD results showed that at all stress ranges, an iron carbonate (FeCO3) film was formed (see Fig. 6a–c). XRD analysis revealed also cementite (Fe3C) peaks. However, based on the homogenous morphology of the scales and XRD penetration depth of up to 17 μm, it is believed that Fe3C was measured from the substrate. Surface scale analysis (Fig. 5h, j and l) revealed relatively little topography, and many cracks were observed after testing at high stress range (see arrows in Fig. 5g and h). Fewer cracks in the scale were seen for samples tested at the medium stress range (see arrows in Fig. 5i and j), and the topography that developed on the top of the primary corrosion layer appears to be more rough (Fig. 5j). No cracks were seen in the corrosion scale formed at the low stress range (Fig. 5l), but the scale was not compact and contained pores (Fig. 5k).
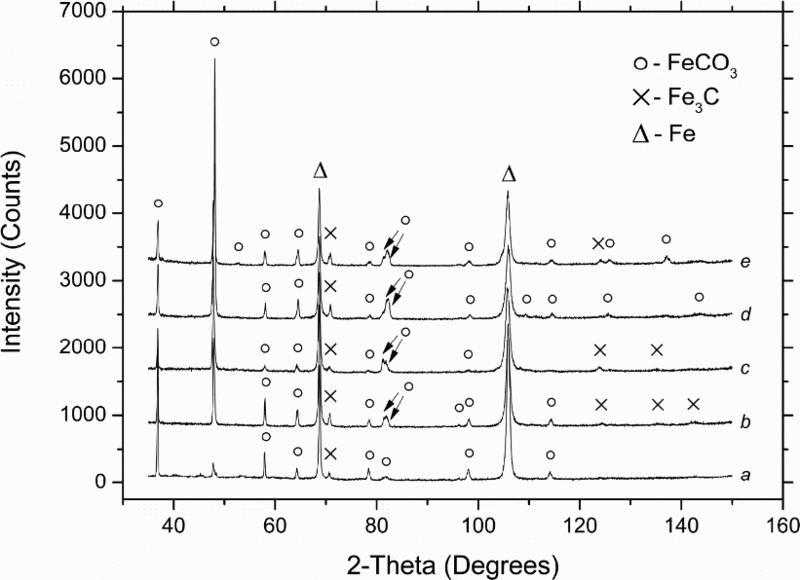
XRD phase analysis for corrosion scales formed on tension side of FSs tested in solution with initial Fe2+ of 1000 mg L− 1 at a 100 MPa, b 250 MPa, c 380 MPa and Fe2+of 440 mg L− 1 at d 250 MPa and e 380 MPa; arrows mark two overlapping peaks representing FeCO3 phase
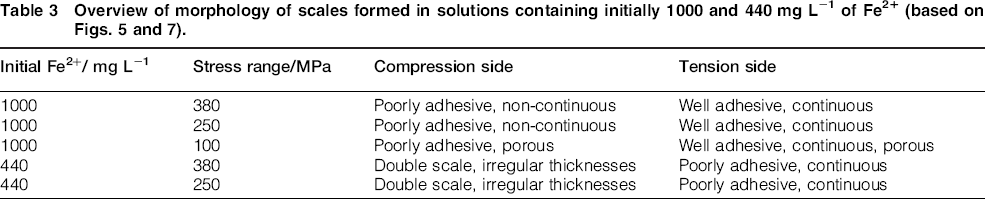
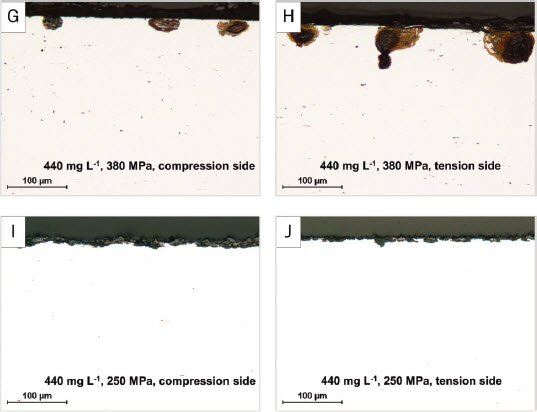
In the fatigue test performed in a solution with low initial Fe2+ concentration, the corrosion scales were seen to have morphologies (Fig. 7) that differed from those formed with high initial Fe2+ content (Fig. 5). Formation of a double scale took place on both sides of the sample and at both stress ranges (Fig. 7a, c, e and g). The corrosion scale consisted of an inner layer integrated with the substrate of the material and an outer layer, which was probably located above the original metal surface (see Fig. 7a). Similarly to the samples tested in solutions with high initial Fe2+ content (Fig. 5g, i and k), a continuous corrosion scale was formed on the tension side of the samples (Fig. 7e and g), while scales with irregular thicknesses were developed on the compression sides (Fig. 7a and c). The XRD results showed that the corrosion scales that formed on the tension side consisted of FeCO3 phase (see Fig. 6d and e). At both stress ranges, the internal corrosion attack was deeper and the thickness of the outer layer was larger on the compression side of the sample than on the tension side (Fig. 7a, c, e and g). The thickness of the outer corrosion scale developed on the compression side as a function of the applied stresses. It was larger at high stress range (6-14 μm) than at the medium stress range (6-10 μm) (see Fig. 7a and c respectively). The corrosion scale showed poor adhesion to the surface on both sides and at both stress ranges. This was apparent from the gap at the interface between the inner and outer parts of the scale formed during metallographic preparation. An overview of the various morphologies of scales formed in solutions with low and high concentration of Fe2+ can be found in Table 3.
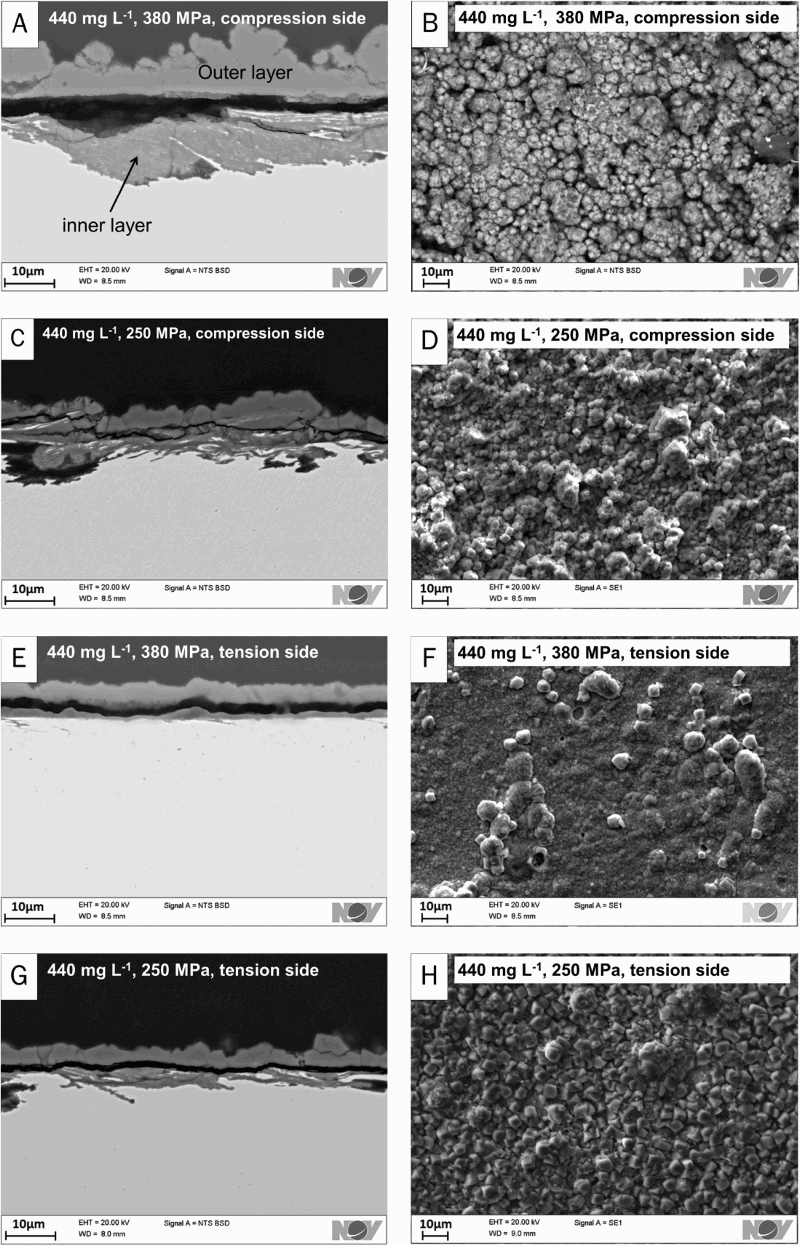
SEM images of corrosion scales built during corrosion fatigue test in sea water at 1 bar CO2 and initial Fe2+ of 440 mg L− 1; images present corrosion scales developed on tension and compression sides for stress ranges of 380 and 250 MPa
Overview of morphology of scales formed in solutions containing initially 1000 and 440 mg L− 1 of Fe2+ (based on Figs. 5 and 7).
Corrosion rates
The corrosion rates for samples exposed to solutions with low and high initial Fe2+ concentration are shown in Fig. 8. Corrosion rates were based on WLCs, which were not subjected to dynamic loading; however, they were exposed together with FS. The exposure time was directly related to the time needed for FSs to fracture and, accordingly, related to the applied stress ranges. The shortest exposure time of 1003 h corresponds to the high stress range, whereas the longest exposure time of 2808 h refers to the low stress range.
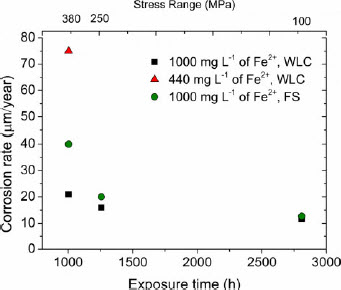
Corrosion rates, based on WLCs, which were not subjected to dynamic loading, and FSs tested dynamically, for tests performed at stress ranges of 380 MPa (1003 h), 250 MPa (1256 h) and 100 MPa (2808 h) in solutions with initial Fe2+ of 440 and 1000 mg L− 1
For tests performed at the high stress range (1003 h), the corrosion rate of WLC was approximately four times larger in solutions initially containing low Fe2+ concentration (75 μm year− 1) than in solutions with high initial Fe2+ content (21 μm year− 1). Further, the corrosion rate for WLC tested in a solution with high initial Fe2+ content decreased with exposure time.
At high stress range (1003 h), in the solution with high initial Fe2+ content, the FS had twice as large corrosion rate (40 μm year− 1) compared to the WLC (21 μm year− 1). The difference in corrosion rate between FS and WLC decreased with decreasing applied stress range. At low stress range (2808 h), both FS and WLC experienced corrosion rates close to 10 μm year− 1.
Crack analysis
Figure 9 presents LOM images of secondary cracks formed in samples tested in solutions with a low and high initial Fe2+ concentration. It was apparent that the depth of the cracks and their appearance depended on the applied stress ranges, induced stresses in the sample and the initial concentration of Fe2+ in the solution.
LOM images of cracks formed for samples tested in corrosion fatigue at stress ranges of 380, 250 and 100 MPa in solutions with initial Fe2+ of 440 and 1000 mg L− 1
For samples tested in a solution with high initial Fe2+ content, sharp cracks were formed at the high stress range on both compression and tension sides (Fig. 9a and b respectively). The depth of the cracks was larger on the tension side (625 ± 364 μm) than on the compression side (104 ± 48 μm) (Table 4).
Depth of cracks, measured on cross-sections (Fig. 9) of samples tested in corrosion fatigue at stress ranges of 380, 250 and 100 MPa in solution with initial Fe2+ of 440 and 1000 mg L− 1
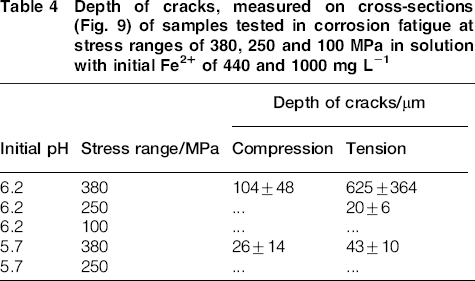
At medium stress range, no cracks were detected on the compression side (Fig. 9c), while blunted cracks, with a depth of 20 ± 6 μm, were developed on the tension side (Fig. 9d). All cracks were filled with corrosion products (Fig. 9a, b and d). No cracks were formed in the sample tested at the low stress range neither on the compression nor on the tension side (Fig. 9e and f respectively). It is likely that as a result of a long exposure time, the uneven surface seen on both sides (Fig. 9e and f) was caused by the uniform corrosion of the sample.
The nature of the formed cracks appeared to be different for samples tested in a solution with low initial Fe2+ content compared to those formed in solutions with high initial Fe2+. For samples tested at the high stress range (Fig. 9g and h), blunted cracks were formed on the compression and tension side of the sample (Fig. 9g and h respectively). This is in contrast to the samples tested in a solution with high initial Fe2+ concentration (Fig. 9a and b), where sharp cracks were observed. The local blunted cracks were deeper on the tension side (43 ± 10 μm) than on the compression side (26 ± 14 μm) of the sample (Fig. 9g and h). At the medium stress range, no cracks were observed and the irregularities of the surface, seen on the compression and tension side, are believed to be caused by the uniform corrosion of the sample.
Discussion
It was shown that by exposing samples to aqueous CO2 environment with various initial Fe2+ concentrations, the fatigue life of samples decreased by factors of 7 (high stress range) and 33 (medium stress range) compared to the air conditions. The reduction of fatigue life in aqueous CO2 environment has been also reported.37,38 It also has been reported 27 that during testing in air, the fatigue rupture is associated with the localised plastic deformation, which leads to a crack development and its propagation. The crack initiation occurs most frequently from stress concentrations at the surface, like at corners or holes, or microscopic features like slip bands.27,29 In the corrosive media, due to the local film breakdown, as a consequence of mechanical and/or chemical effect, or local microgalvanic effect, the localised corrosion (pitting) occurs.27,28,38 Pits work as stress raisers to reach the stress level above the yield strength of the material,27,38 consequently leading to premature fatigue failure, compared to air conditions.
By exposing samples to solutions with low and high initial Fe2+ content, a significant difference in the scale formation was seen when analysing the compression and tension sides of the samples. In solutions with high and low Fe2+ content, a continuous and compact scale was formed on the tension side, while a scale with irregular thickness and poor adhesive properties developed on the compression side. It has been reported49,50 that the compressive stresses may cause spallation of the oxide scale due to buckling or wedging. It is expected that the same phenomenon was seen on the compression side of the samples in the present study. Owing to inducement of compressive strains during dynamic loading, buckling of the scale might have taken place, resulting in its poor adhesion. However, the tension side of the sample showed a continuous corrosion scale in solutions with low and high initial Fe2+ content. It is expected that the tensile stresses caused cracking of the scale but without spallation. This is in a good agreement with the reported results, 49 where no spallation of the scale was seen when applying tensile stresses.
The solubility limit of FeCO3 for 1 bar CO2 at 20°C is 202 mg L− 1. 51 It means that the supersaturation of Fe2+ was present when testing samples in solutions initially containing low concentration of Fe2+, while a highly supersaturated condition was present for tests with high Fe2+ content. Corrosion rate results, which were in a good agreement with the scale analysis, revealed that the samples exposed to the solution with low initial Fe2+ content experienced four times higher corrosion rates compared to the samples tested in high initial Fe2+. The higher corrosion rate of the samples tested with low initial Fe2+ content was most likely due to the lower degree of Fe2+ supersaturation and consequently slower kinetics of FeCO3 formation. 52 Owing to higher supersaturation of Fe2+ seen in the test performed with high initial Fe2+ content, the rate of FeCO3 scale formation was higher, 52 compared to the test executed with low Fe2+. It means that the whole surface was likely to be covered with a protective scale acting as a barrier for inward diffusion of corrosive species reducing the dissolution of the metal.53,54 This was reflected in the low corrosion rates seen for samples tested in solutions with high initial Fe2+ concentration.
It has been reported 51 that in the load free conditions, a decrease in Fe2+ concentration was directly related to a decrease of corrosion rate of samples and is two times faster for solutions initially containing 1300 mg L− 1 of Fe2+ compared to 370 mg L− 1 of Fe2+. This is in contrast to the current results, where a decrease in Fe2+ concentration occurred after 429 h (high stress range) and 523 h (medium stress range) for samples tested in solutions initially containing low Fe2+, while no decrease in Fe2+ concentration was seen when the test was performed with high initial Fe2+. This indicates that even though samples tested with high initial Fe2+ experienced low corrosion rates of 40 μm year− 1 (high stress range) and 20 μm year− 1 (medium stress range), the scale did not become more protective with increased exposure time. Consequently, it is believed that in the corrosion fatigue, not only the kinetics of FeCO3 formation play an important role in ensuring protective properties of the corrosion scale, but also the resistance of the corrosion layer towards applied stresses. Scale analysis revealed formation of a compact corrosion scale with good adhesive properties on the tension side of the samples tested in solutions with high initial Fe2+ content. It is probable that due to a very good adherence of the corrosion scale, tensile stresses induced in the material during fatigue testing could be transferred to the corrosion layer. Owing to lower tensile strength of FeCO3, compared to the steel, breaking of the scale took place, resulting in visible scale cracks that formed at the high and medium stress ranges. Owing to the localised scale defects, mass transfer of corrosive species such as CO3 2 − and HCO3 − to the steel surface and their reaction with the metal substrate, causing slow but constant dissolution of the steel, was possible. This explains the missing decrease of Fe2+ concentration as a function of exposure time. The hypothesis about the negative impact of the stresses on the protective properties of the scale was confirmed by the results from the test performed at the low stress range. Results revealed that when decreasing the stress range to 100 MPa, the concentration of Fe2+ started to decrease already after ∼480 h. It is in a good agreement with the reported results, 51 where in the load free conditions, a decrease of Fe2+ concentration was seen after ∼440 h.
Corrosion scales formed in solutions with low initial Fe2+content revealed poor adhesion to the surface as it was apparent from the gap at the interface between the inner and outer parts of the scale. It is likely that due to the poor contact between the upper layer of the scale and the substrate of the material, the scale was more flexible during fatigue testing. It is therefore expected that the tensile stresses induced in the material were not as easily transferred to the corrosion scale as to the well adherent corrosion layer formed in solutions with high initial Fe2+ concentration. This hypothesis is supported by the top scale analysis, where no scale cracks were revealed. It means that the corrosion scale could become more protective with exposure time, which was reflected by a decreasing Fe2+ concentration.
Analysis of the secondary cracks revealed crack blunting for specimens tested at high stress range in a solution with low initial Fe2+ content. It is believed that the crack blunting occurred due to high initial corrosion rates. As a consequence of the reduction of the stresses at the crack tip, further crack propagation was retarded.27,32,55 This is in contrast to the sharp and up to 10 times deeper cracks developed in solutions with high initial Fe2+ concentration. Owing to too slow corrosion rate, the region around the crack was not corroded away and the crack could propagate deeper.
Based on the secondary crack analysis, samples tested in solutions with low initial Fe2+ content could have shown longer fatigue life compared to the samples tested in high initial Fe2+. However, despite the clear differences in the corrosion rate and crack morphology, they have the same fatigue life at the high stress range. The effect might be attributed to the way in which the stress is applied during four-point bending test. Fatigue testing was performed with a deflection controlled test set-up, and the deflection of the sample was constant during the whole test. Samples that experienced deep and sharp cracks in solutions with high initial Fe2+ content were consequently subjected to a greater reduction in thickness compared to the samples that developed blunted cracks in a solution with low initial Fe2+. By maintaining a constant deflection (δ), throughout the whole test, the stresses induced in the samples depend linearly on the changes of the thickness of the samples based on equation (2).
Owing to deeper cracks formed in samples exposed to high initial Fe2+ concentration, the resulting stresses were smaller than for the samples exposed to solutions with low initial Fe2+. However, the shape of the crack tip played an important factor on the local development of the stresses as well. Owing to the crack blunting seen for samples tested in a solution with low initial Fe2+content, the stress concentrations at the crack tip were less severe compared to the stresses at the sharp crack tip developed in solutions with high initial Fe2+. Accordingly, by combining the changes of the overall stresses due to the thickness reduction of the samples with the local stresses dependent on the shapes of the crack tips, it is likely that the resulting stresses were similar for both samples, which might explain their comparable fatigue life.
Fatigue results from the medium stress range revealed that samples exposed to the solution with low initial Fe2+ had two times longer fatigue life than samples tested in high initial Fe2+. Analysis of the secondary cracks revealed formation of local, blunted cracks on the tension side of the samples tested in high initial Fe2+ conditions. This was in a clear contrast to the sharp and 30 times deeper cracks that developed at the high stress range. As a consequence of the scale cracking, the solution had a local access to the microcracks. Owing to lower stresses and accordingly longer time needed for samples to fracture, the solution had enough time to react with the material, which resulted in blunting of the cracks. Samples tested in a solution with low initial Fe2+ did not reveal apparent cracks, and the uneven surface of the sample is believed to be caused by the corrosion of the sample. The corrosion rate is not known for samples tested at the medium stress range in a solution with low initial Fe2+ content. However, based on the increasing Fe2+ concentration of the solution at the medium stress range, which clearly indicates dissolution of the material, as well as corrosion rates data reported by Rogowska et al., 51 it is expected that samples tested in a solution with low initial Fe2+ had higher initial corrosion rate compared to the samples tested with high initial Fe2+. As a result of lower stresses and higher corrosion rates, it is believed that even though microcracks were formed, they were quickly blunted by the corrosion process.
Owing to shallow blunted cracks that formed in solutions with high initial Fe2+, it is likely that the thickness reduction of the sample did not play a significant role on the stresses induced in the sample. It is therefore suggested that the stresses at the crack tip mostly influenced the crack propagation. The absence of the blunted cracks for samples tested in a solution with low initial Fe2+ concentration resulted in lower local stresses compared to the regions, where local blunted cracks were formed in a solution with high initial Fe2+. It is probable that the crack propagation took longer time for samples tested in a solution with low initial Fe2+, resulting in longer fatigue life compared to the samples tested in a solution with high initial Fe2+.
No apparent cracks were seen for samples tested in a solution with high initial Fe2+ at low stress range, where only uniform corrosion of the surface was seen. Corrosion rate results showed that the effect of stresses on the corrosion rate of samples was decreasing with decreasing stress range. Results revealed that samples tested at low stress range behaved like in load free conditions, which was reflected in a similar corrosion rate of FSs and WLCs. It indicates that the impact of stresses on the protective properties of the corrosion scale was much less severe compared to the effect seen at the high and medium stress ranges. There are no results available between the medium and low stress ranges. It is therefore likely that cracks also would be absent at stress ranges higher than 100 MPa. Results indicate that at low stress ranges (based on the current results < 100 MPa), fast kinetics of scale formation, facilitated by the high initial supersaturation of Fe2+ in the solution, and consequently low corrosion rates, help to avoid local pit formation and will have more beneficial impact on the fatigue life of steel armours. It is in contrast to the solutions with initial Fe2+ concentrations marginally above the solubility limit of Fe2+, where the initial corrosion rate is faster and the surface is rougher, so that higher local stresses are expected.
Most of flexible pipes operate at stress ranges of ∼100 MPa for most load cases. The fatigue life estimated by the corrosion fatigue testing on the laboratory scale at the stress ranges >100 MPa is still conservative compared to the real fatigue behaviour of metal wires in flexible pipes. It was shown that samples tested in a solution with high initial Fe2+ at low stress range experienced the same corrosion rate as samples not subjected to dynamic loading. It indicates that at low stress range, the contribution of the applied stresses to the overall corrosion fatigue behaviour of steel armours is smaller compared to the impact of the corrosive environment. This contradicts the situation at high stress ranges (>250 MPa), where it was shown that the stresses had a larger impact on the protective properties of the corrosion scale, and in order to improve fatigue life of steel armours, high initial corrosion rates are necessary to retard crack propagation. It is therefore believed that the beneficial impact of the initial high supersaturation of Fe2+, seen in the annulus, on the fatigue life steel armours occurs first at the stress range < 100 MPa.
Conclusions
Based on the above results, the following conclusions can be drawn:
The type of induced stresses in the sample, compressive or tensile, influences the morphology of the corrosion scales. A continuous corrosion scale was formed on the tension side, while an irregular corrosion layer was formed on the compression side of the sample. Scale analysis revealed that adhesion of the corrosion scale plays an important role in the resistance of the scale towards applied stresses. Results showed that poorly adhesive scales that formed in solutions with an initial Fe2+ of 440 mg L− 1 had better resistance towards applied stresses compared to well adherent scales formed in 1000 mg L− 1 of Fe2+. Fatigue results showed that there was no effect of the initial Fe2+ concentration on the fatigue life of steel armours at the stress range of 380 MPa. Secondary crack analysis showed that at the stress range of 250 MPa, the initial high corrosion rate of samples in solutions with an initial Fe2+ content of 440 mg L− 1 was beneficial for the crack retardation and, consequently, the fatigue life of steel. Results revealed that the negative effect of applied stresses on the protective properties of the corrosion scale decreased with decreasing applied stresses. Corrosion rate results in relation to the evolution of the Fe2+ concentration showed that the FS at stress range of 100 MPa FS experienced the same corrosion rate as samples not subjected to dynamic loading. It is suggested that at low stress ranges ( < 250 MPa), high initial supersaturation of Fe2+, seen in annulus, reduces the probability of pit formation and consequently might have a more beneficial effect on the fatigue life of steel armours compared to the solutions with Fe2+ content marginally above the solubility limit of FeCO3.
Footnotes
Acknowledgements
The authors would like to acknowledge InnovationsFonden in Denmark for providing financial support of the project.