
Abstract
In the present study, highly porous Ti–Nb–Cu alloy foams were produced by a powder metallurgy method for biomedical implant (hard tissue) applications. Nb was added in order to stabilize the beta-Ti phase. Cu addition enhanced sinterability and reduced the sintering temperature of the alloy. Electrochemical corrosion behaviour of the Ti–Nb–Cu alloy specimens was examined by the electrochemical impedance spectroscopy method in an artificial saliva environment. Effects of porosity of the foam, Cu content of the alloy, pH and fluoride content of the artificial saliva solution on the electrochemical corrosion properties of the specimens were investigated. Mechanical properties of the specimens were also studied by compression tests.
Introduction
Metal foams exhibit a structure similar to cancellous bone. The advantage of the metal foams is their ability to provide anchorage for the surrounding tissue via ingrowth of tissue into their pores. Biomedical implants suffer from mismatch of their Young's modulus with bone.1–5 Ti alloys are used in orthopaedic and dental implant applications (bone screws and plate) because of their high strength to density ratio, biocompatibility and corrosion resistance. However, there are disadvantages such as high Young's modulus and low wear resistance.3–6 Ti has a hexagonal close-packed (α-phase) structure at room temperature that transforms to a body-centered cubic beta structure (β-phase) at 883°C, which can be increased by α-phase stabilizers (Al, O, N) or lowered by β-phase stabilizers (Mo, Nb, Ta, V). The beta-Ti phase has low Young's modulus (close to bone), high wear resistance and biocompatibility.7–13 Nb is non-toxic, biocompatible and a beta-Ti stabilizer.14–16
Cu addition enhances sinterability of the Ti particles, and compacts are sintered at lower temperatures than other Ti alloys. Addition of Cu contributes to easier machining. Cu addition also enhances heat treatment capacity.17–22 As bioinert materials, titanium alloys do not have antibacterial capability after implantation in the jaws, and dental plaques can be identified around Ti dentures. Bacterial colonisation leads to implant loosening through the stages of peri-implantitis, which is defined as ‘an inflammatory process affecting the soft and hard tissues surrounding an osseointegrated implant resulting in rapid loss of supporting bone that is associated with bleeding and suppuration’.23,24 It is important to develop functional transmucosal implant surfaces that inhibit colonisation of the oral bacteria, which involves surface antibacterial activity. 25 Antibacterial activity is affected by surface properties of the implants. Several metal ions (Ag+, Cu2+ and Zn+) were used as antibacterial agents. Among all, Cu represents a more promising element in terms of its lower toxicity and higher biocompatibility. Furthermore, Cu is a metabolizable agent, whereas Ag+ tends to stay in the human body. Ti alloy with Cu addition gains corrosion resistance for dental implants and preserves biocompatibility. The Ti–Cu alloy is considered as a candidate dental implant material with respect to its antibacterial activity and biocompatibility. Antibacterial activity is affected by surface properties of the implants. Poor adhesive strength leads to failing of antibacterial coating, which would result in loss of antibacterial properties. For ion implantation, a thin antibacterial surface is formed, and once this surface is destroyed, the antibacterial property of the implant will disappear. As a result, it is important to develop a material that has antibacterial activity in its bulk structure rather than on its surface.22–25
In the literature, Woldemedhin et al. 26 characterized the surface oxides of Ti–Nb alloys by the electrochemical impedance spectroscopy (EIS) method. Nb content was in the range of 10-20 wt-%. They concluded that a linear relationship between inverse capacitance of the oxide and applied potential proves that the anodic oxide of the alloys acts as a dielectric material. Bai et al. 27 examined the corrosion behaviour of Ti–Nb and Ti–Mo alloys for dental application in saliva solutions with and without the addition of fluoride. They found that the Ti–Mo alloy corroded heavily than the Ti–Nb alloy in fluoride containing saliva. Electrochemical impedance spectroscopy measurements indicated the presence of a double layer of alloys. Rosalbino et al. 28 investigated alloying additions (Ag, Au, Pd and Pt) on the corrosion behaviour of Ti in flouride containing solutions. Open circuit potential (OCP) measurements showed active behaviour for alloys in fluoridated acidified solution due to the presence of hydrogen fluoride (HF) that dissolves the oxide. However, an increase in stability of the oxide is observed for the nobel metal added alloys. Martins et al. 29 studied the effect of Zr addition on corrosion resistance of Ti–30Nb–Zr alloys. They used EIS and polarisation tests. Their circuit model assumes that the oxide on alloys consists of a barrier inner layer and a porous outer layer. Results have shown that Zr additions have improved the corrosion behaviour of the alloy. In contrast, the Ti–30Nb alloy has higher surface reactivity that can induce better osseointegration. Saji and Choe 30 investigated corrosion behaviour of nanotubular Ti–13Nb–13Zr alloy in Ringer's solution. They concluded that the alloy after oxide layer formation exhibited higher current density than the bare alloy.
In the present study, new porous beta-Ti type heat treatable Ti–Nb–Cu alloy foams with antibacterial properties were produced for dental applications. Beta-Ti alloys have low Young's modulus similar to the bone with wear resistance and biocompatibility. Although cast Ti–Cu alloy and powder metallurgy based Ti–Nb alloys have been studied, there is no study on the powder metallurgy based Ti–Nb–Cu alloy foam in the literature. The experimental studies on the corrosion behaviour of the beta-Ti alloy system are also scarce. The aim of the present work was the production of antibacterial Ti–Nb–Cu alloy foams and characterisation of the corrosion properties by the EIS method.
Experimental
Implant production
Foams were produced by the powder metallurgy based space holder method using Ti, Nb and Cu powders (Alfa Aesar, USA). The chemical composition of the Ti powder was 99.61 wt-%Ti, 0.23 wt-%O, 0.018 wt-%N, 0.03 wt-%Fe, 0.01 wt-%Mn, 0.01 wt-%Mg, 0.009 wt-%C, < 0.01 wt-%Al, 0.01 wt-%Cl, < 0.01 wt-%Na and 237 ppm H. Nb powder consisted of 99.8 wt-%Nb, while Cu powder consisted of 99.75 wt-%Cu and 0.10 wt-%O. The morphologies of the Ti, Cu and Nb powders were irregular. Mean particle sizes of the irregular shaped Ti, Cu and Nb powders were 44, 34, and 34 μm respectively. In the alloy preparation stage, 35 wt-%Nb and 3, 5, 7, and 10 wt-%Cu powder were added to the Ti powder.
The space holder method consists of four steps: mixing of metal powder, polymeric binder and space holder (carbamide), compaction of the mixture, removal of the space holder from the green body and sintering. As a space holder, carbamide was chosen for its advantage of ease of removal in water. Weight ratios of the metal powder to the carbamide were calculated to obtain defined porosities in the specimens.
As a space holder, carbamide (Merck, Germany), in the fraction of 710-1000 μm, was used. The binder for green strength was polyvinyl alcohol (PVA). Metal powders were mixed with 1.5 wt-%PVA. Mixtures were compacted at 200 MPa into cylindrical specimens with a diameter of ∼12 mm. Specimens were immersed in water, and then carbamide was leached out. Polyvinyl alcohol was thermally removed at 400°C. Sintering consisted of heating at a rate of 5°C min− 1 to 410°C (debinding) with a dwell time of 40 min, followed by heating at a rate of 11°C min− 1 to sintering temperatures. Specimens were sintered at temperatures between 1000 and 1250°C for 45 min in high purity argon atmosphere in a tube furnace.
Scanning electron microscopy (SEM) images of the porous specimens were used to determine the mean pore size by software. The area of each pore was calculated on the SEM image, and mean equivalent spherical diameter as pore size was determined by using image analyser software (Clemex Vision, PE). Total porosities of the sintered foams were determined from measurements of weights and dimensions of the specimens (geometrical method). Open porosity contents were measured by an Hg intrusion porosimeter (Quantachrome Poremaster). The diameter of the sintered specimens was ∼11.92 mm, and the heights of the specimens were in the range of 16-18 mm. The density and mass of the sintered specimens changed depending on the total porosity. The error in the porosity amount was ∼3-5%.
Artificial saliva preparation
Artificial saliva solution was prepared from chemicals supplied by Merck, Germany.4,31–33 The amounts of the reagents were 0.40 g l− 1 NaCl, 0.79 g l− 1 CaCl2·H2O, 0.40 g l− 1 KCl, 0.005 g l− 1 Na2S·9H2O, 0.78 g l− 1 NaH2PO4·H2O, and 0.35 g l− 1 Urea-CO(NH2)2. In an oral environment, in which pH varies between 2 and 11, F− concentration has effects on implants. There is the increased use of gels containing fluoride to prevent plaque and caries.34,35 In order to determine the effect of fluoride on our specimens, artificial saliva solution with 0.25, 0.50, 0.75 and 1.00 wt-%F− were prepared via NaF addition. pH was adjusted to 2.50, 5.00 and 7.40 by adding lactic acid.
Metal release from the alloys was investigated by static immersion tests in artificial saliva. An inductively coupled plasma mass spectrometer (Thermo Scientific Elemental X Series 2) was used to determine metal ion release. Specimens with 70% porosity were machined, polished and washed respectively. Total porosity and surface area values of the specimens were equal in the static immersion tests. Specimens were then exposed to artificial saliva solution in closed polyethylene bottles. Foams with equal porosity levels were immersed in solution at room temperature for several soaking times up to 14 days. Solution volume to specimen surface area ratio was constant in the immersion tests. A solution without a specimen was used for blank test.
Electrochemical corrosion study
Electrochemical corrosion studies were carried out in the artificial saliva solution using a potentiostat (Interface 1000 Potentiostat/Galvanostat/ZRA, Gamry Instruments Inc., USA) controlled by a personal computer. The volume of the glass corrosion test cell was 1000 mL. A conventional three-electrode system with high-density graphite rod as a counter electrode, a saturated calomel electrode (SCE) as a reference electrode, and specimen as a working electrode was used. Data acquisition was carried out through a computer software (Framework, Version 6.04, Gamry Instruments, USA), while data analysis was carried out by Echem Analyst Software, Version 6.04 (Gamry Instruments, USA). Specimens were prepared by cutting and then mounting into an epoxy resin. The actual surface area of the specimens was obtained by multiplying the total geometrical surface area with the porosity content. The specimens were connected to a copper wire. All experiments were carried out at room temperature. The OCP value of the specimens was measured before carrying out the electrochemical corrosion experiments. The OCP level was measured for durations of 2 to 3 h, until the OCP value was stabilized. The OCP value was considered stable when the OCP curve has an asymptotically stable region. The OCP value was considered stable when the OCP did not change at a rate of 3 mV min− 1 or higher. The potentiodynamic polarisation tests (Tafel curves) were obtained by polarising the specimens from − 250 to +250 mV (versus SCE), with respect to the OCP, at a scan rate of 1.0 mV s− 1. Current density, Tafel slopes, corrosion rate and corrosion potentials were obtained from Tafel extrapolation analyses. In linear polarisation resistance test, the specimens were polarized from − 20 to +20 mV (versus SCE), at a scanning rate of 0.125 mV s− 1, in order to measure polarisation resistance and corrosion rate of the specimens. Corrosion current density i corrwas determined by the Stern–Geary relationship by using the polarisation resistance R and Stern–Geary constant B. B was determined by the polarisation (Tafel) tests. The polarisation resistance R value was calculated from the slope of the potential versus current density plot in the linear polarisation resistance tests. The corrosion rate was calculated by using the i corr, equivalent weight and density of the specimen values.
Electrochemical impedance spectroscopy measurements were started after each specimen reaches a steady-state condition. Electrochemical impedance spectroscopy measurements were carried out in potentiostatic mode, at OCP with a constant voltage perturbation ac sine wave. The potential amplitude of signal was 5 mV. Electrochemical impedance spectroscopy studies were conducted at a frequency range from 100 kHz to 0.001 Hz, with five points per frequency decade. Impedance spectra were fitted by an electrical equivalent circuit model using Gamry, EIS100 software, by a complex non-linear least-squares method. The quality of the fit was described by the average error of regression. Frequency and impedance responses wererecorded.
Characterisation of microstructure and mechanical properties
The microstructure was examined by field emission gun SEM, FEI Quanta FEG 450. Densities were determined from measurements of weights and dimensions of the specimens. Mechanical properties of the specimens were studied by the compression tests performed on a Schimadzu AG-X materials testing machine. X-ray diffraction (XRD) analysis (Rigaku D/Max-2200/PC) was also used in order to characterise the alloys. Surface roughness parameters (average roughness R a, maximum height of the profile R t and average maximum height of the profile R z) of the specimens were also determined (Mitutoyo, Surftest SJ-301).
Results and discussion
Foam structure
Highly porous Ti–Nb–Cu alloy foams were produced by the powder metallurgy based space holder-sintering method. Pore size and pore morphology of the foams replicated the initial size and morphology of the carbamide (space holder) particles, and the mean pore sizes of the foams were ∼450-500 μm, which are suggested as the suitable range of values for biomedical implant (hard tissue) applications.3–5 Figure 1 shows the SEM image of the cracked surface of the sintered Ti–Nb–Cu alloy foam with 70% porosity.
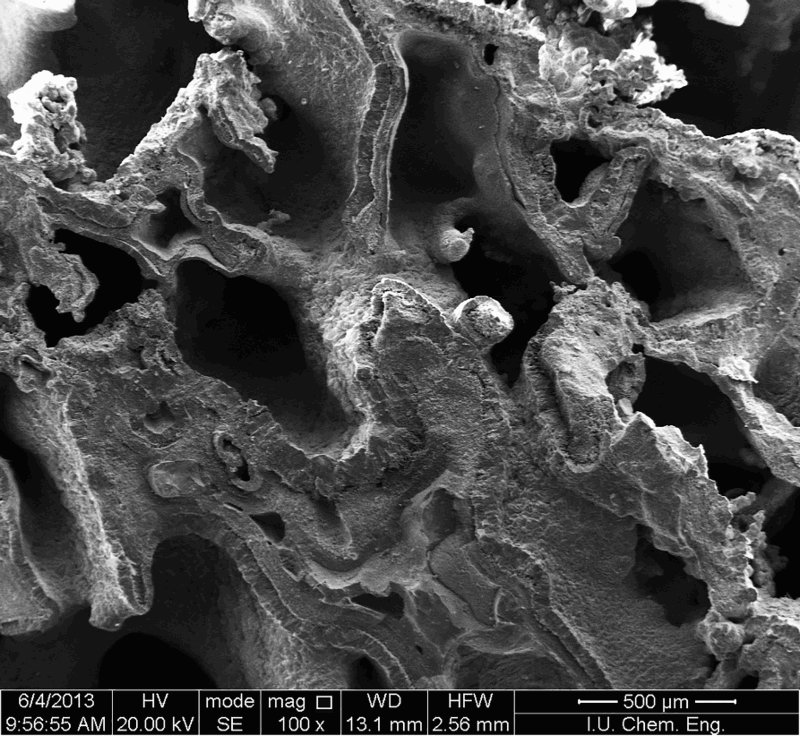
SEM image from cracked surface of sintered foam
Direct current corrosion tests
The potentiodynamic polarisation curves (Tafel curves) were used to examine the electrochemical corrosion behaviour of the specimens. Figure 2 shows the effect of Cu content of the alloy on the Tafel curves. Increasing the Cu content decreased the corrosion potential and increased the corrosion current density of the specimens. Figure 3 illustrates the effect of F− content and pH of the artificial saliva solution on the Tafel curves of the specimens. Decreasing the pH and increasing the F− concentrations decreased the corrosion potential and increased the current density values. For a pH, level of the solution, current density of the specimen increases, while corrosion potential and corrosion resistance of the specimen decrease with increasing F− concentration of the solution. Meanwhile, low pH also leads to an increase in current density and decrease in corrosion potential. Figure 4 shows the effect of Cu content of the specimens on the corrosion rate and polarisation resistance values of the Ti–Nb–Cu alloys. As seen from Fig. 4, polarisation resistance decreased with increasing Cu content, while corrosion rate increased with increasing Cu content of the alloy.
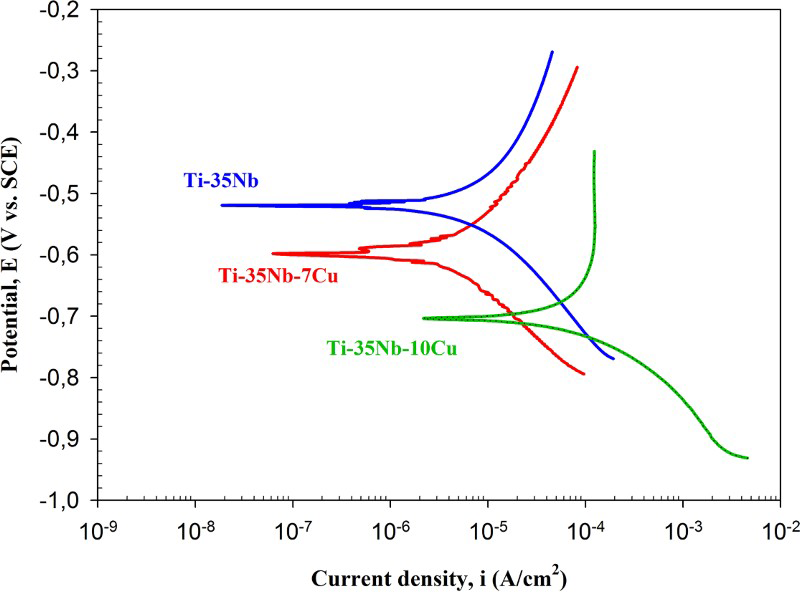
Effect of Cu content of alloy on Tafel curves (pH 2.50, 1.0%F)
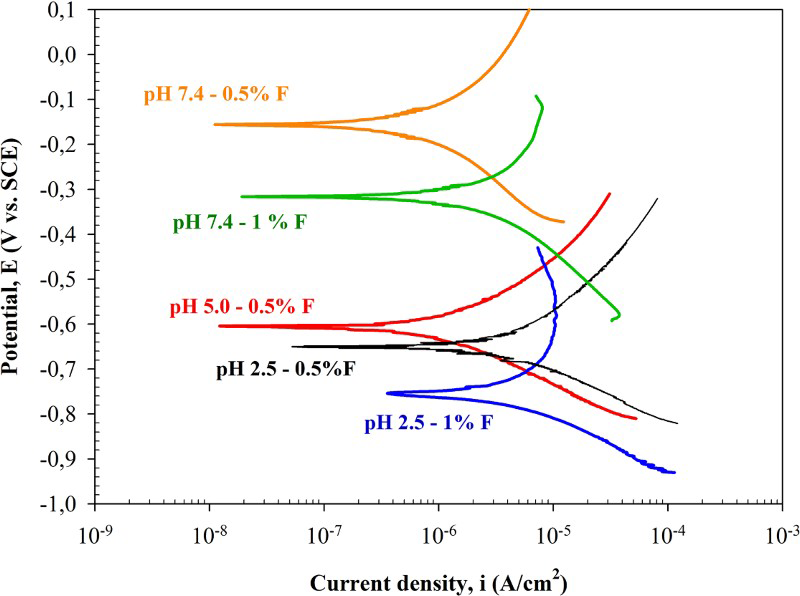
Effect of F− content and pH of artificial saliva on Tafel curves of specimens (10%Cu)
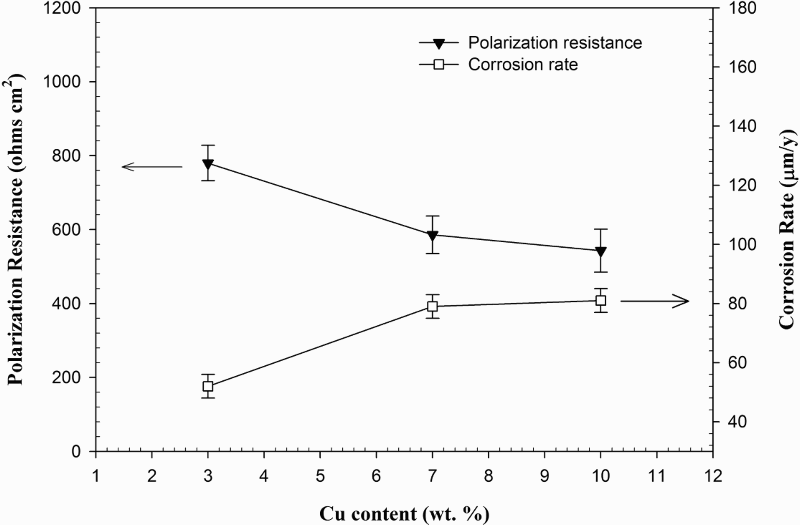
Effect of Cu content of alloy on corrosion rate and polarisation resistance values (at pH 2.50, 10%Cu, 1.0%F)
Electrochemical impedance spectroscopy study
Effect of porosity
Equivalent electric circuit with two time constants is used to analyse the EIS data and to interpret the behaviour of the porous alloy and its surface oxide film. Figure 5 shows the equivalent electric circuit R sol(C pore(R pore(C barrR barr))) to fit the EIS data. The model assumes that the passive oxide layer consists of a barrier-like inner layer and a porous outer layer. R sol represents electrolyte resistance, and the constant phase element C representing the shift from an ideal capacitor is used instead of capacitance. R pore and R barr are resistances of porous and barrier layers that are associated with charge transfer resistance through porous layer and participation of adsorbed intermediates. C pore and C barr correspond to capacitances of porous and barrier layers that are related to double layer formation. Fitting quality of the EIS data is judged by chi-squared χ2 values of ∼10− 6, which indicates a good fitting to the proposed equivalent electrical circuit model. The n values close to one indicate near capacitive behaviour of the passive oxide film. The n value is associated with non-uniform distribution of the current as a result of surface roughness and surface defects.
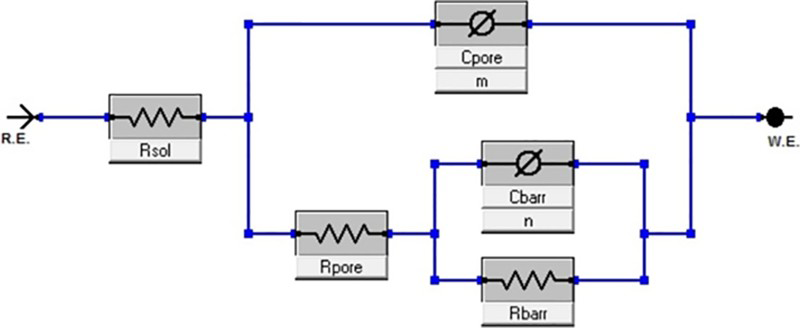
Equivalent electric circuit to fit EIS data
Experimental and simulated impedance spectra of the foams are presented as Nyquist and Bode plots respectively. Figure 6 shows the effect of porosity content on the Nyquist plots of the specimens. Figure 7 shows the effect of porosity on the Bode magnitude and the Bode phase angle plots of the specimens. The Nyquist plot is characterized by a semicircle, indicating the capacitive response of the passive film. The semicircle diameter increased with decreasing porosity. Meanwhile, the lower frequency semicircles in the Nyquist plots probably represent the exposed internal surface area of the foam and increases consistently with an increase in the porosity content. Bode magnitude plots are characterized by two regions. In high frequency, there is a flat portion due to electrolyte resistance. In low frequency, impedance shows a linear slope due to capacitive behaviour. Impedance increases with decreasing porosity due to a defective passive oxide film. Bode phase plots show different behaviours. There are three regions in the Bode phase plots. In high frequency, the phase angle drops towards 0° due to electrolyte resistance. In middle frequency, phase angle remains near − 50° indicating a passive oxide film and its capacitive response. In low frequency, phase angle decreases because of passive film resistance. Phase angle approaching − 90° indicates a passive film and capacitive response. Constant phase angle maximum over a wide frequency range suggests formation of a stable passive film and difficulty in charge transfer.36–38
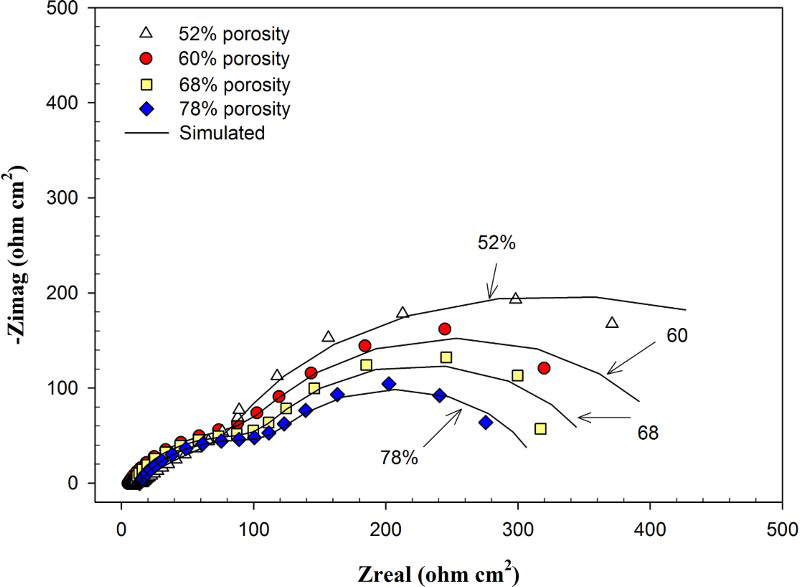
Effect of porosity on Nyquist plots of specimens (pH 2.50, 1.00%F, 10%Cu)
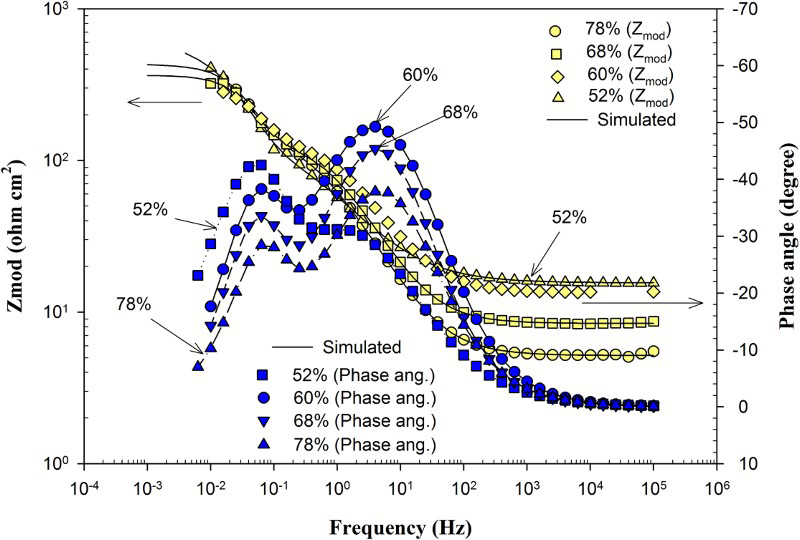
Effect of porosity on Bode magnitude and Bode phase angle plots of specimens (pH 2.50, 1.00%F, 10%Cu)
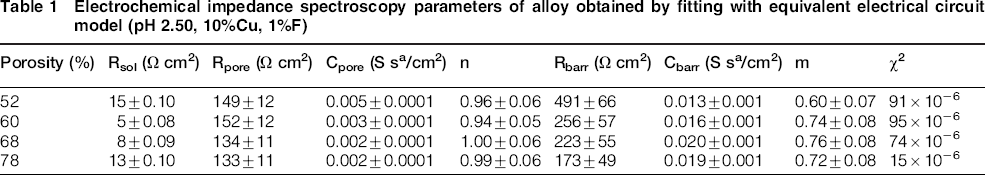
Electrical parameters fitted by equivalent circuit model are listed in Table 1. The specimen with high porosity shows lower R values, which can be confirmed by smaller and deformed semicircles. In addition, lower frequency semicircles in the Nyquist plots represent an exposed internal surface area of the foam and increases consistently with an increase in porosity. Resistances of the inner barrier layer R barr are higher than those of the outer porous layer R poredemonstrating that the inner layer dominates corrosion protection. Capacitances decreased and resistances increased with decreasing porosity content. The passive oxide film becomes more resistive with decreasing porosity.
Electrochemical impedance spectroscopy parameters of alloy obtained by fitting with equivalent electrical circuit model (pH 2.50, 10%Cu, 1%F)
Effect of fluoride content and pH of artificial saliva
Electrochemical impedance spectroscopy measurements were carried out at different F at pH values of artificial saliva. Figure 8 shows the effect of pH of the artifical saliva on the Nyquist plots of the specimens, while Fig. 9 illustrates the effect of pH of artificial saliva on the Bode magnitude and the Bode phase angle plots of the specimens. As shown in Fig. 8, capacitive semicircles were observed in the Nyquist plots of the specimens. The sizes of the semicircles decreased as the pH value of the artificial saliva solution decreased. The Nyquist plot was composed of two semicircles. As shown in Fig. 9, in higher frequency, Bode magnitude plots exhibited constant Z mod, associated with a phase angle near 0°, indicating that impedance was dominated by electrolyte resistance. In low frequency, Bode magnitude displayed a linear slope, due to capacitive behaviour. In the Bode phase plots, in high frequency, the phase angle drops towards 0° due to electrolyte resistance. In middle frequency, phase angle remains about − 50° indicating capacitive response. In low frequency, the phase angle decreases because of the film resistance. As seen from Fig. 9, magnitude values decreased with decreasing pH level of artificial saliva solution. In the Bode phase plots in Fig. 9, the phase angle drops towards 0° in high frequency due to electrolyte resistance. In middle frequency, the phase angle remains near − 50° indicating capacitive response. The phase angle decreased with decreasing pH level of the artificial saliva solution.
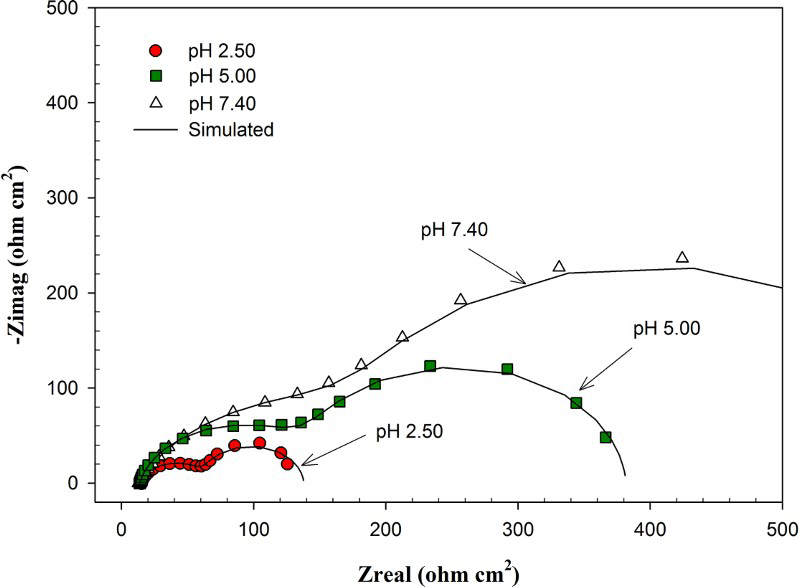
Effect of pH of artifical saliva on Nyquist plots of specimens (1.00%F, 78% porosity, 10%Cu)
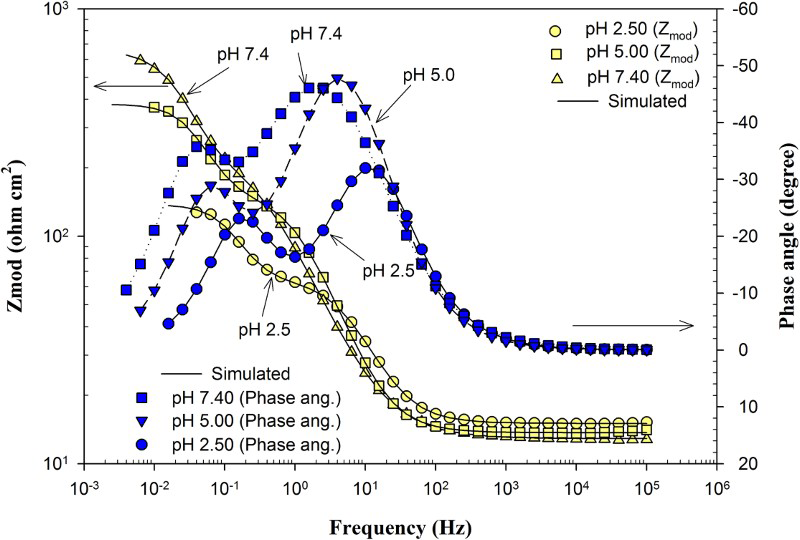
Effect of pH of artificial saliva on Bode magnitude and Bode phase angle plots of specimens (1.00%F, 78% porosity, 10%Cu)
Figure 10 shows the effect of F− content of the artifical saliva on the Nyquist plots of the specimens. Figure 11 illustrates the effect of F− content of artificial saliva on the Bode magnitude and the Bode phase angle plots of the specimens. As shown in Fig. 10, capacitive semicircles were observed in the Nyquist plots of the specimens. The sizes of the semicircles decreased as the F content of the artificial saliva increased. As seen from Fig. 11, magnitude values decreased with increasing F− content of the artificial saliva solution. The phase angle values also decreased with increasing F− content of the artificial saliva.
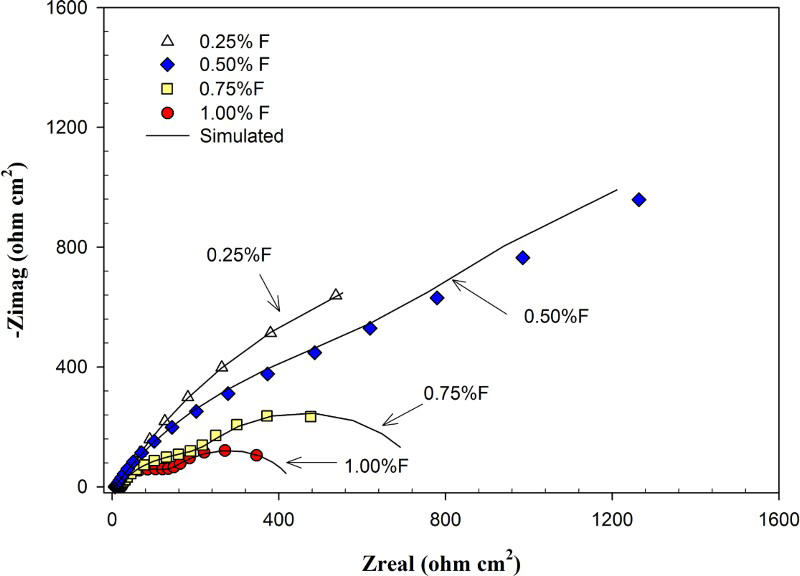
Effect of F content of artifical saliva on Nyquist plots of specimens (pH 7.40, 52% porosity, 10%Cu)
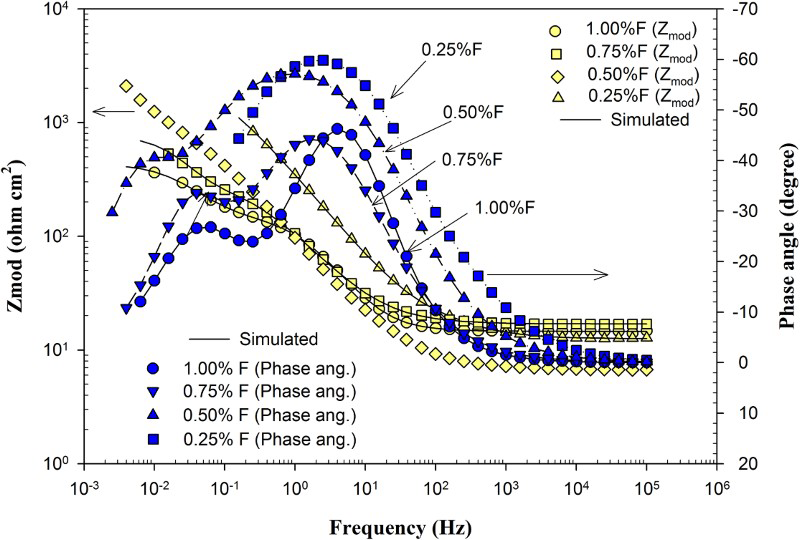
Effect of F content of artificial saliva on Bode magnitude and Bode phase angle plots of specimens (pH 7.40, 52% porosity, 10%Cu)
Dissolution of the Ti is due to the formation of the Ti–F complex. Incorporation of fluoride in the surface oxide film results in the formation of a porous layer. Depending on the concentration of the fluoride and pH, titanium fluoride, titanium oxyfluoride, or sodium titanium fluoride may form. Hydrogen fluoride is responsible for destroying the passive surface oxide film. Once the passive oxide layer is destroyed, regeneration of passive layer is a function of the dissolved oxygen. Electrochemical behaviour of the titanium in F− added acidic solutions was determined by the presence of HF. In low pH conditions, HF leads to destruction of the passive oxide film. There are two kinds of fluoride in solutions, HF and F− . Both can affect the corrosion resistance of the titanium. The porosity of the oxide film is increased by F− and low pH, due to the dissolution.37–41
Effect of Cu content of the alloy
Figure 12 shows the effect of Cu content of the Ti–Nb–Cu alloy on the Nyquist plots of the specimens in the artificial saliva. Figure 13 illustrates the effect of Cu content of the alloy on the Bode magnitude Z mod and the Bode phase angle plots of the specimens. As seen from Fig. 12, diameters of the capacitive open semi-arcs decreased with increasing Cu content of the Ti–Nb–Cu alloy. Electrochemical corrosion resistance of the alloys decreased with increasing Cu content. Higher Cu contents of the alloys lead to Ti2Cu formation. An increase in the Cu content of the alloy induced slightly higher electrochemical corrosion rates. Different corrosion potentials of the Ti and Cu can induce galvanic corrosion. As seen from Fig. 13, magnitude values decreased with increasing Cu content of the alloy. Meanwhile, phase angle values decreased with increasing Cu content of the alloys.
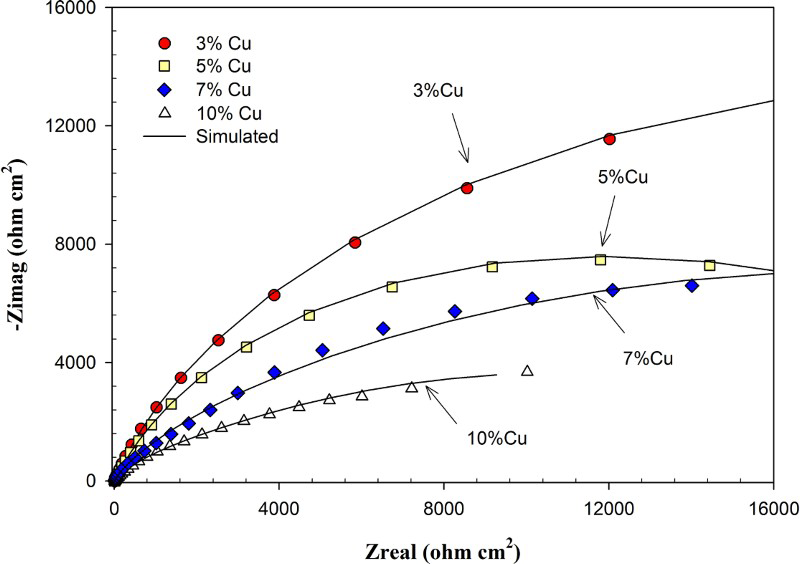
Effect of Cu content of alloy on Nyquist plots of specimens (pH 7.40, 0.50%F, 52% porosity)
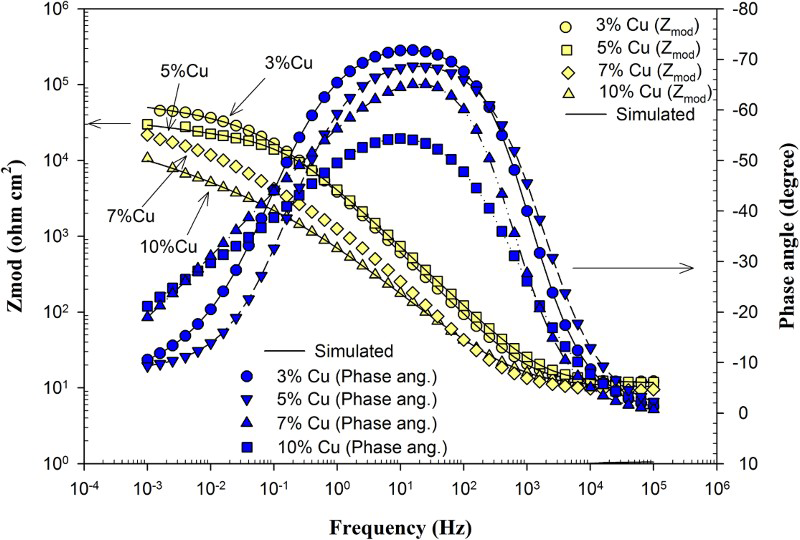
Effect of Cu content of alloy on Bode magnitude and Bode phase angle plots of specimens (pH 7.40, 0.50%F, 52% porosity)
Metal ion release behaviour
Fluoride containing toothpastes and mouth rinses, which are widely recommended for preventing plaque and dental caries, tend to corrode Ti alloy implants or restorations, if they are used in an acidic environment. 42 It is a vital requirement to improve the corrosion resistance and develop the mechanical strength of dental implant materials. Cumulative Cu ion concentration in the artificial saliva solution increased with increasing Cu content of the implant alloy and with immersion time. Ti alloys with high Cu content exhibited higher Cu ion release in artificial saliva. According to the static immersion study, decreasing pH level of the artificial saliva solution had increased the metal (Cu) ion release. Decreasing pH of the artificial saliva solution from 7.40 to 2.50 had increased the Cu ion release from ∼40-50 to 80-100 ppb. In order to determine the effect of F concentration of the artificial saliva, solutions with different F− concentrations were prepared. Increasing F− content of the artificial saliva solution from 0 to 1 wt-% had increased the metal ion (Cu) release. Meanwhile, metal ion release values of the specimens were not higher than reference levels of the ions in human body fluids.21,41 Increased release of Cu with the increased F− concentrations and with the increasing acidic environment indicates a positive influence on antibacterial levels of Cu for the transmucosal implants vulnerable to bacterial contamination. As a bioinert material, titanium alloys do not have antibacterial capability after implantation, and dental plaques can be identified around implanted Ti dentures. Bacterial infections are reason for complications of Ti based implants. Implants with antibacterial activity must be used in order to reduce the infection. The Ti alloy with Cu addition has biocompatibility and corrosion resistance for dental implants. The Ti–Cu alloy is considered as a candidate dental implant material and shows antibacterial activity. 22
Mechanical properties
Cu addition increased the compressive yield strength and Young's modulus of the specimens (68% porosity). Increasing Cu content from 3 to 10 wt-% in the alloys increased the compressive yield strength from 35 to ∼65 MPa, while increasing Cu content from 3 to 10 wt-% increased the Young's modulus of the specimens from ∼1.20 to 1.60 GPa. Cu addition enhanced the sinterability, and the Cu-added compacts were sintered at lower temperatures and times than traditional Ti alloys. Meanwhile, excessive liquid phase formation was observed at sintering at 1200°C or above. Excessive liquid phase formation decreased the mechanical properties of the specimens. Figure 14 shows the effect of Cu content of the alloys on the mechanical properties (compressive strength and Young's modulus).
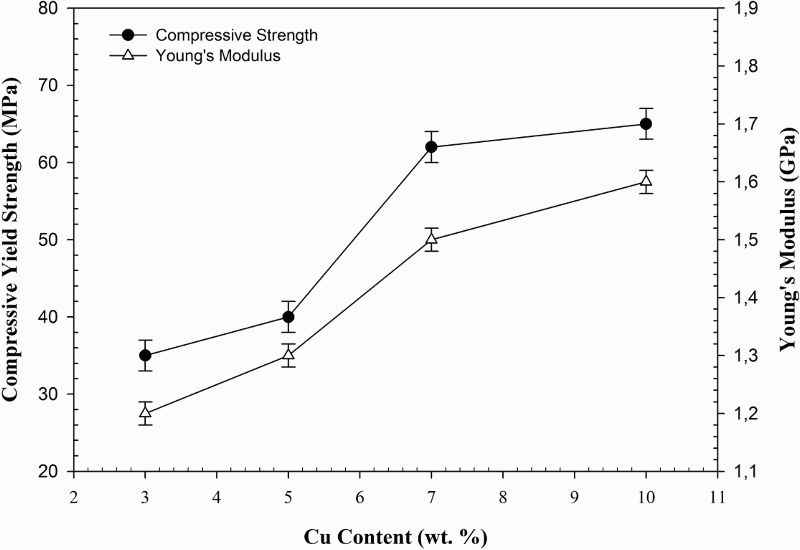
Effect of Cu content of alloys on mechanical properties (pH 7.40, 1.00%F, 68% porosity)
In general, biomedical implant (orthopaedic or dental) materials for load bearing (bone replacement) applications are fabricated to have sufficiently rough surface to increase contact area with the surrounding tissues. Moreover, cell viability is dependent on the surface roughness of the implant material on which the cells are attached. In the present study, the average roughness R a of the specimens was ∼10 μm, which is a suitable value for implant applications. 41 In addition, maximum height R t and average maximum height R z values are measured and found to be 20 and 24 μm respectively.
X-ray diffraction study
Figure 15a–d show the XRD patterns of the Ti powder, Nb powder, Cu powder and sintered Ti–Nb–Cu alloy respectively. As shown in Fig. 15a, as-received titanium powder consists of alpha titanium phase. The sintered Ti–Nb–Cu alloy mainly consists of alpha titanium. Some oxide (TiO2) was also formed on the surfaces of the sintered Ti–Nb–Cu specimens as shown in Fig. 15.
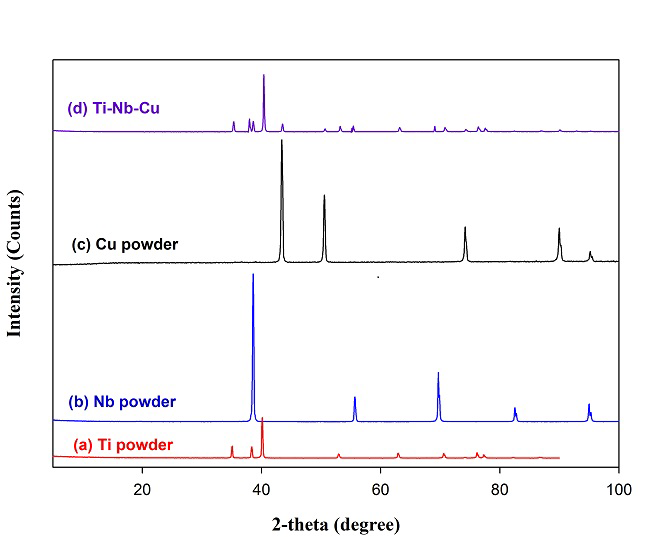
XRD patterns of a Ti powder, b Nb powder, c Cu powder and d sintered Ti–35Nb–10Cu alloy
Conclusions
Low elastic modulus beta-type antibacterial Ti–Nb–Cu alloy foams for dental hard tissue implant applications were produced by a powder metallurgy technique. Cu addition enhanced the sinterability, and Cu-added compacts were sintered at lower temperatures than the traditional Ti alloys, due to the low melting point of the alloy. Experimental and simulated impedance spectra of the foams are presented as Nyquist and Bode plots. The EIS results indicated that the passive oxide film formed on the surface of the foam is a bilayer structure consisting of an outer porous layer and an inner barrier layer. Electrochemcal impedance values of the barrier layer were higher than the porous layer demonstrating that the inner barrier layer ensured the foam with a good electrochemical corrosion resistance. Increased fluoride concentration of the artificial saliva solution reduces its electrochemical corrosion protection behaviour. Fluoride ions attack the alloys, and the severity of this attack depends on its concentration and pH level of the artificial saliva. Electrochemcal corrosion resistance of the specimens decreases at high F concentrations and at low pH levels. Electrochemical corrosion behaviour of the foam is dependent on its porosity content. With decreasing porosity of the specimens, corrosion resistance decreased. Electrochemical corrosion resistance of the alloys decreased with increasing Cu content. Diameters of the capacitive open semi-arcs in Nyquist plots decreased with increasing Cu content of the alloy. Decreasing pH and increasing F− concentration of the artificial saliva decreased the corrosion potential and increased the corrosion current density of the specimens according to the dc corrosion tests. Meanwhile, decreased corrosion resistance of the Ti–Nb–Cu alloy by F− attack and Cu content may be used as an advantageous path to provide continuous antibacterial activity for the bulk structure of dental implants in avoiding the adherence of the periodontopathogen bacteria.
Footnotes
Acknowledgements
This work was partially supported by TUBITAK, Project no. 214M438. This work was also partially supported by Scientific Research Projects Coordination Unit of Istanbul University, Project no. 42922.