
Abstract
Plasma electrolytic oxidation (PEO) coatings were formed in silicate based electrolytes without and with the addition of sodium tungstate on AA 6063 aluminium alloy. Microstructure, composition and corrosion resistance of PEO coatings were investigated by scanning electron microscopy, X-ray diffraction and electrochemical impedance spectroscopy and potentiodynamic polarisation test respectively. The effects of additive sodium tungstate were examined. The results showed that the additive containing PEO coatings were of dense structure with additional phase (WO3) and of less cracks than the additive free PEO coating. In addition, additive containing coatings were of better corrosion resistance than the additive free PEO coating, which was confirmed by electrochemical impedance spectroscopy and potentiodynamic polarisation tests. Furthermore, long time immersion test revealed that the PEO coated alloy with the addition of 12 g L− 1 sodium tungstate maintained high impedance over 82 h in 3.5 wt-%NaCl, while the PEO coating without additive was unable to protect the substrate after such long time immersion.
Keywords
Introduction
Owing to their advantages of high strength/weight ratio, proper corrosion resistance and light weight, aluminium alloys have received great attention in various systems, such as machinery and transportation, especially in aerospace and automobile products. 1 Unfortunately, aluminium alloys are susceptible to corrosion, which greatly limit their applications, especially in some adverse service circumstance. Therefore, it is necessary to improve surface properties and corrosion resistance of these alloys by surface treatments.
Plasma electrolytic oxidation (PEO), also referred as microarc oxidation (MAO), microplasma oxidation and microarc discharge oxidation or anode oxidation, has attracted considerable attentions as a surface treatment technology for valve metals (Al, Mg and Ti) and their alloys to form ceramic coatings on the surfaces.2,3 The process of PEO is carried out at voltages higher than the breakdown voltage of the gas layer enshrouding the anode. Since the substrate alloy is connected to positive pole of the rectifier as anode, the gas layer consists of oxygen. The coating formed on the substrate alloy was of crystalline or amorphous phases, formed at breakdown sites, usually contains constituent species derived from the substrate and the applied electrolytes. Specifically, when the dielectric gas layer completely covers the anode surface, electrical resistance of the electrochemical circuit surges and the process continues, provided that the applied voltage is higher than that of the breakdown voltage of the gas layer. Applying such voltages leads to formation of electrical discharges through which electric current could pass gas layer. Alternatively, PEO technique can produce thick and hard alumina coatings on the aluminium alloy substrate at bulk material temperature lower than 373 K by plasma discharge in aqueous solutions. 2
According to the previous report, 4 the PEO process is a multifactor controlled process, and the properties of PEO coatings can be influenced by many factors, such as the nature of substrate material,5–7 electrolytes composition8–12 and concentration, 13 electrical parameters,7,14–16 temperature,17,18 oxidation time19,20 and additives.21–23 To obtain the ideal coatings, many investigations on the factors that influenced coating properties have been carried out in recent years, especially in the domain of additive. It has been demonstrated that the addition of different additives to the base electrolyte system leads to marked changes in surface structure, composition and electrochemical characteristics of PEO ceramics coatings. 24 Recently, MAO coatings formed in the additive sodium tungstate (Na2WO4) containing alkaline electrolytes are of interest because of their catalytic, semiconducting 25 and corrosion resistant properties. 26 Li et al. 26 proved that Na2WO4 can significantly improve the corrosion resistance of the PEO coatings formed in silicate based electrolytes. The report of Tseng et al. 27 indicated that the influences of sodium tungstate concentration on the properties of MAO coatings can be attributed to the increase in the working voltage at the microarc discharge stage with increase in sodium tungstate concentration in silicate hypophosphite electrolytes. However, these studies lack a fully investigation on the corrosion process of MAO coatings formed in sodium tungstate (Na2WO4) containing alkaline electrolytes.
Hence, in the present study, PEO of AA 6063 aluminium alloy was conducted in NaSiO3 based electrolytes containing Na2WO4. Corrosion resistance of PEO coatings with the additive formed on AA 6063 aluminium alloy was studied by potentiodynamic polarisation test and electrochemical impedance spectroscopy (EIS). Electrochemical impedance spectroscopy was used to fully investigate the corrosion process of MAO coatings formed in NaSiO3 based electrolytes containing Na2WO4. Corrosion resistance of the coated alloy was confirmed by long time immersion test. Further, microstructure and compositions of the coatings were also studied by scanning electron microscopy (SEM) and X-ray diffraction (XRD).
Experimental
Material, specimens and PEO treatment
The substrate material used in this study was AA 6063 aluminium alloy [Al–(0.45-0.90)Mg–0.35Fe–(0.2-0.6)Si–0.10Cu–0.10Mn–0.10Cr–0.10Zn–0.10Ti (wt-%)] for PEO treatment. The commercially oblong specimens of the alloy substrate with a size of 30 × 25 × 3 mm were grounded by abrasive paper up to no. 1800 grits and ultrasonically cleaned in pure ethanol for degreasing, then cleaned by distilled water and dried in hot air. A schematic map of the alloy substrate is shown in Fig. 1. Before PEO process, samples were etched in 4.5 mol L− 1 nitric acid (HNO3) for 30 s, rinsed in distilled water for 30 s, then immersed another 30 s in 3.75 mol L− 1 sodium hydroxide (NaOH) solution and finally rinsing in deionised water for 30 s. Silicate based aqueous solution [Na2SiO3 (6 g L− 1)] + KOH (4 g L− 1)] was used as the main alkaline electrolytes; the additive Na2WO4 ranged from 0 to 12 g L− 1 with 3 g L− 1 intervals. The PEO device consisted of a pulse 30 kW bipolar power supply (DSM30F) made by Haerbin Disi Numerical Control Equipment Co. Ltd; a stainless steel vessel was used as the electrolytes container, a cooling system and a stirring system to keep temperature below 303 K in all the cases. The oblong specimen was installed as the anode and immersed in the electrolytes, which could not touch the bottom or wall. The cylindrical barrel with electrolytes served as the cathode. In order to ensure proper electrical contact, a threaded hole of 2 mm diameter was made on the centre of the sample, and a thin aluminium rod with external threading was screwed to the sample. Coatings were produced at a constant current density of 25 A dm− 2 and duty cycle of 37.5% for 15 min in the electrolytes. After PEO treatment was terminated, the coated specimen was rinsed in distilled water and dried in ambient air immediately.
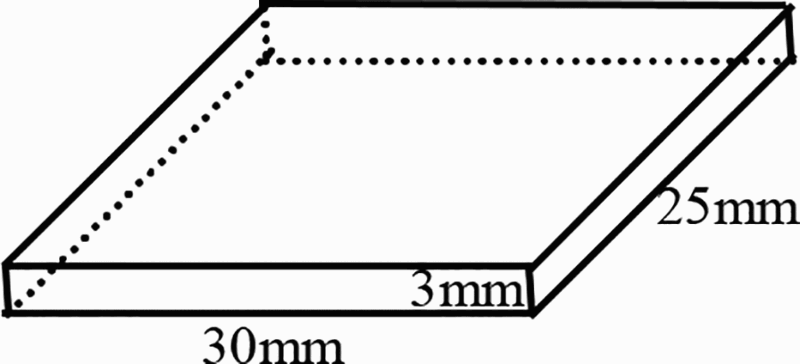
Schematic of AA 6063 aluminium alloy substrate used in this study
Characterisation of coatings
Microstructure and surface morphology of coatings were studied by SEM (ISM-6510). Some of the specimens were cross-sectioned, mounted in resin and polished by standard metallographic abrasive paper for the observation of cross-section morphology of coatings. The coatings were sputtered with a thin layer of Au before SEM inspection. The semiquantitative chemical composition of the coatings were analysed by an energy dispersive X-ray spectroscopy (Link Analytical, Oxford Instruments) incorporated into SEM after Au deposition by sputtering. Phase composition of the PEO coatings were analysed by XRD (Digaku D/max-2500) using Cu K α radiation between 2θ values of 20 and 90° with a step length of 0.02° at a scanning rate of 1° min− 1. The X-ray generator settings were 45 kV and 40 mA respectively. The thickness of coatings were measured by an eddy current based thickness gauge (Time Group Inc.) and checked by cross-section observation.
Potentiodynamic polarisation and EIS
The potentiodynamic polarisation and EIS tests were performed with the three-electrode system. The uncoated and PEO coated specimens were first cut into 1 cm2 and inlaid with resin as the working electrode, a weight saving platinum electrode as the counter electrode and a saturated calomel electrode (SCE) as the reference electrode. All the electrodes dipped in a flask with three necks, which were full of 3.5 wt-%NaCl aqueous solution at a pH of 7 approximately, and the corrosion evaluation system (Electrochemical Workstation, CS350) made by Wuhan Corrtest Instrument Co. Ltd were electrically connected. The working electrode (area, 1 cm2) should be close to the reference electrode to decrease the resistance of the electrolytes in order to lower the inaccuracy of measurement. The coated specimen was exposed to the corrosion medium of 3.5 wt-%NaCl for 30 min to stabilise its corrosion potential E corr. Once the open circuit potential was nearly stable and fluctuating less than ± 5 mV, the potentiodynamic polarisation test was carried out from − 1.2 to − 0.2 V(SCE) at a scanning rate of 1 mV s− 1. The CorShow was the software used to deal with the data of potentiodynamic polarisation. As the corrosion status of the electrode system did not significantly influence by the EIS measurement, it was carried out on the specimen at its corrosion potential. A 10 mV peak to peak amplitude potential signal was selected. Frequency range was from 105 to 10− 1 Hz. After EIS experiment, the obtained data were analysed by software (ZSimpWin 3.10) and fitted with the appropriate equivalent circuit models. Under each testing condition, potentiodynamic polarisation curves and EIS measurement were repeated three to five times in order to guarantee the reliability and reproducibility.
Results and discussion
Characteristics of PEO coatings
Optical appearance
Figure 2 shows the optical appearance of PEO coatings obtained in electrolytes with different concentrations of additive. The colour of PEO coated specimen produced in additive free electrolytes was white grey, like the commonly coatings formed on aluminium alloys in alkaline silicate electrolytes, which was obviously unlike the rest additive containing PEO coatings. The rest coatings presented a tendency toward dark with the increasing additive concentration. It can be inferred that the colour had some connection with the concentration of the additive, which maybe owing to the redox reaction in the PEO treatment and the formation of WO3. Therefore, the 12 g L− 1 additive containing PEO coating was of the darkest colour compared to the others.
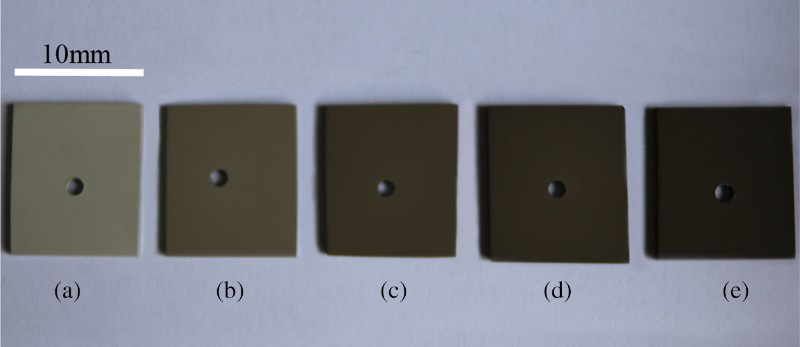
Optical appearance of PEO coatings produced in silicate based electrolytes with a 0 g L− 1, b 3 g L− 1, c 6 g L− 1, d 9 g L− 1 and e 12 g L− 1 additive
Morphology
Surface and cross-sectional morphology of PEO coatings are shown in Fig. 3. Typical morphology of PEO coatings obtained in silicate based electrolytes is presented. All prepared coatings (Fig. 3a–e) were of micropores, and their numbers increased with increasing sodium tungstate concentration. Without the additive sodium tungstate, the coating (Fig. 3a) was relatively rough and with some scattered pores. Pores were of different size ranges (0.5-5.5 μm). The appearance of microcracks were probably owing to the thermal stress and high pressure under the high reaction temperature. Nevertheless, after the addition of the additive, the morphology of PEO coatings underwent a significant change. Smooth and denser ceramic coatings with smaller pores were formed on the substrate, which can be attributed to the abundant oxygen availability for the oxide formation leading to the smooth flow of molten oxide over the surface. Especially for the coating fabricated in 12 g L− 1 additive containing electrolytes (Fig. 3e), the common pores (1.2-4 μm) were distributed homogeneously on the surface. Microcracks were not observed, and a crescent-like pore marked by red circle was presented. These irregular and common pore shapes implied that the discharge types, including fierce, moderate and small, contributed to the formation of oxide coating during the reaction. Obviously, it can be inferred that the corrosion property can be tuned by adjusting the component of electrolytes, and the results showed that the additive would facilitate the formation of coating with less imperfections.
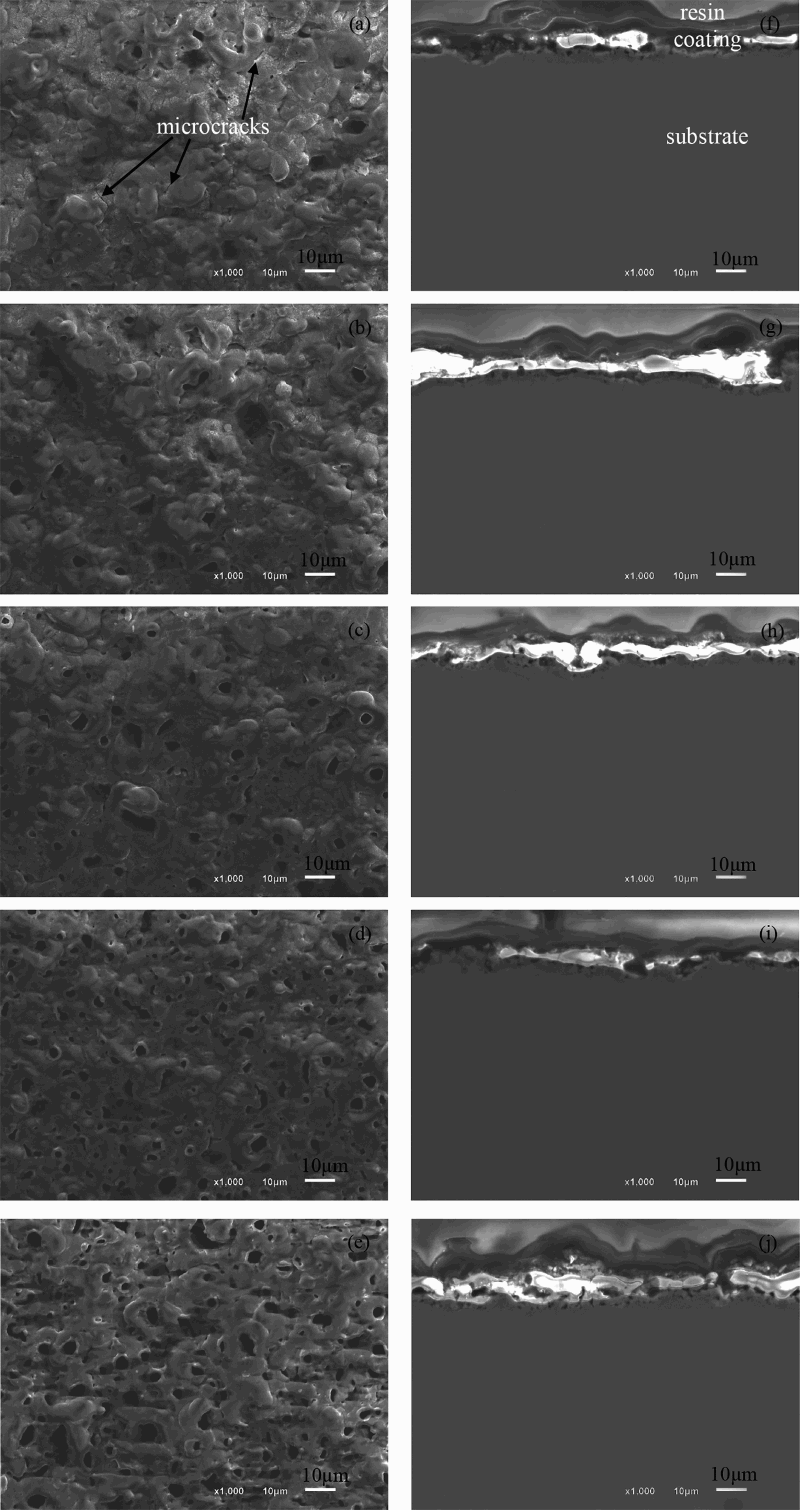
Images (SEM) of surface and cross-sectional morphology for PEO coatings obtained in a, f 0 g L− 1, b, g 3 g L− 1, c, h 6 g L− 1, d, i 9 g L− 1 and e, j 12 g L− 1 additive containing electrolytes respectively
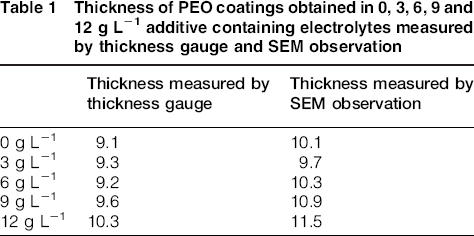
Cross-section morphology of PEO coatings are shown in Fig. 3f–j. It can be seen that the PEO coatings were all tiered structure, i.e. a porous outer layer and barrier inner layer. There were many micropores in the cross-sectional images, which were not connected each other or go through the entire coating, which revealed high bonding strength between the substrate and coatings. In addition, the thickness of PEO coatings measured by an eddy current based thickness gauge and SEM observation is listed in Table 1. From the table, it can be seen that all the coatings were ∼10 μm. The results of the thickness measured by SEM observation were consistent with the results measured by the thickness gauge.
Thickness of PEO coatings obtained in 0, 3, 6, 9 and 12 g L− 1 additive containing electrolytes measured by thickness gauge and SEM observation
Compositions
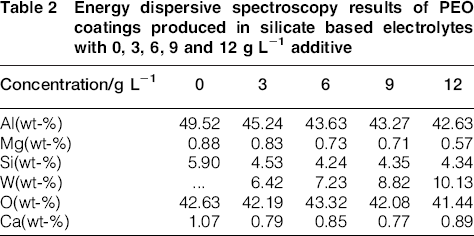
Elemental compositions of PEO coatings formed in silicate based electrolytes without and with additive obtained by energy dispersive X-ray spectroscopy are presented in Table 2. In additive free electrolytes, only Al, Si, O, Mg and Ca signals were detected. After introducing NaWO4 into the electrolytes as the additive, W signal from the sample was existent, which indicated that both the substrate aluminium alloy and species in electrolytes took part in reaction in the discharge channel and contribute to the formation of coatings. In addition, it can be seen that, with the increasing additive concentration, W content increased either.
Energy dispersive spectroscopy results of PEO coatings produced in silicate based electrolytes with 0, 3, 6, 9 and 12 g L− 1 additive
The XRD patterns of PEO coatings are shown in Fig. 4. It clearly showed that the additive free PEO coating was mainly composed of α-Al2O3 and γ-Al2O3. Usually, alumina was formed during the plasma thermal chemical reactions in discharge channels. The α-Al2O3 phase is usually stable with the ranging temperature thermodynamically, while the γ-Al2O3 is metastable. However, the γ-Al2O3 can be transformed into α-Al2O3 when the temperature is up to 1273 K, and it can also be easily formed, either. Therefore, the α-Al2O3 increased with the increment of additive, which corroborated the transformation between α-Al2O3 and γ-Al2O3 (in Fig. 4). Further, after additive incorporation, some peaks corresponding to WO3 were detected. The formation of WO3 was due to the reaction of  ions in the sparking channels, as suggested by Zheng et al.
28
ions in the sparking channels, as suggested by Zheng et al.
28

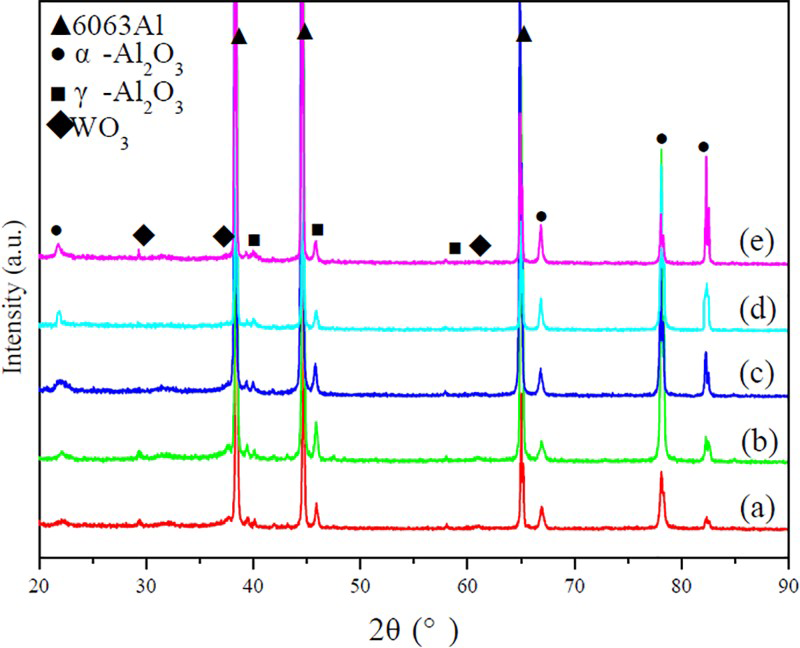
X-ray diffraction patterns of PEO coatings fabricated in a 0 g L− 1, b 3 g L− 1, c 6 g L− 1, d 9 g L− 1 and e 12 g L− 1 additive containing electrolytes
Corrosion resistance of PEO coatings
Potentiodynamic polarisation
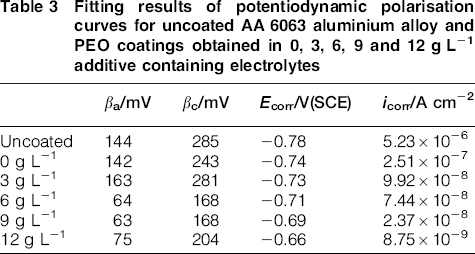
Potentiodynamic polarisation curves of uncoated and PEO coatings without and with the addition sodium tungstate of 3, 6, 9 and 12 g L− 1 carried out in 3.5 wt-%NaCl after an initial time of 30 min immersion are shown in Fig. 5. In a typical polarisation curve, corrosion potential E corr moving to positive direction accompanied by lower current density i corr correspond to lower corrosion rate and good corrosion resistance of coatings. The corrosion potential E corr, current density i corr and related anodic/cathodic Tafel constants βa and βc were extracted directly from the potentiodynamic polarisation curves by Tafel fit method. The determined parameters related to potentiodynamic polarisation curves are listed in Table 3. From Fig. 5 and Table 3, the corrosion potential of PEO coatings without the addition of additive shifted ∼40 mV(SCE) in a positive direction, and meanwhile, the corrosion current density decreased one order of magnitude than uncoated AA 6063 aluminium alloy. However, with the addition of additive, the corrosion potential increased and current density decreased compared with the additive free PEO coating. As the content of additive increased, the polarisation curves moved to the left (lower current density) and upward (more positive corrosion potential), which indicated that the corrosion resistance of AA 6063 aluminium alloy substrate was significantly improved in an alkaline silicate electrolytes with the addition of additive. Therefore, the 12 g L− 1 additive containing PEO coatings exhibited the most superior corrosion resistance, with a corrosion potential and current density of − 0.66 V(SCE) and 8.7 × 10− 9 A cm− 2 respectively.
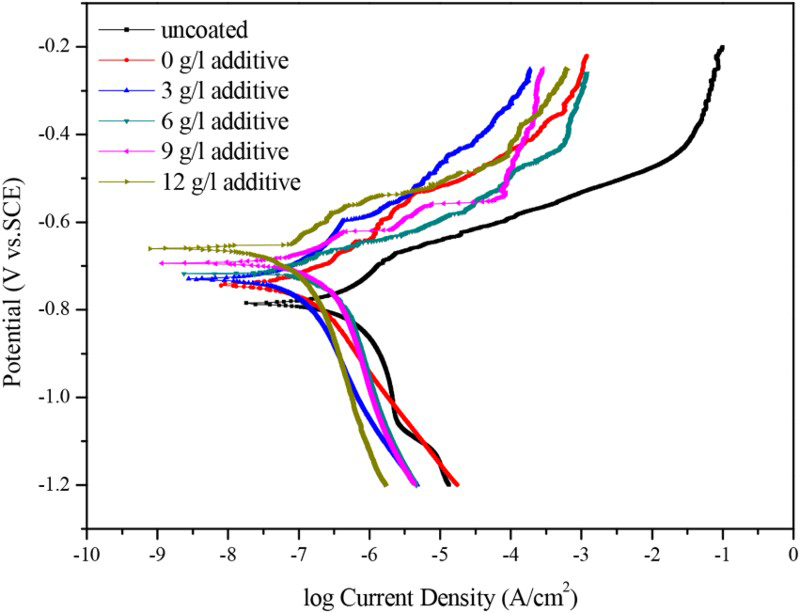
Potentiodynamic polarisation curves of uncoated and PEO coated AA 6063 aluminium alloys in 3.5 wt-%NaCl solution; PEO coatings were obtained in 0, 3, 6, 9 and 12 g L− 1 additive containing electrolytes
Fitting results of potentiodynamic polarisation curves for uncoated AA 6063 aluminium alloy and PEO coatings obtained in 0, 3, 6, 9 and 12 g L− 1 additive containing electrolytes
Electrochemical impedance spectroscopy analysis
In order to understand the quantitative corrosion behaviour of PEO coating system, the EIS tests were carried out to provide detailed information on the corrosion process at the electrolyte/electrode interface and the property changes of the electrode, which is quite important to understand the corrosion mechanism of coating system.
29
The EIS (Nyquist and Bode) plots for uncoated and PEO coated AA 6063 aluminium alloy are shown in Fig. 6. Obviously, on Fig. 6a, PEO coated AA 6063 aluminium alloys showed a large capacitive loop in the mid–high frequency, and the diameter of capacitive loop was enlarged with the increasing additive concentration in silicate based electrolytes. Meanwhile, the impedance (in Fig. 6b) of uncoated AA 6063 aluminium alloy substrate was much more negative compared with that of the PEO coatings. Specifically, the impedance of the uncoated AA 6063 aluminium alloy ranged from 10 to 104 Ω cm2 at low frequencies, while the PEO coatings ranged up to 105 Ω cm2 above in the same frequencies (Fig. 6b). Nevertheless, it suggested that the resistance of AA 6063 aluminium alloy substrate was increased by at least one order of magnitude through PEO treatment, i.e. the concentration of additive was directly proportional to the corrosion resistance of the PEO coatings, which corroborated the potentiodynamic polarisation test. Bode phase angle plot (Fig. 6c) showed that two time constants, which correspond to a two-layer structure, i.e. the outer porous and inner barrier layer,30,31 were required to fit the EIS results of PEO coated AA 6063 aluminium alloy. Besides, the equivalent circuit model was established in Fig. 7a to analyse the EIS results based on a reasonable fitting of the experimental values. In the model, R s stands for the solution resistance between specimen and reference electrode, R p is the resistance of outer porous layer (specifically means the resistance of defects, like pores/cracks of coatings) that paralleled with a constant phase element (CPE) Q p and R b denotes the inner barrier layer resistance (including the resistance of the coating/substrate interface) that paralleled with a CPE Q b. The CPE Q represents a capacitive element, which was used to simulate the capacitance behaviour of the coatings and substrate;
32
the admittance of CPE is defined as33,34  . In the formula, j is an imaginary unit (j = − 11/2), and
  is the angular frequency (
 , f being the frequency). The coefficient
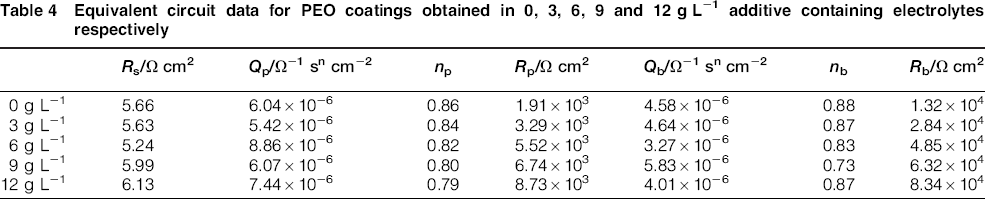
  or n is the parameter of Q. Based on the designate equivalent circuit model, EIS curves were best suited, and the related values corresponding to the symbols are listed in Table 4. It can be seen that both the porous layer resistance R p and barrier layer resistance R b value increased with the increment of the additive concentration in the PEO coatings. However, the value of R p was one magnitude lower than that of R b, i.e. R p and R b were not on the same magnitude. According to the study of Ghasemi et al.,
12
porous layer of PEO coating is inconsequential with respect to corrosion, while the corrosion resistance depends on the compact layer of the coating, which is in direct contact with alloy. This suggested that the overall resistance was mainly provided by the inner compact layer of PEO coatings. A higher R b proved that the additive acted as good barrier and seals the corrosion resistance of the coatings. In view of the morphology/microstructure (in Fig. 3a–e) linked to the corrosion resistance of PEO coatings, the pores become smaller and the microcracks were not able to be observed in additive containing PEO coatings (Fig. 3b–e) compared with those of the PEO coating without additive (Fig. 3a). Therefore, it can be concluded that the additive sodium tungstate improved the corrosion resistance of PEO coatings against corrosive environment, which may be attributed to the abundant oxygen availability for the oxide formation leading to smooth surface with less defects.
or n is the parameter of Q. Based on the designate equivalent circuit model, EIS curves were best suited, and the related values corresponding to the symbols are listed in Table 4. It can be seen that both the porous layer resistance R p and barrier layer resistance R b value increased with the increment of the additive concentration in the PEO coatings. However, the value of R p was one magnitude lower than that of R b, i.e. R p and R b were not on the same magnitude. According to the study of Ghasemi et al.,
12
porous layer of PEO coating is inconsequential with respect to corrosion, while the corrosion resistance depends on the compact layer of the coating, which is in direct contact with alloy. This suggested that the overall resistance was mainly provided by the inner compact layer of PEO coatings. A higher R b proved that the additive acted as good barrier and seals the corrosion resistance of the coatings. In view of the morphology/microstructure (in Fig. 3a–e) linked to the corrosion resistance of PEO coatings, the pores become smaller and the microcracks were not able to be observed in additive containing PEO coatings (Fig. 3b–e) compared with those of the PEO coating without additive (Fig. 3a). Therefore, it can be concluded that the additive sodium tungstate improved the corrosion resistance of PEO coatings against corrosive environment, which may be attributed to the abundant oxygen availability for the oxide formation leading to smooth surface with less defects.
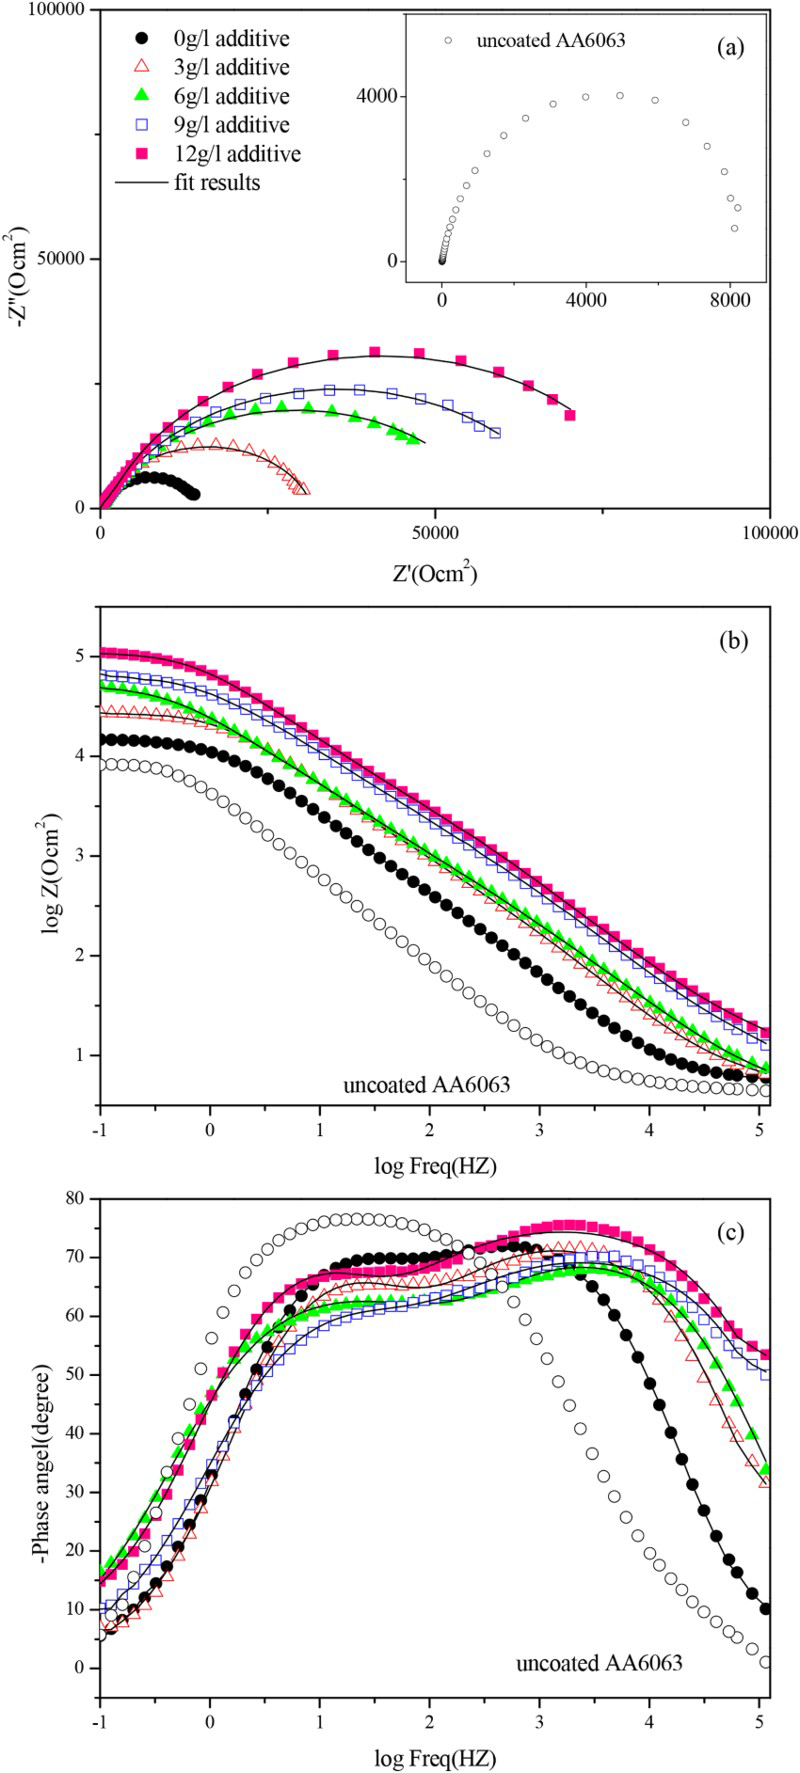
a Nyquist and b, c Bode plots of uncoated and PEO coated AA 6063 aluminium alloy obtained in 3.5 wt-%NaCl solution; PEO coatings were obtained in 0, 3, 6, 9 and 12 g L− 1 additive containing electrolytes; fitting equivalent circuit is shown in Fig. 8a and symbols correspond to experimental values
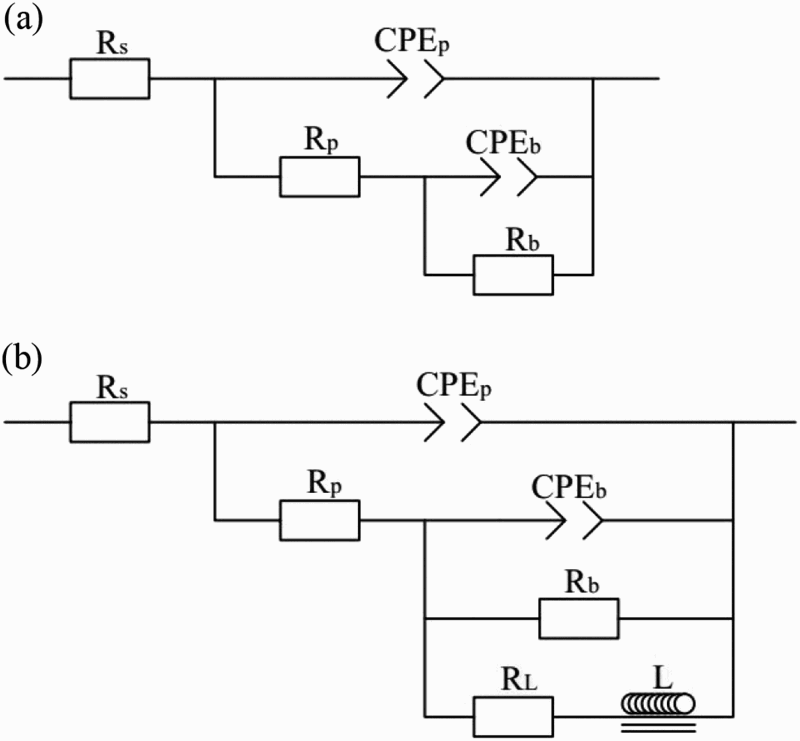
a two time constant model; b three time constant modelCorresponding equivalent circuits for fitting impedance data of PEO coated 6063 Al alloy
Equivalent circuit data for PEO coatings obtained in 0, 3, 6, 9 and 12 g L− 1 additive containing electrolytes respectively
To further study the corrosion resistance of the coatings, EIS test was carried out after 82 h of immersion in 3.5 wt-%NaCl for PEO coatings without and with additive. The evolution of Nyquist and Bode plots of PEO coatings obtained in 0, 3, 6, 9 and 12 g L− 1 additive containing electrolytes is presented in Fig. 8 as a function of immersion time. The Nyquist plot (Fig. 8a) of additive free PEO coating presented two capacitive loops in mid–high frequency and an obviously inductive loop in low frequency after 82 h of immersion, which was very different to that of the PEO coatings with additive, especially for the 12 g L− 1 additive containing PEO coating. The appearance of inductive loop suggested that the corrosive NaCl electrolyte has infiltrated through the PEO coating and reached the substrate of 6063 Al alloy, i.e. the additive free PEO coating was insufficient to protect the alloy substrate after 82 h immersion in 3.5 wt-%NaCl. But for the additive containing PEO coatings, there was no sign of inductive loop, which meant that the additive containing PEO coatings were of the ability to protect the alloy substrate by slowing down the penetration of aggressive Cl− after 82 h of immersion. Furthermore, the SEM image of PEO coated samples obtained in 0, 3, 6, 9 and 12 g L− 1 electrolytes after 82 h exposure to 3.5 wt-%NaCl presented in Fig. 9 showed that a big pit (rolled by pink circle) and many clearly cracks were observed (Fig. 9a) on additive free PEO coating, which confirmed the EIS test. For PEO coatings with additive, there was no significantly big pit, especially for 12 g L− 1 additive containing PEO coating. For inductive behaviour of 82 h immersion PEO coating, another equivalent model, which contained the inductance L and R L, was proposed (Fig. 7b). 8 On the other hand, the impedance (Fig. 8b) of additive containing PEO coatings was much more positive than additive free PEO coating. More specifically, the 12 g L− 1 additive containing PEO coating was still of high impedance (>104), which was much higher than that of the PEO coating without additive. Thus, those results suggested that PEO coating with additive sodium tungstate showed an improved corrosion resistance.
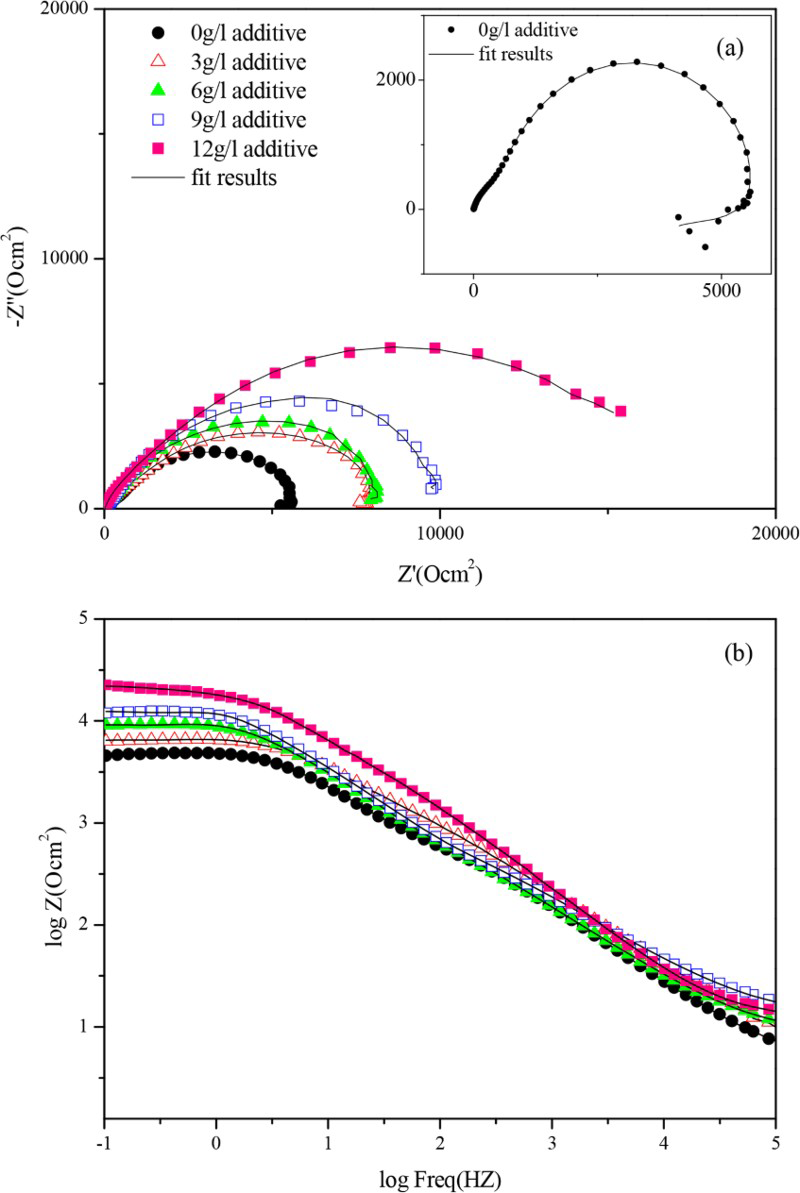
a Nyquist and b Bode impedance plots of PEO coated AA 6063 aluminium alloy in 3.5 wt-%NaCl solution after 82 h exposure; PEO coatings were obtained in 0, 3, 6, 9 and 12 g L− 1 additive containing electrolytes; fitting equivalent circuit is shown in Fig. 8
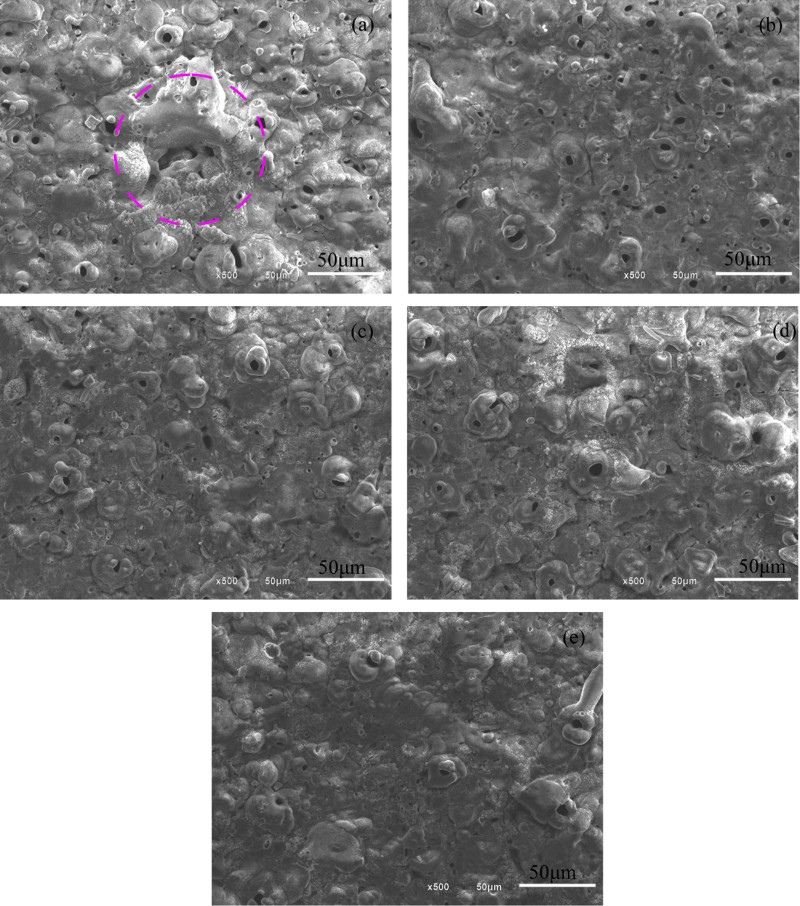
Images (SEM) of surface morphology for PEO coatings obtained at a 0 g L− 1, b 3 g L− 1, c 6 g L− 1, d 9 g L− 1 and e 12 g L− 1 additive containing electrolytes after 82 h of immersion in 3.5 wt-%NaCl; big pit was observed and marked by pink circle
Conclusions
Plasma electrolytic oxidation coatings formed on AA 6063 aluminium alloy with addition of varied concentrations of Na2WO4 have been investigated. The microstructure, composition and corrosion resistance of PEO treated specimens were studied. The following conclusions can be drawn.
The additive was of positive influence on the PEO coatings. Plasma electrolytic oxidation coatings with the additive were of less defects with additional phase (WO3) than that of the additive free PEO coating. Addition of sufficient Na2WO4 in PEO coating bath increased impedance of the coated alloy. Such coated alloy also showed a reduction of anodic and cathodic current density by one order. Plasma electrolytic oxidation coating without additive was not capable to protect the alloy substrate after 82 h exposure to 3.5 wt-%NaCl, which was proved by EIS test and corroborated long time immersion test. However, additive containing PEO coatings was still of capacity for protecting the substrate from the permeation of aggressive Cl− , especially for the 12 g L− 1 additive containing PEO coating.
Footnotes
Acknowledgements
The financial support of the National Natural Science Foundation of China under grant no. 51371039 and the Priority Academic Program Development of Jiangsu Higher Education Institutions (PAPD) are gratefully acknowledged.