
Abstract
Sulphur corrosion for nickel alloy 718 was monitored by electrochemical noise under high temperature. Cross-recurrence quantification analysis (CRQA) on potential and current noise signals was used to characterise the stable coupling interaction between them. Diagnosis criterion for stable pitting started was proposed based on the CRQA parameter determinism per cent trajectory. The proposed method displayed accurate and robust characteristics compared to the common localisation index.
Keywords
Introduction
Oxygen contamination in sour gas wells is a significant problem from a corrosion standpoint. Hydrogen sulphide might be oxidised to elemental S, which is a notorious initiator of pitting corrosion. Sulphur has the greatest impact on corrosion of alloys when it is in intimate contact with the alloy surface. 1 The adsorbed sulphur could enhance the anodic dissolution, block or retard the growth of the passive film and cause passivity breakdown and pitting by enrichment at the metal/film interface.2,3
Nickel alloy 718 is a high strength corrosion resistant alloy used in downhole equipment. However, it was not recommended to serve in high temperature solution containing sulphur. 4 Severe local corrosion would cause a catastrophic result in sour well environments. Thus, the instant diagnosis for local corrosion at early stage is of great importance for in situ monitoring practice.
Electrochemical noise (EN) technique is a common method to monitor corrosion rate and status without disturbance of the system, especially susceptible to localised corrosion.5,6 Electrochemical noise signals usually showed non-linear chaotic nature in local corrosion process; yet, chaotic analysis method has been applied in the characterisation of EN time series,7–9 among which recurrence plots (RPs) are useful for graphical representation of multidimensional dynamic structure.10,11 The RP method was introduced to visualise the time dependent behaviour of the dynamic system based on phase space reconstruction theory, which represents the recurrence of the m-dimensional phase space trajectory. Some real corrosion process such as intergranular corrosion, crevice corrosion, pitting corrosion and corrosion fatigue crack initiation were characterised by RPs.12–15
Although RPs visually represent the randomness and deterministic feature of the time series, the information included is qualitative and hard to process. The recurrence quantification analysis (RQA), which extracts quantitative information from RPs, would give a more exact interpretation for state space.11–13 Usually, a current transient accompanied by a potential transient simultaneously signed a local corrosion event. In consideration of the coupled response of potential and current during a corrosion event, the cross-RQA (CRQA)16,17 between electrochemical potential noise (EPN) and electrochemical current noise (ECN) might extract more effective information concerning corrosion compared to auto-RQA for EPN or ECN only. In addition, EPN and ECN signals arising from a coupled electrochemical corrosion system are sampled simultaneously at the same digitisation rate, which meets the requirement of cross-recurrence analysis. The amplitude difference of these two signals can be filled up by rescaling the input data over the unit interval.
In this work, RQA parameters were calculated successionally along time by the recurrence quantification epochs (RQE) program. The diagnostic criterion for stable pitting time was proposed according to the determinism per cent (%D) parameter trajectory. This is the first attempt to identify the time region when stable pitting started using RQA on EN signals. It might have significance in corrosion monitoring applications.
Experimental
Material and experimental facility
The investigated material was a finish forged bar of alloy 718 produced from our production line. The chemical composition (wt-%) was 18.95Cr–17.79Fe–4.87Nb–3.07Mo–0.99Ti–0.51Al–0.02C– < 0.001S. The specimens were machined to cylinder form with 6.35 mm diameter and 38.1 mm length with an exposed area of ∼7.91 cm2. All specimens were solution and aging treated to meet the mechanical requirement of API standard. 18 Before each test, specimens were ground up 800 SiC abrasive paper manually, degreased by acetone and rinsed by distilled water.
The autoclave was used to supply a high temperature environment. Electrode system was mounted on the autoclave, electrically connected to the Gamry Ref 600 potentiostat and finally the personal computer. A schematic of the EN measurement set-up is shown in Fig. 1. Two nominal identical specimens were used as working electrode and an external cooling Ag/AgCl/0.1M KCl electrode as reference electrode. NaCl aqueous solutions (5 wt-%) with 0.1 g L− 1 sulphur were used as aggressive medium. Test temperatures were set to 100-135°C, and the duration of each test was 24 h.
Schematic of experimental set-up to perform corrosion test and EN monitoring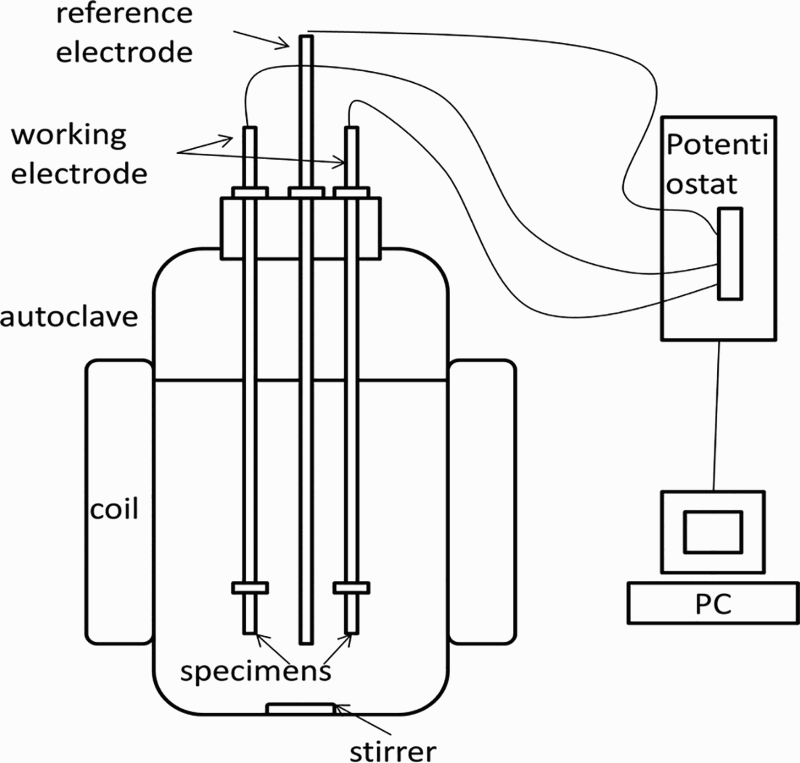
Electrochemical noise monitoring and RQA
Electrochemical current noise was measured between two specimens through a zero resistance ammeter at free corrosion potential, while EPNs were recorded between coupled working electrode and reference electrode simultaneously. Electrochemical noise monitoring was recorded by ESA 410 software with sampling frequency of 20 Hz after an hour when the solution reached the specified temperature.
Recurrence quantification analysis is based on the distance matrix of the vectors constructed by the embedding method. Distances are computed between two different signals in CRQA; thus, cross-recurrence quantification parameters were calculated across the entire plot. The recurrence matrix was represented as11,17

 and
and  are vectors from two time series at time i and j, r is a state dependent cutoff distance (a predefined threshold), ‖√‖ is the norm of vectors, θ(·) is the Heaviside function and N is the number of states. Recurrence per cent (%R) quantifies the percentage of recurrent points falling within the specified distance. Determinism per cent measures the proportion of recurrent points forming diagonal line structures.
All the recurrence analyses in this work were performed by the free software RQA. 19 Parameters selection also obeys the advice of guideline of this software. Recurrence quantifications were calculated on an epoch by epoch basis. Each epoch has 1024 data (corresponding to ∼50 s), which was shifted to 256 data to the later progressively. This was realised by the programs KRQE.EXE and RQE.EXE. The setting RQA parameters were the following: RANDSEQ = n; NORM = Euclidean norm; DELAY = 4; EMBED = 10; RESCALE = absolute; RADUS = 2-5 to ensure a sparse RP; and LINE = 2.
Results and discussion
Electrochemical noise signals
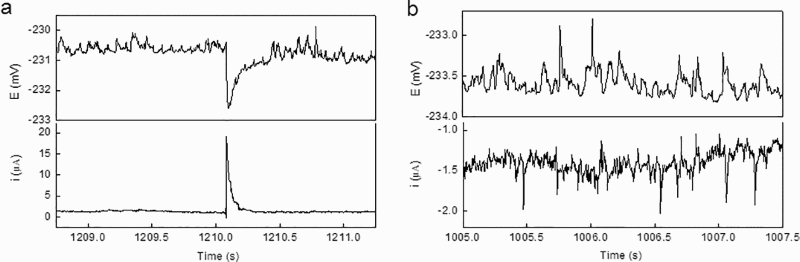
Figure 2 shows monitored EPN and ECN signals during the first 9000 s from tests of 100-135°C. Distinct drifts were observed from EN signals except at 100°C. Some typical transients from the EN signals are displayed in Fig. 3. The transient of positive ECN with negative EPN (Fig. 3a) represents a metastable pitting (passive film breakdown and repassivation) event in general meaning.
20
The adsorption of sulphur on the alloy surface could lead to a rise in electrode potential.2,21 Some positive EPN transient with tiny ECN fluctuation (Fig. 3b) might correspond to sulphur adsorption event or disturbed alloy surface state.
a 100°C; b 120°C; c 135°C Typical transient a with and b without high coupling between EPN and ECN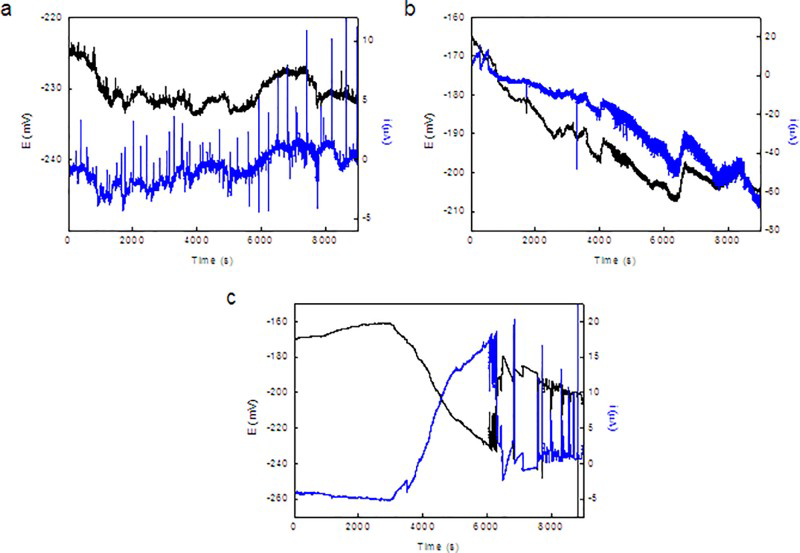
Auto-RQA and CRQA comparison
Figure 4 displays %D parameter by both RQE and KRQE calculation through time at different temperatures. The %D measures the proportion of recurrent points forming diagonal line structures. Determinism per cent contained the information about the duration of a stable interaction, which might be stable localised corrosion in EN signals.
12
In CRQA, %D reflects similarity in a way that the two constituent systems are evolving.
11
Coupled EPN and ECN signals would evolve in a similar fashion when local corrosion event takes place in a short time and lead to a large %D value locally.
a 100°C; b 120°C; c 135°C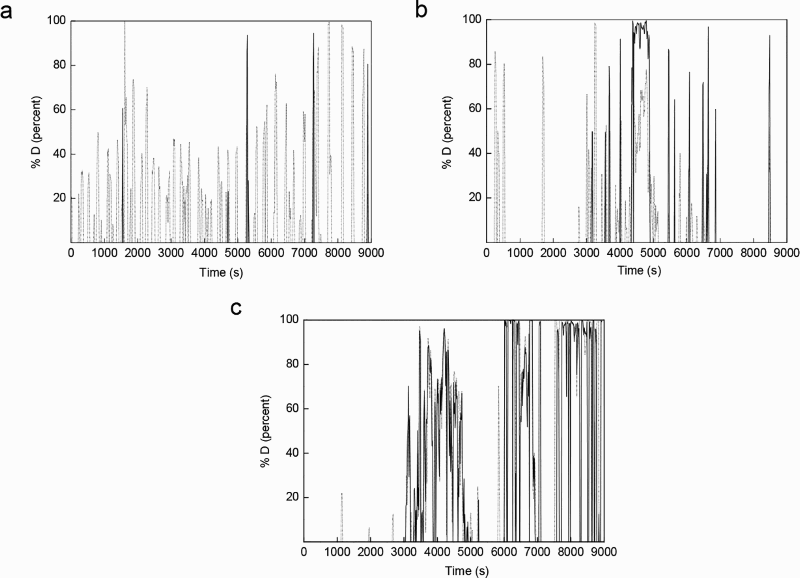
Figure 4 displayed the comparison of %D trajectory calculated by auto-RQE and cross-recurrence quantification epochs (CRQE) method. The distribution of the auto-RQE parameter is more dispersive. Almost major current transients were recorded by auto-RQE for ECN only, while selective current transients, which has strong coupling with potential transient, were recorded by CRQE according to the comparison. Determinism per cent trajectory has the ability to disclose the time region of deterministic event dominated. Cross-RQE could record event of coupled potential and current noise concerning local corrosion, and excluding the process only leads to a single disturbance of current or potential. Thus, the %D parameter from CRQE is more accuracy to indicate a stable local corrosion.
Diagnosis criterion for stable pitting occurrence time
Specimen tested at 120°C had macroscopic pitting as shown in Fig. 5. The specimen tested at 135°C had more severe pitting, while no obvious pitting appeared on the specimen tested at 100°C. Continuous high %D value, which formed ‘transient’ in Fig. 4, characterises the duration of stable interaction. Isolated %D transient that represents metastable pitting often lasted less than three epochs, as shown in Fig. 4. Continuous four epochs of %D with values larger than 50% might be appropriate as diagnosis criterion for stable pitting occurrence in an empirical manner. This criterion means at least 89.6 s stable interaction of coupled current and potential response. According to the criterion, the specimen started stable pitting at ∼4350 and 3456 s in 120 and 135°C tests respectively. No region contained four or more high %D points in the record of 100°C test.
6
Typical pitting morphology on specimen tested at 120°C Continues high %D value (line+symbol) as diagnosis criterion for stable pitting started and corresponding current noise signal (line) a 100°C, isolated transient with 2 points of high %D value; b 120°C, first 4 points region of high %D value begins at 4350 s; c 135°C, first 4 points region of high %D value begins at 3456 s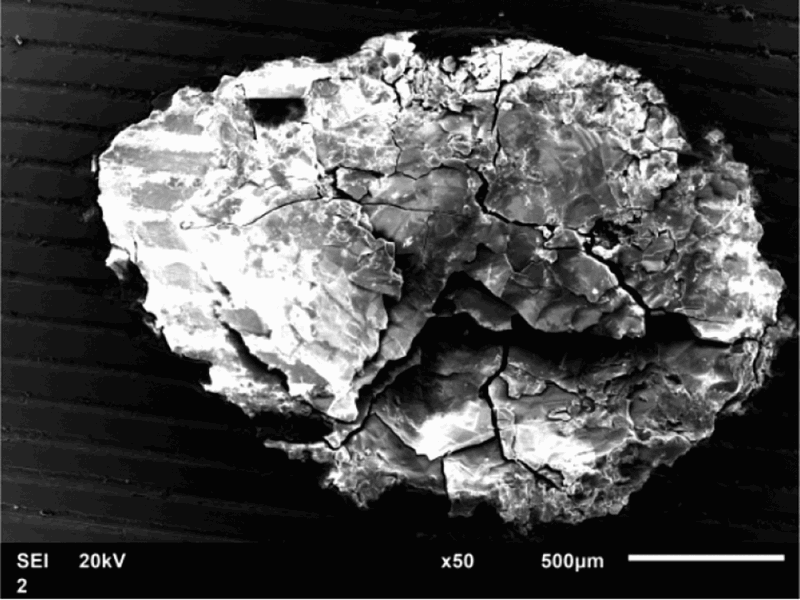
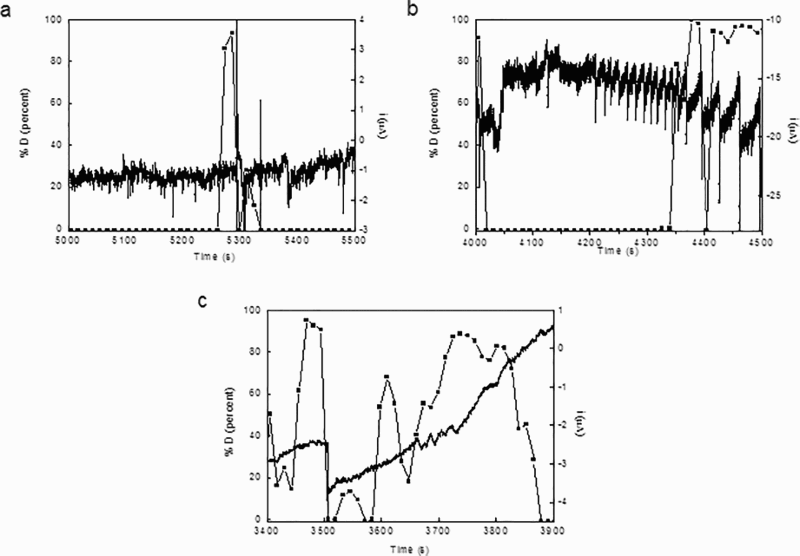
Figure 7 shows the cross-RP covering four epochs during metastable and stable pitting according to the proposed criterion. It is clear that sparse recurrence points distributed in a clustered manner in Fig. 7a, while more regular pattern of recurrence points appeared in Fig. 7b with much diagonal structure. The cross-RPs depict the local dynamic feature of the corrosion system visually. In addition, most of the epochs have very small recurrence point beyond the interval of metastable or stable pitting; thus, seldom pattern would appear in the RPs.
Cross-recurrence plot of EPN and ECN during a metastable and b stable pitting in 120°C test; each plot has 1756 × 1756 points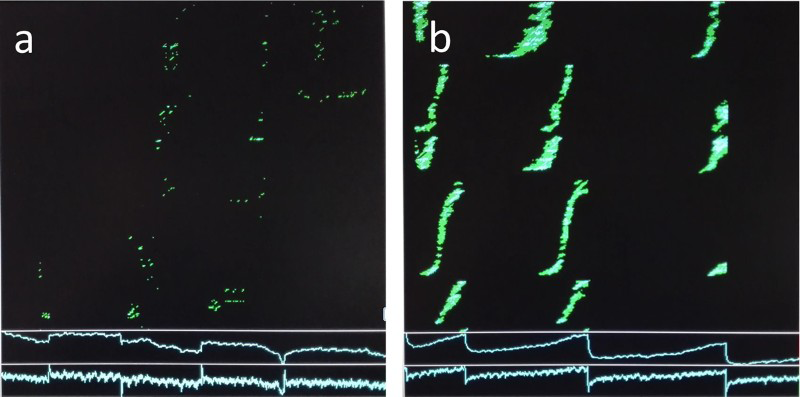
The stable pitting potential value was − 194 mV compared to about − 182 mV during metastable pitting in the 120°C test according to the proposed criterion. The negative potential drift of ∼10 mV gap (similarly in the 135°C test) from metastable to stable pitting transition can hardly be recognised in an unknown corrosion system as a diagnosis criterion. Localisation index (LI) based on the current signal was calculated in a block of 1024 points through time displayed in Fig. 8. The largest LI value appears at the initial stage, while it approaches to zero in the later period in 120°C test. A drift of ECN signal through time may lead to a growing I Rms value and a distorted LI. It is not so reliable to reveal the time window of metastable to stable pitting transition by the LI trajectory also. In a word, the proposed diagnostic criterion based on cross-recurrence analysis is more accurate and robust for stable pitting indication than the existing index based on statistical calculation due to the chaotic nature of EN signals.
Localisation index trajectory during first 9000 s of test a 120°C; b 135°C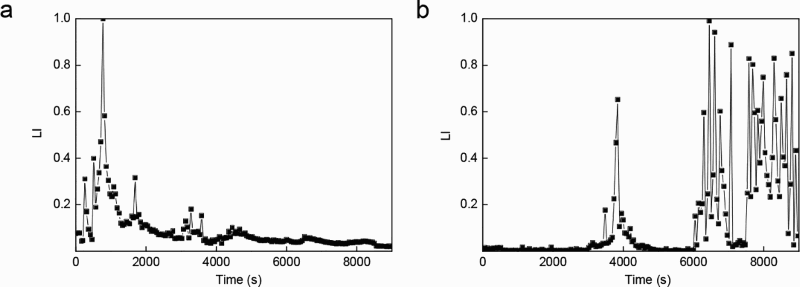
More validation experiments are needed to confirm the criterion based on RQA method. The potential ability to instantly identify stable pitting with theoretic time resolution of ∼1.5 min is of high significance for many applications. Especially, this method is suited to process stationary or non-stationary signals and without additional assumption to be made.
Conclusions
Electrochemical noise monitoring was conducted on sulphur corrosion for nickel alloy 718. Recurrence quantification analysis was used on EN signals to disclose the local deterministic feature through time. Determinism per cent calculated by cross-recurrence quantification on EPN and ECN could give more clear resolution on event corresponding to pitting than auto-RQA only. An empirical diagnosis criterion for stable pitting starting time was proposed according to the %D trajectory, which accord well with the transition region of EN signals.
Footnotes
Acknowledgements
The authors thank Chongqing Materials Research Institute Co., Ltd (CMRI) for the National High Technology Research and Development Program (grant no. 2013AA031005) and the Natural Science Fund of Chongqing (grant no. cstc2012jjA50027).