
Abstract
Many approaches are used to modify the surface topography of implant materials. Some produce unordered surfaces using, for example, classical implant surface treatments, whereas others produce ordered surfaces by micro- and nanopatterning techniques. Surface topographies can be characterised by several methods that can acquire two-dimensional profiles or three-dimensional measurements and calculate different roughness parameters. The importance of using systematically several roughness parameters for correlation with biological response, and of consider these parameters at different scales will be demonstrated. Furthermore, it will be described, from a general point of view, how cells are able to identify and respond to surface topography. The role of membrane receptors, cytoskeleton, filopods and intracellular signal transduction in the response to topography will be considered and discussed. A critical review of more than 300 papers provides the basis for illustrating how mammalian cells respond to surface topography and how their rugophilia, the increased cell response to rougher surfaces, is a function of cell phenotype. For the first time, the rugophilia of cells from different tissue origins is compared in a synthetic table.
Introduction
A variety of processes are used to modify the surface topography of implant materials (e.g. metal, polymers, ceramics) or model materials (e.g. silicon, glass, quartz, PDMS). Some produce unordered surfaces using, for example, classical surface treatments (e.g. polishing, machining, plasma spraying, sandblasting, acid etching, etc.) whereas others produce rather ordered surfaces by micro- and nanopatterning techniques (e.g. hard photo- and electro-lithography, soft lithography). The characterisation of topographies produced by these different processes can be achieved by several methods, from atomic force microscopy (AFM) for the smoother ones to optical and tactile methods for the rougher ones. These methods allow two-dimensional (2D) profiles or three-dimensional (3D) measurements to be acquired from surfaces and the calculation of roughness parameters that can be classified as amplitude, spacing, hybrid and spatial parameters. The importance of using systematically several roughness parameters for correlation with biological response and of considering them at different scales will be demonstrated.
The unavoidable and well established relationship between topography, surface chemistry and surface energy will also be evoked since it is very difficult to modify surface topography without changing the surface chemistry, wettability or surface energy, as is the case in superhydrophobicity.
The present review will also describe, from a general point of view, how cells are able to identify and respond to surface topography and their rugophilia: the phenomenon of increased cell response to rougher materials.
The cellular mechanisms underlying this phenomenon will be detailed, notably the mechanisms underlying cell adhesion and spreading. The role of the membrane receptors, cytoskeleton, filopods and signal transduction will be highlighted. The ability of some cell types to identify surface organisation will be illustrated from recent studies: mesenchymal stem cells have been shown to differentiate more strongly in the osteoblastic lineage on surfaces presenting a nanoscale surface disorder.1
It is well known that cells cultured on anisotropic surfaces with aligned grooves are able to orient and migrate in the direction of grooves. This phenomenon is called ‘contact guidance’. Some cell types with long extensions such as neurons are particularly sensitive to the anisotropy of substrates which in this case can be sought and used to control the growth of neurites from the cell body. Some hypotheses to explain how cells identify the topography are proposed. Generally it is admitted that cells, using their filopodia and focal contacts, are able to identify physical or chemical discontinuities on the surface. These discontinuities can be described as energy barriers that are visible to cells through the uneven adsorption of proteins from biological fluids and the unusual presentation of these biomolecules to cell surface receptors.
Furthermore, observations obtained from experiments done using cells derived from different tissues will be reviewed, to illustrate that cell response to topography is also dependent on the cell’s origin and that it is crucial to consider this when developing biomaterials for various clinical applications. In particular, the use of model cell lines derived from tumours should be avoided for analysing cell response to topography since their abnormal response to topography and their weak sensitivity to strong intracellular modifications imposed by substrate topography have recently been demonstrated. Finally, studies where different cell types are compared on the same topography will be discussed.
Topography
Fabrication methods (Table 1)
The materials used for cell studies are highly variable and can be biocompatible metals (e.g. titanium and titanium based alloys, stainless steel, CoCrMo), ceramics (e.g. calcium phosphate based ceramics, alumina, zirconia) or even polymers (e.g. PMMA, PLGA, PC, PS, PU, etc.). Various treatments are used to develop nanostructural or microstructuctural features on these materials. Some, based on lithography techniques, can be used to develop geometrical structures that can be controlled in term of lateral and height dimensions and morphology. Other processes, such as those used for structuring implant surfaces, produce isotropic rough structures, but with limited control in terms of dimension and morphology (Table 1).
Materials and techniques used to produce nano- and microstructured surfaces for analysing mammalian cell response*
*CaP: calcium phosphate; CIC: cyclic olefin copolymer; CNT: carbon nanotubes; DLC: diamond like-coating; HA: hydroxyapatite; PANCNVP: poly[acrylonitrile-co-(N-vinyl-2-pyrrolidone)]; PBrS: poly(4-bromostyrene); PC: polycarbonate; PCL: polycaprolactone; PDMS: polydimethylsiloxane; PES: polyethersulfone; PLGA: poly-L-lactic/glycolic acid; PLLA: poly-L-lactic acid; P(LLA-CL): poly(L-lactid-co-ϵ-caprolactone); PLLA-TMC: poly-L-lactide/trimethylene carbonate copolymer; PMMA: polymethylmethacrylate; PnBMA: poly(n-butylmethacrylate); PNIPAAm: poly N-isopropylacrylamide; PU: polyurethane; PUA: poly(urethane)acrylate; PS: polystyrene; PVDF: polyvinylidene fluoride; SS: stainless steel; TEGDMA: tetraethyleneglycol dimethacrylate.
Roughness measurement
The following survey of the characterisation techniques and parameters currently used by researchers studying the effects of roughness on cell response is based on a review of about 50 carefully selected papers from the literature. It can be seen from the summary in Table 2 that, very frequently, the apparatus used for roughness measurement and, almost systematically, the scale of measurement are not specified although it will be demonstrated below that this information is essential for roughness characterisation.
Literature survey of the methods used for topographical measurements in 45 papers dealing with the effect of surface topography on cells (type of cells, nature of the material, number of different topographies analysed, process used to obtained these different topographies, commercial name of the surface recorder, measurement principle, measurement area, roughness parameters used to characterise topography, range of roughness amplitude covered by the study)*
*N: number of different roughness analysed. R: technique used for roughness measurement (Tac: tactile profilometer, AFM: atomic force microscopy, Las: laser, WLI: white light interferometer, Con: confocal microscopy, SEM: scanning electron microscopy). XD: scanning mode (2D: profile topography, 3D: surface topography). Scale: scanning length in μm, Param.: roughness parameters used to characterise the surface topography. Range: range of roughness amplitude in μm used to quantify the effect of topography (if another roughness parameter that the R a is used by the authors, this parameter is noted in brackets). ADSCs: adipocyte-derived stem cells. CaP: calcium phosphate, HA: hydroxyapatite, MSCs: mesenchymal stem cells, PC: polycarbonate, PCL: polycaprolactone, PDMS: polydimethylsiloxane, PET: polyethylene terephtalate, PI: polyimide, PLGA: poly-L-lactic/glycolic acid, PLLA: poly-L-lactic acid, PMMA: polymethylmethacrylate, PS: polystyrene, PU: polyurethane, SS: stainless steel, TCP: tricalcium phosphate.
Measurement methods
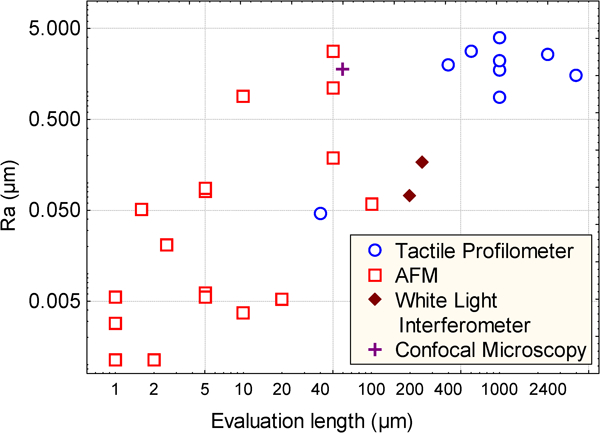
In the literature, three types of roughness measurement apparatus are principally used: the stylus profilometer,175 the AFM176 and optical apparatus (interferometer, confocal microscope).177 These apparatus allow coverage of a broad range of roughness amplitudes. The plot shown in Fig. 1 represents the range of amplitude roughness used in the papers described in Table 2. The AFM is rather used to measure low roughness (in term of R a), optical methods intermediate roughness and tactile ones higher amplitude roughness. However, the resolution of optical measurement, and more particularly of stylus profilometry, has considerably increased in the past decade and now allows coverage of a broader range of roughness.178 – 182 The scanning length of the AFM has also increased and now allows roughness evaluation over substantial lengths. As a consequence, an overlap exists between the evaluation lengths of the three techniques in the range 0·005–5 μm. For lengths lower than 0·005 μm, only AFM is used and for lengths greater than 5 μm only stylus profilometry is retained by authors. It must be pointed out that the choice of an apparatus to measure roughness is a very difficult task. Moreover, the comparison of roughness measured with different apparatus is rarely possible, even if the roughness is evaluated at the same scale. Differences in measured roughness amplitudes between types of apparatus can be higher than the differences between different surfaces.183 – 185
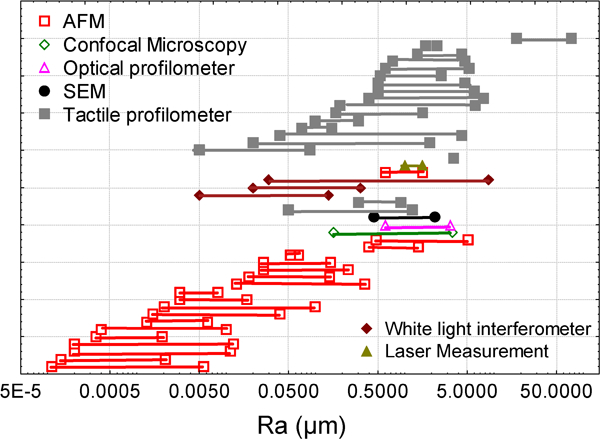
Plot of the roughness amplitude (R a) range used to study cell response to topography in the literature survey described in Table 2
2D or 3D roughness measurements
According to the measurement system 2D or 3D measurements can be made, meaning that respectively a profile or a surface is recorded. AFM and optical techniques allow principally 3D measurements, whereas tactile profilometry can perform both 2D and 3D measurements. Importantly, a 2D measurement contains a high number of points (often >104) whereas the resolution of 3D measurement is poor (about 1000 points in a given direction). However, 3D measurements allow the entire surface to be viewed, and in all directions. This is important when considering isotropy/anisotropy of surfaces.186
A surface can be seen as isotropic if roughness is similar in all directions or, more precisely, if all profiles extracted from the surface lead statistically to the same profile whatever the direction, i.e. give statistically similar values of roughness parameters. In this case, 3D measurements do not provide more information than 2D ones. In contrast, on anisotropic surfaces the roughness depends on the direction and roughness values must specify the direction of evaluation. As can be easily understood, one roughness parameter alone cannot take into account both amplitude and anisotropy of the surface: a single parameter will ‘average’ the two directions. To illustrate this, tooled and etched titanium surfaces are illustrated in Fig. 2. 97 97,187 Visually, the tooled surface presents an anisotropic structure: the R a value evaluated perpendicular to the groove is three times higher than that evaluated along the groove (0·58 μm against 0·17 μm). On the etched surface, which is isotropic, the R a value is the same whatever the direction (∼0·72 μm).
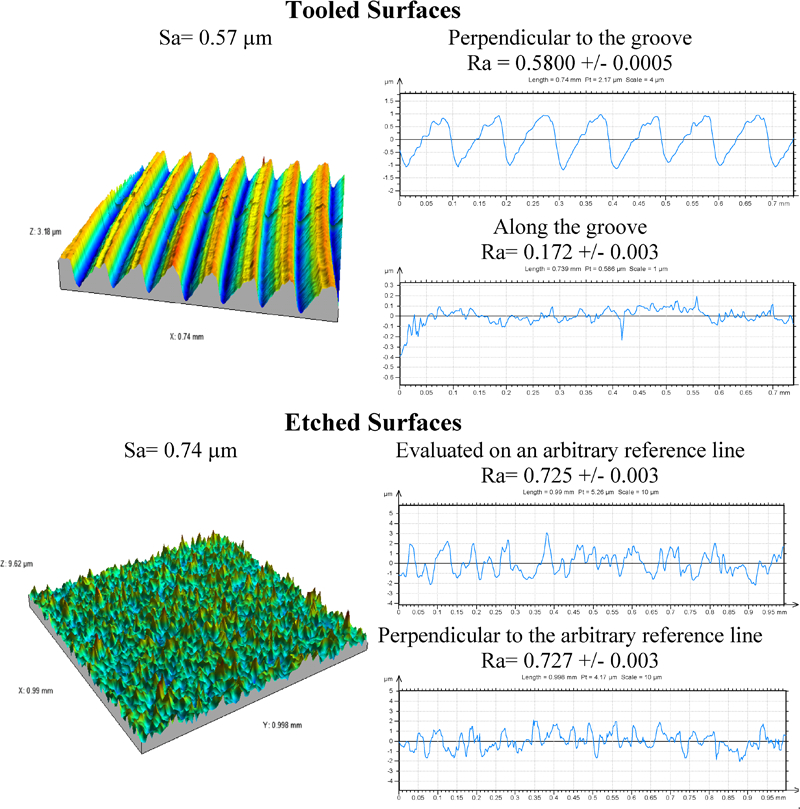
Comparison of 3D and 2D measurements for tooled and etched surfaces. 2D graphs are taken perpendicular and along the grooves for the tooled surface and evaluated on an arbitrary reference line and perpendicular to this line for the etched surface
Roughness parameters
Considering the processes used in the literature (Table 1), the analysed surfaces can be split into two categories: deterministic surfaces (obtained by lithography, for example) and stochastic surfaces (obtained by polishing, etching, etc.). Some examples are illustrated in Fig. 3. In the first case, roughness measurement is used to verify the dimensions of the elementary forms (holes, grooves, etc.). In the second, the stochastic surface is recorded and statistical parameters (such R
a) are calculated to provide ‘representative’ information for the surface. Surface roughness parameters are normally categorised into three groups according to their functionality:188
–
193 amplitude parameters, spacing parameters and hybrid parameters. These definitions are the same in 3D but another category appears, spatial parameters, e.g. the density of summits, the texture direction, the dominating wavelength.186 The most widely used roughness parameter in the biomaterial’s field is the well known R
a
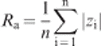
Illustration by SEM of surface morphologies of pure titanium surfaces treated by electroerosion (top left), sandblasting (bottom left), polishing and acid etching (top right) and machining (bottom right) (bar = 20 μm)
Consider a scheme of four simulated surfaces obtained by the same process with different machining parameters (Fig. 4). Surfaces A and C have the same R a, as do surfaces B and D. However, surfaces C and D and surfaces A and B have the same S m. This clearly suggests:
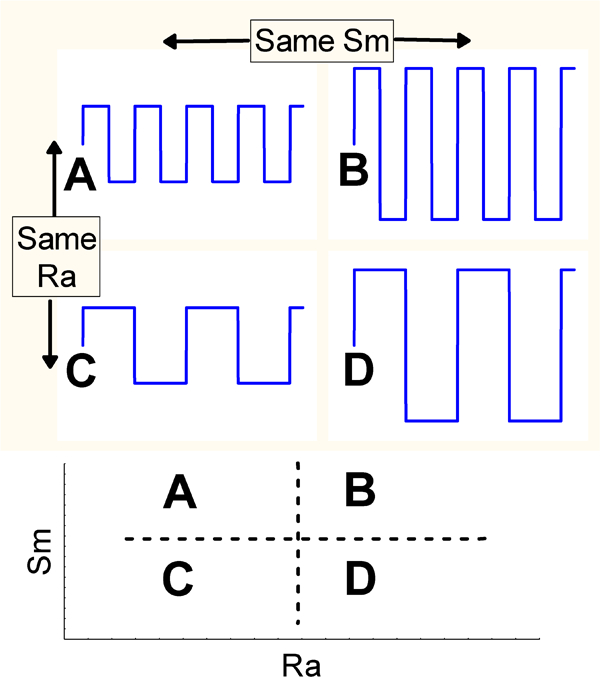
Example of profiles giving same R a (A = C)≠(B = D) and same S m parameter (A = B)≠(C = D)
R a is unable to characterise lateral roughness
one parameter alone is not enough in this case to characterise the surface.
More drastically, R a cannot distinguish the skewness of the profile, i.e. it cannot distinguish peaks and valleys. An amplitude parameter such as the skewness (Sk) must be used to detect this difference.192 Experience in the field of biomaterials suggests that cell adhesion is characterised better by S m than by R a.193
Multiscale measurement
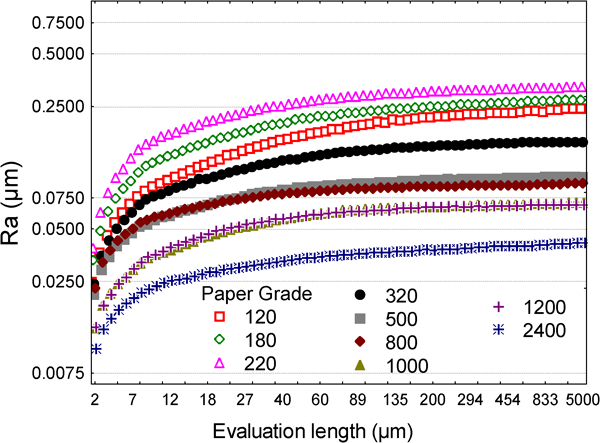
One crucial aspect in roughness measurement is to determine at which scale the roughness must be evaluated. In Fig. 5, evaluation lengths (i.e. the scale of measurement) from the literature are plotted versus R a. The evaluation length (EL) varies from 1 μm (AFM) to 10000 μm (tactile profilometer). A weak correlation exists between EL and R a: the higher R a, the higher EL. A more surprising result is that 1–3 decades of EL can be found for the same value of R a. However, the value of a roughness parameter depends on the evaluation length. This was demonstrated by Giljean et al. on polished titanium alloy surfaces treated with 10 different paper grades (120 to 2400).194 Using a very high precision apparatus (Tancor profilometer), it was possible to compute roughness parameters at different scales, which in fact encompass the entire range of evaluation lengths encountered in the literature (2–8000 μm). When R a was plotted versus EL for the different paper grades, a correlation was found: the lower the evaluation length, the lower R a (Fig. 6). However, over a critical length, R a stayed quite constant at a value that depended on the paper grade.195 – 197
Plot of the roughness amplitude (R a) versus the evaluation length met in the literature survey described in Table 2
Values of the R a roughness parameter versus the evaluation length measured on titanium samples polished with different paper grades
It is evident therefore that to allow the comparison of roughness values from the literature, evaluation length must be specified. The importance of the evaluation length must be recognised more fully by authors interested in cell response to topography since:
for a given study, the relation between cell adhesion/proliferation and roughness parameters may differ according to the evaluation length
more drastically, if surfaces are obtained with two different processes (A and B) it is possible to obtain a roughness parameter that is greater for surface A than surface B below a certain critical length and less for surface A than surface B above this critical evaluation length (Fig. 7).
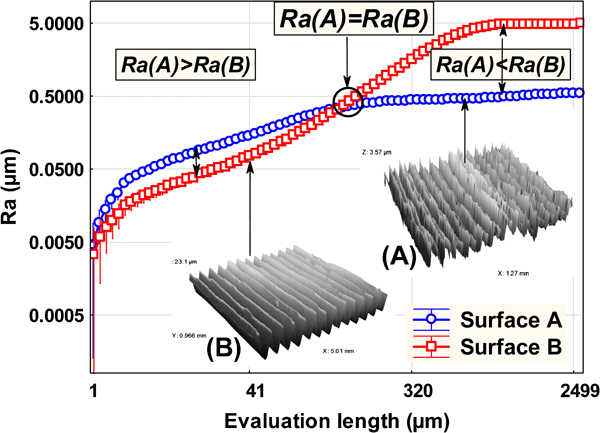
Values of the R a roughness parameter versus the evaluation length measured on a stainless steel substrate tooled with two different cutting conditions
There is thus great interest in developing reliable methodologies to determine, without any preconceived opinion, which scale roughness parameters must be evaluated with regard to a considered functionality (e.g. cell response).198 For the moment, there is no comprehensive method taking into account the scale of evaluation. This probably derives from the lack of a globally recognised methodology combined with the limits of the software presently on the market having the function essentially to characterise surface morphology. To address this question, the present authors have designed a novel analysis system status surface, MesRug. 199 199,200 The objective is to build a robust statistical analysis to create a probabilistic index that characterises the relevance of each scale. A recently developed data analysis tool called the Bootstrap is used to determine the process conditions that give the best correlation with biological properties. 187 187,201
Topography/surface energy/surface chemistry relationships
Surface energy is generally calculated from wettability experiments in which a liquid drop is put in contact with a surface. The behaviour of the drop is described by the Young equation.202 However, this equation cannot be applied on surfaces with physical and chemical heterogeneity. It is well known that roughness influences surface wettability and this has been described by Wenzel203 and Cassie–Baxter theories.204 These effects are particularly evident on ‘superhydrophobic’ surfaces that reproduce what is called the ‘lotus effect’ (the lotus leaf is covered by papillae 10 to 20 μm in height and 10 to 15 μm in width covered by a superimposed wax layer that make them highly hydrophobic and self-cleaning). This has been mimicked in the past 20 years on artificial materials to develop paints, fabrics and other surfaces that can stay dry and clean themselves in the same way as the lotus leaf.
The roughness of implants is generally isotropic, unstructured and chemically heterogenous. Thus, on these surfaces, it is theoretically impossible to calculate surface energy from wettability measurements.205 – 207 However, it has been shown that by changing the conditions of preparation of rough dental titanium based implants, it is possible to improve considerably their wettability and consequently their impregnation by biological fluids, the adsorption of proteins from these biological fluids and their osseointegration.208 The immediate immersion of implants in saline buffer solution under nitrogen atmosphere after the acid etching procedure made it possible to preserve the implants from hydrocarbon contamination and to retain a high surface energy.
Thus, the reader must keep in mind that any modification of surface roughness will have an influence on the surface energy either directly, by the presence of roughness, or indirectly, by modification of the surface chemistry during processing. Chemical modification can be due to contamination of the surface by the use of lubricants or to the use of processes such as plasma treatments that induce surface activation and hence further contamination with natural hydrocarbons when the activated surface is exposed to the atmosphere. Surface engineering techniques designed to modify surface chemistry, for example by ion implantation or coating, will also affect the adsorption of proteins from biological fluids on the surface. As described below, cells use these adsorbed proteins to interact with the material surface. Thus, all these modifications will surely have a strong influence on the future integration of implants in tissues. Processes used specifically to tailor surface roughness can also modify surface chemistry. For example, sandblasting at too high an energy has been shown to modify a Ti–6Al–4V alloy to a depth of more than 10 μm by producing in some places enrichment of the cytotoxic aluminum oxide AlOx.75 To ensure surface roughness will be the only parameter influencing cell response, authors have adopted approaches such as applying thin (order of nanometres) layers of a biologically compatible or inert material 95 97 95,97,187 or making replicas of the surfaces in another material.68
Surface chemistry also a has strong effect on cell response but this topic falls outside the scope of the present review; readers are invited to refer to.209 – 211
Steps in cell response to topography
Classically the in vitro models for testing the influence of topography on cell response use cell lines derived from animal or human tissues. The advantage of animal cells is their almost unlimited availability, although a major disavantadge is that their behaviour can be very different from that of human cells derived from the same tissue. Thus, the ideal cellular material for testing materials before clinical application is normal cells derived from healthy tissue. However, these cells (primary cells) are in general produced in limited amounts and present a very high variability between donors. This variability is at the origin of the difficulty in obtaining significant differences between runs and of the need for strong statistical analysis of data.187
These limitations have led to the use of cell lines derived from tumours, which have the advantage of being highly proliferative and thus possessing almost unlimited availability. However, the major disavantage of tumour derived cells is that their phenotype (i.e. the specific characteristic derived from their tissue origin) is generally very different from that of healthy cells derived from the same tissue and that their behaviour versus topography is abnormal. For example, a recent study demonstrated that cell lines derived from human osteosarcoma (SaOs-2, MG-63, etc.), which are widely used in the field of biomaterials to analyse the response of human bone cells to topography,78,79,101,212 – 215 are able to deform considerably their nuclei in response to the topography of the substrate. More surprisingly, cells with deformed nuclei did not show any change in their ability to survive, adhere, proliferate or differentiate. 216 216,217 If the use of normal cells is not possible, immortalised cells derived from healthy cells by different methods (transfection by an oncovirus or by human telomerase reverse transcriptase (hTERT)) must be preferred over tumour-derived cells. The immortalised cells are primary cells with extended replicative capacity. They have acquired the capacity to proliferate without reaching senescence since oncovirus or hTERT has inactivated genes involved in the senescence of cells. hTERT immortalised cell lines without cancer-associated changes or altered phenotypic properties are now available in cell culture collections. Thus, hTERT immortalised cell lines should present the advantages of both healthy and tumour-derived cells: a normal phenotype and high proliferation capacity without the limitations of primary cell lines.
In conclusion, the choice of the cellular model to evaluate the influence of implant topography on cell reponse is crucial for the interpretation of results. In most cases, primary human cells derived from the tissues concerned with the implant, i.e. tissue in which the material will be implanted, or, if available, equivalent immortalised cell lines must be preferred.
Before going into details on the response to topography of cell types derived from various tissues, a summary will be presented of basic information on the phases of cell interaction with a material, as analysed in classical in vitro experiments. In vivo cell behaviour versus implant topography will not be described in the present review.
Cell adhesion and spreading
Cells contain several elements. They are surrounded by a cell membrane made of a phospholipid bilayer that functions as a semi-permeable barrier, allowing very few molecules across it. This membrane envelops the cytoplasm, i.e. a liquid containing cellular organelles such as mitochondria (the sites of energy release), the endoplasmic reticulum and Golgi apparatus (involved in protein synthesis) and the nucleus (the location of gene expression and where DNA is confined by the nuclear membrane). Moreover, the architecture and movement of cells is controlled by a cytoskeleton that is made of a network of three different types of filaments: actin microfilaments, tubulin microtubules and intermediate filaments. The cytoskeleton directly connects the cell membrane to the nuclear membrane and is involved in the mechanotransduction system which is the basis of the cell response to topography.
The majority of cell types derived from tissues (except blood cells) need to adhere to other cells or to an extracellular matrix (ECM) to survive. Thus the quality of adhesion will be critical for their survival, proliferation and differentiation. The formation of an interface between a cell and a substrate is illustrated in Fig. 8 on an artificial structured substrate. First, a non-adhering cell (detached from a culture dish or from ECM) will adhere on the substrate through specific membrane receptors forming what is called focal adhesions (Fig. 8a ). Second, the number and size of focal adhesions will increase; the cells will spread out on the surface and eventually orientate themselves as a function of surface features (Fig. 8b ). Third, they will proliferate, i.e they will divide and their number will increase. As a last step they will differentiate (acquire a phenotype). To do this, they will synthesise ECM proteins or bioactive factors specific to their tissue of origin or modify their environment, for example mineralising the ECM they have previously synthesised as is the case for bone cells.
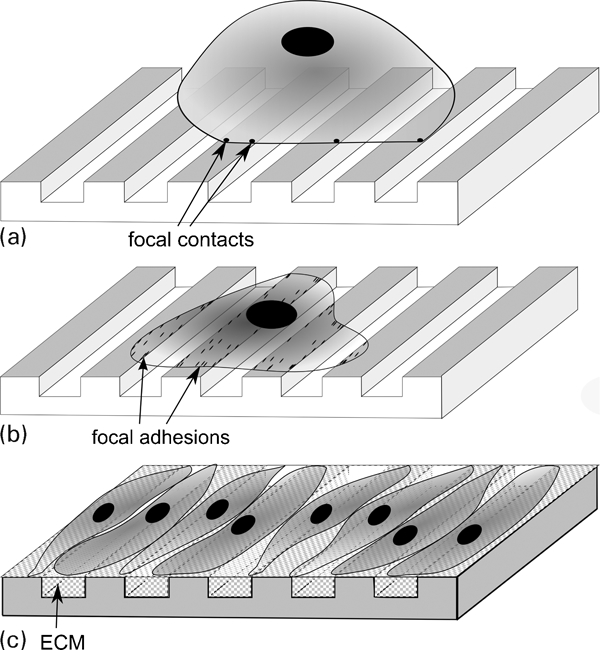
Steps in cell response to a grooved topography
In in vitro models (but this is also true in vivo), when cells adhere on a material they will interact with a surface on which water, ions, and biomolecules have been adsorbed from the culture medium or biological fluids. The fact that cells will never interact with a naked surface must be taken in consideration since this adsorption modifies surface chemistry, surface energy and surface nanotopography of the material. Thus, the cells will sense surface features through this adsorbed layer. The first interactions between cells and their substrates will involve physicochemical interactions: van der Waals forces, electrostatic forces, etc. Furthermore, receptors present in the cell membrane will interact with the adsorbed biomolecules. The most important biomolecules, integrins, are transmembranous proteins made of two subunits (α and β) that can form more than 20 different receptors specific to amino-acid sequences such as the well known arginin-glycin-aspartic acid recognition motif present in many ECM proteins. On the intracytoplasmic side of the integrin receptors, several proteins form the focal adhesions that are also called focal contacts or adhesion plaques. These proteins are involved either in a direct physical connection of the cell membrane with the nuclear membrane through the cytoskeletal filaments or in an indirect signalling pathway from the cell membrane toward the nucleus by the successive activation of kinases (focal adhesion kinase, integrin-linked kinase, extracellular regulated kinase, etc.). Thus the integrins are the points of entry for transmitting information from surface features on the outside of the cell to the nucleus, through either a direct signalling or an indirect one (Fig. 9). After this first phase, the cells will begin to spread on the substrate. This spreading phase is driven by contraction of the cytoskeleton filaments using motor molecules, like myosins for actin microfilaments and kinesin or dynein for microtubules, which are able to translocate along the cytoskeleton fibres. After adhesion and spreading, the cells will secure their shape through a pre-stressed state that maintains an equilibrium in the cytoskeleton between the tension of microfilaments and the compression of microtubules.218 All the mechanisms described here are also involved in the cell’s response to mechanical stimulation (mechanotransduction) that is involved in the response to topography.
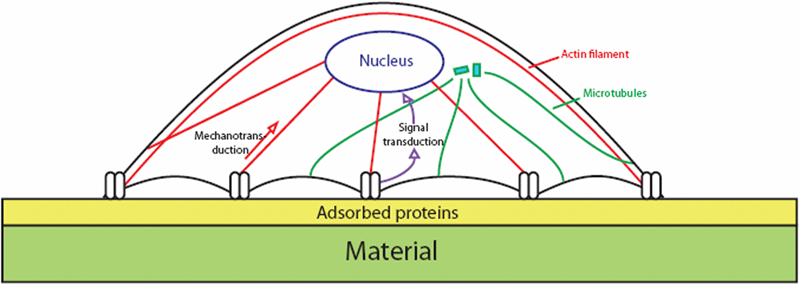
Transversal view of one cell adhering on a material covered by proteins adsorbed from biological fluids. Cells adhere on a surface by forming focal contacts (or focal adhesions) where transmembranous receptors (integrins) make the link between extracellular and intracellular compartment. On the intracellular side, integrins are directly connected to the cytoskeleton (actin filaments, intermediate filaments and microtubules) and to different proteins whose kinases. Thus the information coming from the cellular membrane and going to the nuclear membrane can pass directly through the cytoskeleton filaments (mechanotransduction) or indirectly through the successive activation of cytoplasmic kinases (signal transduction)
In some cases, when the substrate is unfavourable for cell anchorage, cells can migrate to find a better place to adhere. If the substrate presents anisotropic topography such as grooves, cells will orient themselves along the axis of the grooves (Fig. 8c ). This behaviour is termed contact guidance and has been observed on micrometric 2 219 2,219,220 and nanometric 130 131 130,131,215 grooves. Finally, when cells have adhered, they start to explore their surroundings using thin filamentous membrane extensions called filopodia. 11 11,221 When the filopodia can fix themselves adequately on a surface feature using wide focal adhesions, a larger cell protrusion will be produced and the cell will further extend or migrate in this direction. Filopodia are thus involved in a sensory feedback loop that is active in identifying surface features. 11 11,28 All these mechanisms have been explored in for some time by microscopy (light and electron) after fixation of cells but more recently on living cells using time-lapse microscopy.221 These observations have been correlated with biochemical and molecular analysis of gene and protein expression. 3 106 3,106,222
Cell migration and contact guidance
Once attached and their cytoskeleton pre-stressed, the cells will be able to move on the surface either to follow underlying microstructure or to follow chemotactic attractive molecule flow. In migrating, a cell will first polarise (characterised by a wide front and a narrow rear) and extend its membrane in the direction of motility, form attachments between the leading membranes and the substrate, move the bulk of the cell body and finally release the attachments from the substrates at the rear. Thus, migration capacity, like contact guidance, is also based on the mechanotransduction mechanism.223 – 225
The first demonstration of cell migration originating from a tissue explant was done at the beginning of the twentieth century and the term ‘contact guidance’ was suggested in 1934 to describe nerve fibre outgrowth and orientation that tends to follow a course dictated by fibrin micelles orientated in the direction of stress within a plasma clot. 226 226,227 In the present review, contact guidance will be mainly defined as the capacity of cells to orient as a function of surface features. This phenomenon has been mainly documented on grooved surfaces but can be also observed on fine fibres. It occurs when cells are inhibited in their spreading by a step; the cells then follow the edge step to elongate and eventually present a very elongated morphology following the groove direction. It has been shown that this elongation, by applying a compressive force on the cytoskeleton around the nucleus, can induce nucleus deformation and rearrangement of the chromatin inside.228 It has also been shown recently that the position of genes in chromatin has an influence on their expression. Therefore, logically, deformation of the nucleus by the surface topography should have a strong influence on gene expression and later on the proliferation and differentiation capacity of cells. 225 229 225,229,230
Cell proliferation
Cell proliferation is divided in four phases, G1, S, G2 and M, where the cells increase in size, replicate their DNA, continue to grow and finally stop growing and divide into two daughter cells respectively. It has been shown using adhesive patches of different sizes that to be able to enter phase S, the cells needs to be sufficiently spread. If the spreading is not achieved, the proliferation process cannot continue.231
Another phenomenon that can modulate the proliferation of cells is contact inhibition. During the 1950s, Abercrombie et al. reported that different cell types exhibit contact inhibition of locomotion (CIL), that is the process by which cells in vitro change their direction of migration upon contact with another cell, and that cancerous cells had a lower CIL than healthy cells. 232 232,233 This is one reason why tumoural cells grow anarchically to form a tumour mass. The capacity of cells to proliferate on a surface is classically evaluated by counting the attached cells at different times after inoculation. The time needed by cells to double their initial number (doubling time) is also sometimes calculated.
Cell differentiation
In developmental biology, cellular differentiation is the process by which a less specialised cell becomes a more specialised cell type. Differentiated cells will express different genes from un-differentiated ones like stem cells. Thus, a classical means to characterise the influence of surface topography on the cellular differentiation is to follow the modification of their gene expression by molecular biology techniques such as the reverse transcriptase-polymerase chain reaction, real-time polymerase chain reaction or microarrays. In parallel, proteins expressed by the cells must be quantified since a gene can be expressed in mRNA but not directly translated in the corresponding protein. The surface topography can modify other specific functions of cells, for example the excitation potential of nervous cells, the contraction capacity of muscle cells or the mineralisation capacity of bone cells. All specialised cells in the body are derived from stem cells. The differentiation of cells from embryonic stem cells is the focus of an intensive and competitive research activity. The embryonic stem cells are particularly interesting since their totipotent nature means they can be differentiated into any of the tissues forming an organism. However, the research on these cells, and notably on human embryonic stem cells, is strongly regulated and they are not commonly used to study the influence of surface topography on cells.
More pertinent are the adult stem cells derived from adult tissues that are present everywhere in the body in a quiescent state. These adult stem cells are now considered as a stock of cells able to differentiate to regenerate tissues after an injury or after implantation of an artificial material or device. The most well known of these adult stem cells are the mesenchymal stem cells (MSCs) that were first discovered in the bone marrow but are also present in other tissues such as adipose tissues or perivascular sites. They are considered to be multipotent stem cells since they can be differentiated in bone cells (osteoblasts), cartilage cells (chondrocytes) or adipose tissue cells (adipocytes) by adding differentiation factors to their culture medium or by modifying the methods used to cultivate them. For example, a culture in aggregates will favour the differentiation of MSCs in chondrocytes. Other stem cells exist for epithelial, endothelial, muscular or neural cells and can be also used to test the influence of materials surface features on cell differentiation.
Examples of cell response to topography
Fibroblasts
Fibroblasts are used frequently in the field because of their ubiquitous distribution in most connective tissues, and their ease of preparation and culture. Moreover, tissue engineering based on fibroblasts for replacement of dermis or research on implants in contact with dermis or gingiva necessitates a better knowledge of how fibroblasts react to surface topography. The first important studies on the influence of surface topography on fibroblasts orientation were performed by G. A. Dunn in the 1970s. Dunn and Heath explored the mechanisms underlying contact guidance of fibroblasts on glass fibres (54 or 127 μm in diameter) or on a silica prism with a 4° ridge angle.234 During these experiments, they observed that the microfilament bundle system revealed discontinuities that coincided with a discontinuity in the shape of the substratum. On the basis of these pioneering studies they proposed that the shape of the substratum imposes mechanical restrictions on the formation of certain linear bundles of microfilaments that are involved in cell locomotion.
Brunette et al. used gingival explants or gingival fibroblasts to investigate how contact is established between gingiva and dental implants. 127 219 235 127,219,235,236 They observed that the microtubules were the first element to become oriented parallel to the direction of the grooves, 20 min after plating, whereas actin microfilament bundles aligned only 40–60 min after plating.127 Walboomers et al. confirmed later that the formation of an actin cytoskeleton is not a prerequisite for contact guidance.220 The interfaces between cells and grooves, observed by transmission electron microscopy, showed that cells extended cellular processes into the grooves, forming focal adhesion points on the pattern ridges that led to mechanical interlocking. 107 110 126 107,110,126,237 The comparison of microgrooves of different widths and spacings showed that, systematically, the rate of orientation increased when the depth of microgrooves increased. 220 220,238 This was also observed at the nanoscale.10 Contact guidance has also been observed on populations of fibroblasts cultured on grooved substrates. 8 108 8,108,239 This capacity for orientation suggests that the sensitivity to the substrate can also be influenced by population pressure.
Recent interesting results were obtained on anisotropic topography gradients. 7 7,8 A substratum with a constant ridge width (1 μm) and depth (400 nm) but variable groove widths (1–9·1 μm) showed that fibroblasts aligned and elongated more strongly along the denser patterns compared to the sparser areas.8 It appeared that single cells were able to sense and react to the topography gradient and oriented more strongly at high ridge density when fibroblasts were cultured in confluent monolayers. However, when analysing the migration of cells, the cell speed displayed an optimal value at an intermediate ridge density. This observation could be an illustration of the capacity of fibroblasts processes to aggregate in zones of intermediate ECM density that might become the zones of active ECM repair during wound healing, creating a dense matrix, and to move further to adjacent zones where the ECM density is still intermediate.
Other anisotropic rough surfaces such as pillars or pits organised in a regular array have been used to analyse the response of fibroblasts. Pillared substrates have been developed to explore the migration response and structural organisation of fibroblasts in a 3D environment that is closer to the environment that cells encounter in vivo. Compared with cells on flat surfaces, fibroblasts on pillar substrates showed a more branched shape, an increased linear speed and a decreased directional stability.240 These behaviours were attributed to stabilisation of focal adhesion on pillars coupled to myosin contraction toward pillars. 240 240,241 Interestingly, when the spacing between pillars was increased to 10 μm, cells coming from flat areas around pillars transmigrated between pillars, whereas when the spacing was 5 μm, 80% of these cells did not cross the boundary.241 The explanation proposed for the existence of this critical distance was that the stiffness of the cell nucleus could modulate migration on micropillared substrates.241
The culture of fibroblasts on surfaces with microscale pits123 gave different information on the mechanisms underlying the response of fibroblasts to topography. Comparing the adhesion and proliferation of fibroblasts on patterned quartz surfaces with pits measuring 7, 15 and 25 μm in diameter, 4·8 μm in depth and an inter-pit spacing of 20 or 40 μm, it was shown that proliferation was highest on pits measuring 7 μm, whereas the largest of the pit diameters combined with either spacing allowed cells to enter the pits completely. This apparent preference to enter the largest diameter pits demonstrate that the cells are able to determine the diameter of the pit prior to entering it.123 This capacity could be related to a sensitivity of cells to changes in radius of curvature that has been also described at the nanoscale.11
On surfaces displaying variable local density of square pits, it was observed that fibroblasts migrate preferentially to follow the direction of patterns of higher anisotropy.7 The cells were able to integrate orthogonal spatial cues and to migrate from less densly pitted areas to more densely pitted ones. Using this capacity it is possible to organise large-scale cell migration and to induce cells to migrate towards a spatially desired location. Thus more sophisticated architectural designs of implantable biomedical devices could be envisioned to control the cell/material interface and develop advanced tissue engineering approaches.
The response of fibroblasts to isotropic roughness has also been studied at the micro- and the nanoscale. Notably, the influence of surface treatments classically applied to implants (polishing, etching, blasting, grinding, plasma spraying, etc.) has been explored. The adhesion and proliferation of fibroblasts were generally higher on smoother surfaces than on rougher ones. 73 87 90 73,87,90,242 This was associated with higher spreading and a lower cell thickness. 71 71,90
Initial studies on the response of cells to nanotopography were done using fibroblasts. Analysis of the response of human fibroblasts to nanocolumns prepared by colloidal topography demonstrated that fibroblasts identified the nanotopography and that their adhesion and spreading were reduced on nanocolumns. 18 18,19 Using nanotopography produced by a polymer demixing approach, Dalby et al. were able to demonstrate that fibroblasts could identify the presence of 10 nm high nanotopography using filopodial sensing.28 Moreover, human foreskin fibroblasts showed a capacity to discriminate between sharp-tip nanotopographies of different shapes. They exhibited smaller cell size and lower proliferation on needle-like nanoposts and enhanced elongation with alignment on blade-like nanogrates.16 The nanopost and nanograte architectures provided distinct contact guidance for both filopodia extension and the formation of adhesion molecule complexes that has been shown to be involved in mechanisms underlying rugophilia at the nanoscale but also at the microscale (see section on ‘Steps in cell response to topography’).
Epithelial cells
The role of epithelial cells is to cover and protect organs such as skin, cornea, gingiva or intestines. Thus the main objective of tissue engineering in this field is to favour the migration, proliferation and covering capacity of epithelial cells. Grooves at the microscale and at the nanoscale have been shown to favour adhesion and orientation of epithelial cells.113,116,124,130,243 – 250 Micropillars, 251 251,252 pits 125 125,253 or pores254 – 257 also allow the control of the migration and proliferation of epithelial cells. Using bovine corneal tissue, the possibility of controlling the migration around explants of an epithelial sheet on planar and porous polymer membranes was tested. The dimension of pores,257 their density254 and the surface hydrophilicity influenced epithelial tissue migration.256
In a recent study, topographic analogues of intestinal crypts on PDMS substrates were developed. Intestinal epithelial cells were able to crawl along the steep side walls and migrated from the bottom to the top of the well structures, completely covering the surface after 4–5 days in culture.253
Another application of research on epithelial cells concerns corneal prostheses. Fundamental research has been done by culturing corneal epithelial cells on well defined micro- and nanogrooved substrates. Corneal epithelial cells (CECs) aligned along all grooved patterns except on the wider ones (pitch 4 μm) and this orientation increased with groove depth. Cell colonies also seemed to orient in the groove direction.249 Moreover, a large percentage of cells aligned along the topographic patterns when serum was present in the culture medium.245 Interestingly, the role of environmental factors on the response of CECs to nanotopography was highlighted recently. 130 130,246 In serum-free medium (Epilife) cells aligned preferentially in the direction perpendicular to nanogrooves, but parallel when the pitch was increased from 400 to 4000 nm, whereas in medium containing 10% serum the same cells showed increased elongation and parallel alignment response to increasing groove depth independent of lateral feature dimensions.130 Similar observations were made when human CECs were cultured on surfaces presenting well defined ridge and groove wave-like nanostructures of 60–140 nm pitch and 200 nm depth. The human CECs’ contact acuity was found to be ∼60 nm pitch for cell cultures in Epilife and ∼90 nm pitch for cells in medium containing serum,250 demonstrating the synergy between surface topography and environmental factors. Other stimulations can be associated with topography to induce alignment of cells. Electric fields were associated with substrate nanogrooves as shallow as 14 nm in order to induce the alignment of corneal and lens epithelial cells.244 It was concluded that nanoscale features and an electric field can co-operate to control cell axis alignment. More surprising was the difference in sensitivity of corneal and lens epithelial cells to surface topography, the latter ones being the least sensitive. This result illustrates again the importance of cell phenotype in this type of experiment.
All these observations were made on anisotropic surfaces. Several authors have also investigated whether epithelial cells respond to isotropic topography.
On dental titanium implants, it was shown that epithelial cells attached and spread more readily on polished and etched titanium surfaces than on sandblasted ones.258 Nanotextured titanium surfaces obtained by electron beam evaporation or anodising increased keratinocyte adhesion, spreading and filopodia extension compared with their conventional counterparts. After 3 and 5 days, proliferation was increased only on nanorough titanium surfaces prepared by electron beam evaporation but not on anodised and unmodified titanium surfaces.259 Again, these effects attributed to modifications of topography must be considered as potentially related to surface chemistry modifications since process such as polishing, etching or sandblasting can leave contaminations on the surface.
Endothelial cells
Like epithelia, endothelia play a role in protection and covering of the internal lumen of the vascular system. The challenge in the field is to develop artificial materials able to replace vessels on which endothelial cells can adhere, proliferate and make a confluent cell layer.
The current vascular prostheses are made of synthetic nondegradable polymers such as ePTFE or Dacron that are knitted or woven. However, the poor efficiency of these materials has motivated research on coatings or chemical or protein modifications. The maintenance of endothelial cell (EC) function was demonstrated after culture on Dacron and PTFE pieces previously coated with fibrin.260 A few studies have been concerned specifically with the influence of microtopography on endothelial cells in vitro. Laser ablation techniques were used to produce micropatterned surfaces. 261 261,262 Bovine endothelial cell adhesion and distribution was controlled by the size and surface chemistry of square ablated domains.261 On PET surfaces presenting grooves with a 30 μm spacing, 30 or 3 μm width and 10 or 1 μm depth, human umbilical vascular endothelial cells showed an orientation dependency for features in the cell range dimension (30 μm) that was not observed with bone cells.262
The capacity of ECs to identify and respond to topography at the nanoscale was demonstrated on replicas in PU of basal membranes that are their natural substrates in arteries. PLGA with spherical surface features measuring 200 nm promoted better vascular cell adhesion than smooth PLGA or PLGA with 100 or 500 nm surface features.58 ECs were able to distinguish between islands heights of 13, 35 and 92 nm on polymer demixed nanotopography29 with 13 nm islands giving the largest response , cells exhibiting highly spread morphologies and well defined cytoskeletons. Three-dimensional fabrication techniques such as electrospinning are also used to produce nanostructured 3D environments for vascular cells mimicking their natural ECM. The capacity of endothelial cells of diverse origins to adhere, spread and proliferate on the nanospun materials was confirmed by different authors. 17 45 17,45,47
The contact guidance capacity of ECs was confirmed at the microscale on grooved substrates,263 on surfaces presenting stripes, squares, rectangles and spiral geometry264 and also at the nanoscale. 59 59,265 The comparison of 2D and 3D chitosan scaffolds showed a reduced spreading area and circular morphology of human umbilical vascular endothelial cells on 2D relative to 3D scaffolds.266 Three-dimensional scaffolds with a honeycomb morphology were made in PCL. To adhere, porcine aortic endothelial cells expressed focal adhesions localised around pore peripheries.267 A very recent study concerned the contact guidance capacity of four different human vascular EC types on nanometric, submicrometre and micrometre scale grooves. However, each cell type showed a unique orientation and alignment response to the groove topographic cues, demonstrating again the influence of cell phenotype in response to topography.268
All together, these results confirm that the future of vascular biomaterial development, notably in small-diameter applications, must involve the control of surface topography by juxtaposing various technologies such as lithography, phase separation, chemical etching or electrospinning to mimic the 3D nanostructure of ECM.17
Muscle cells
Most papers dealing with microtopography and muscle cells are concerned with the contact guidance and the capacity of muscle cells to orientate, align and fuse together to form multinucleated myotubes. Indeed, aligment is a critical step in muskuloskeletal myogenesis that is required prior to fusion into multinucleated myotubes leading to the development of muscular structure. Moreover, in vessel and arterial tissues, smooth muscle cells are embedded in collagen and elastin lamellae arranged in a helical pattern around the circumference of the vessel. The first studies in the early 2000s have demonstrated the contact guidance of myoblasts on grooves or fibres. 92 105 121 122 135 92,105,121,122,135,269 This orientation has been shown to be associated with the orientation of cytoskeleton, myofibrils and proteins involved in cell–cell junctions such as cadherins and connexins.121 Recently, Altomare et al. studied the orientation of myoblasts but also the formation of myotubes on polymeric surfaces presenting grooves with depths in the range 0·5 to 5 μm and widths in the range 5 to 100 μm. The best results were obtained on grooves with 2·5 or 5 μm depth and 5 or 10 μm width.117 Interesting work was carried out on PDMS substrates presenting reversible wavy microfeatures.269 This reversible topography was able to align, unalign and realign myoblasts repeatedly on the same substrate within 24 h intervals. This type of substrate is particularly interesting for investigations of dynamic cellular processes occuring during contact guidance.
The contact guidance of muscle cells was also confirmed at the nanoscale,15 but in this case the presence of nanogrooves reduced their proliferation significantly. The potential to align smooth muscle cells (SMCs) was used to develop a potential scaffold for blood vessel engineering by inoculating SMCs on an aligned PLLA-PCL (75∶25) copolymer nanofibrous scaffold produced by electrospinning.46
Pioneer studies on the influence of isotropic topography on muscle cells were done by Thapa et al. on polymeric substrates (e.g. PLGA, PU, PCL) presenting conventional microstructured or nanostructured surfaces.38 – 40 Systematically, the adhesion of SMCs was enhanced as polymer surface feature dimensions were reduced into the nanometre range.40 In order to discriminate the relative influence of surface chemistry and surface topography on the behaviour of SMCs, conventional, small microstructured, submicrostructured and nanostructured surfaces were produced in PLGA and in PU by treatment with NaOH and HNO3 respectively. These topographies were reproduced in chemically untreated PLGA and PU using polymer elastomer casting methods. It was demonstrated that the cell number was influenced by both surface roughness and surface chemistry changes but that the most important contributor was nanometre surface roughness.39
Bone cells
The bonding between living bone and the surface of implants is believed to be an important factor in implant success in vivo. Many factors contribute to this process, including surface topography, surface energy and implant composition. This is the reason why the influence of topography on bone cell adhesion has been extensively studied on metallic substrates as well as on ceramic ones.270 – 273 In the large majority of studies, the attachment and adhesion of bone cells was improved when roughness increased. 74 75 83 85 95 97 274 74,75,83,85,95,97,274,275 However, as discussed in the section on ‘Topography’, the roughness amplitude measured by R a or R t is insufficient to describe a surface and it has been demonstrated that parameters describing surface organisation are the most influential parameters on the bone cell rugophilia. 95 97 95,97,187 In particular, the order parameter defining the organisation of surface topography gave the best correlation with the long-term adhesion of human primary osteoblasts.97 As described above, the primary human osteoblasts can present variable behaviour as a function of the physiology of the patient from who they are derived. Consequently, this imposes a need for multiple repetitions of the experiments and deep statistical analysis of the data to determine the most influential surface roughness parameter on cell response. This approach has made it possible for the present authors to develop statistical modelling approaches of cell–material interactions.187 Statistical correlation between surface parameters and biological parameters was also done by Nebe et al. 276 In particular, they showed that beside surface topography parameters, the electrochemical characteristics of microstructured titanium substrates also influenced cell adhesion, spreading, proliferation and differentiation.276
Regarding the proliferation capacity of bone cells on rough surfaces, results are more heterogenous. Proliferation was sometimes improved on rough surfaces compared with smooth ones, 85 89 93 95 275 85,89,93,95,275,277 although in the majority of studies, the contrary was observed.74,75,77 – 79,101,278–282 However, it should be noted that most of the second group of studies were done using cells derived from osteosarcoma. Modification of surface chemistry by the surface treatment could also explain these different results.
The differentiation of bone cells on surfaces with different roughnesses has also been widely studied, particularly by the team of Boyan. Using mainly MG-63 cells that are, like SaOs-2 cells, relatively insensitive to deformation imposed by topography,216 they generally observed increased alkaline phosphatase activity, and synthesis of osteocalcin, collagen, prostaglandin E2, and transforming growth factor beta on rougher surfaces than on smooth ones.77 – 79,278 Interestingly, they also observed that surface roughness promoted osteogenic differentiation of less mature cells, whereas when cells became more mature, they exhibited a reduced sensitivity to their substrate, yet even the terminally differentiated osteocytes were affected by changes in surface roughness.279 They concluded that on microrough titanium surfaces, osteoblasts create a microenvironment conducive to new bone formation,273 results that have been confirmed by other authors. 80 101 275 281 80,101,275,281,283 It can be noted that these results, obtained on metallic substrates treated by classical techniques used to prepare bone implant surfaces (polishing, machining, acid etching, blasting, plasma spraying, electroerosion, etc.) and giving complex surface morphologies, were difficult to analyse and compare. Consequently, model surfaces were also developed to ease identification of the mechanisms underlying bone cell rugophilia.
As with other cell types, bone cells showed a contact guidance capacity when cultured on grooved substrates.82,133,284 – 286 Other interesting model surfaces exhibiting hexagonal arrays of hemispherical microcavities of different diameters, separated by various spacings, were produced on titanium by a through-mask electrochemical micromachining method. Cavities 10, 30 and 100 μm in diameter were prepared and further treated by porous anodisation or chemical etching to generate nanotopography on the microstructures. 43 43,132 The study of MG-63 cell adhesion on these surfaces showed different behaviour on 10 μm and wider cavities. The MG-63 cells, measuring ∼30 μm in diameter, spread over the 10 μm cavities since they were not able to fit inside, but entered the 30 and 100 μm cavities. In 30 μm cavities, they retained a 3D morphology whereas in 100 μm cavities most of the cells, because of the cavities’ curvature, adhered to the wall and exhibited a relatively flat shape (Fig. 10). The expression of focal adhesion was different for the different cavity sizes. On the 10 μm cavities, the focal adhesions were distributed clearly at the cell periphery in correspondance with the underlying cavity ridge. This anchoring on the cavity ridges allowed the cells to spread extensively and to increase their surface coverage. On the 30 μm cavities, focal adhesions were discernible at the cell periphery, on the flat surface around cavities and on cavity ridges. On 100 μm cavities, focal adhesions were visible either on the wall of the cavities or on the cavity ridges.43 When nanostructuring was added to the cavities, particularly the nanotopography produced by anodisation, the cell response was increased relative to electropolished cavities, demonstrating a synergistic influence of nano- and microstructures. This effect was confirmed for cell proliferation and differentiation after culture on the same surfaces.132 These studies illustrate clearly that for the development of new implant surfaces the topography must be controlled at both the microscale and the nanoscale. However, again attention must be paid to the possible differences in surface composition between anodised and electropolished surfaces since anions could have adsorbed from the electrolyte solution.
It was shown on several materials that nanostructures enhanced osteoblast function compared with conventional forms of the same material.30,287 – 293 This is attributed to enhanced adsorption of proteins that mediates osteoblasts adhesion (such as fibronectin and vitronectin) on the nanostructured surfaces. 294 294,295 TiO2 with nanotubes prepared by anodisation induced a significant acceleration in the growth rate of osteoblastic cells.32 This improved bone-forming functionality was controlled by the nanotube diameter. Small diameter (30 nm) nanotubes promoted osteoblast adhesion whereas larger diameter (70–100 nm) nanotubes elicited a smaller population of cells with an elongated morphology and high alkaline phosphatase activity levels.296 This difference was attributed to the elongation of the cell nucleus on large diameter nanotubes and thus to an intracellular signalling inducing differentiation of stressed cells.
The contact guidance capacity of osteoblasts has also been demonstrated on nanoscale grooved substrates. Osteoblasts were responsive to nanopatterns down to 75 nm in width and 33 nm in depth. Mineralisation driven by osteoblasts followed the surface pattern dimensions and osteoblast specific gene expression was increased on nanopatterns relative to smooth control.112 It was also shown that cellular spreading and adhesion of primary human osteoblasts was reduced on nanoscale pits. More surprising, primary osteoblasts were able to distinguish between square and randomly distributed nanopits.5 Additionally, the focal adhesions formed by primary osteoblasts on square or hexagonal nanopit arrays were predominantly short focal complexes, whereas rather large focal adhesions or supermature adhesions occurred on surfaces displaying nanocraters or nanoislands.3 These studies illustrate the capacity of bone cells to discriminate very shallow differences in the surface topography.
Other bone cells, such as osteoclasts, have been shown to be influenced by topography.297 – 300 In particular, osteoclasts cultured on rougher surfaces revealed a greater capability to differentiate.298 After 3 days of culture, osteoclasts produced more resorption pits on rough bone slices than on smooth ones.297 Unlike osteoblasts, osteoclasts cultured on TiO2 nanotube surfaces displayed a decreased differentiation when the diameter of nanotubes increased.299 Boyan and co-workers studied the capability of rat chondrocytes extracted from two different zones of osteochondral cartilage to proliferate, differentiate, and produce matrix on the same titanium surfaces previously tested with osteoblasts.301 Results were variable when chondrocytes were extracted from resting (RC) or growth zone (GC). In most cases, roughness decreased the proliferation and differentiation capacity of chondrocytes; exceptions were proliferation of GC cells, collagen production by RC cells and synthesis of RNA on both cells. All together, these studies demonstrate that, like osteoblasts, osteoclasts and chondrocytes are able to identify and respond to topography at both the micro- and nanoscale.
Nervous cells
The regeneration capability of the human adult nervous system is limited, making the development of tissue engineering approaches to facilitate neural repair, and in particular to facilitate axon growth and migration, attractive objectives. The contact guidance phenomenon described for other cell types is particularly pertinent in this case. It has been shown that nervous system development is strongly influenced by geometric patterns.302 Xenopus neurites grew parallel to grooves as shallow as 14 nm and as narrow as 1 μm. Hippocampal rat neurites grew parallel to deep and wide grooves but perpendicular to shallow narrow ones. Moreover, the frequency of perpendicular alignment decreased when the age of the embryos increased, suggesting that contact guidance is regulated in development.302
This orientation capacity was maintained when neurites were cultured on astrocyte monolayers.303 The topographical cues in synergy with chemical (laminin adsorption) or biological cues (presence of astrocytes) facilitated neuronal differentiation of rat hippocampal progenitor cells.304 A synergy was also observed with nerve growth factor since the threshold for induction of neuritogenesis by suboptimal concentrations of nerve growth factor was reduced when cells were cultured on 70 and 250 nm ridges.305
The contact guidance of neural cells was also observed at the nanoscale. 12 114 12,114,115 Again a synergic effect was observed between topographical cues with the action of growth factors and laminin adsorption. 14 14,49 The effect of electrospun substrates on neural stem cell differentiation and proliferation was recently demonstrated. 50 51 50,51,306 The possibility of culturing neurites or astrocytes on electrospun polyamide nanofibres covalently modified with a growth factor was investigated.50 The results underline the importance of both surface topography and growth factor presentation on cellular function. The effect of electrospun scaffold architecture on nerve regeneration in vitro and in vivo was recently reviewed.306 As an example, electrospun fibrous tubes were used in vivo to bridge 10 mm nerve gaps in the rat sciatic nerve and showed their efficiency to induce neurite outgrowth and recovery of sensitivity in the hind paw.307
Blood cells
The implantation of blood-contacting medical devices can lead to thrombosis at the blood/material interface with the associated risk of thromboembolic events. Thrombosis occurs because of the activation of platelets. Platelets become activated when they adhere to a surface. Platelet adhesion occurs after adsorption on the surface of proteins, activation of the plasma coagulation cascade and production of thrombin (which will also activate platelets). The activation of platelets by surface topography has been studied on titanium with four different surface finishes, obtained by acid etching, abrasion, machining and polishing. Activation was significantly increased on acid etched and abraded surfaces relative to machined and polished ones.67 The same group observed that it was the surface microtopography rather than the presence of calcium and phosphate that was responsible for platelet activation on calcium–phosphate coated surfaces.61 For an equivalent surface microtopography, a diamond-like carbon coating decreased the adhesion and activation of platelets on silicon chips or Co–Cr alloy substrates, confirming the importance of surface chemistry in platelet activation.60
At the nanoscale, human platelet adhesion was similar on 95 nm high islands obtained by polymer demixing and on a flat control surface.308 However, submicrometre texturing of polymeric biomaterials using soft lithography or polymer demixing decreased the adhesion of platelets. 21 21,104 More recently, the possibility of using multiwall carbon nanotubes (MWCNT) to increase the aspect ratio of surface features on polymeric films was explored. 6 6,55 The presence of MWCNT decreased protein adsorption and platelet activation. Nanostructured surfaces generated by electrospinning promoted the activation, the adhesion and orientation of platelets regardless of the polymer used to prepare fibrous membranes.44 In conclusion, platelets can be said generally to be activated by topography but this activation can be controlled by changing the organisation of the topography (MWCNT) or the surface chemistry (diamond-like carbon).
Macrophages are extensively involved in the process of aseptic necrosis in orthopaedic applications, which is a response to wear debris in the enclosed area of the implant site. Similarly to platelets, macrophage activation has been shown to be influenced by surface topography. Several studies have confirmed that the activation of macrophages is increased on rough surfaces. 65 66 69 134 65,66,69,134,309 Interestingly, this activation induced the expression of BMP-2, a growth factor known for its osteoinductive capacity.65
Contact guidance of blood derived cells such as neutrophils, monocytes and macrophages was studied on micrometric grooves. Approximately 20% of the monocytes and macrophages did orient and after 2 h some of the macrophages extended cellular protrusions along the line patterns.2 Several studies have demonstrated a stimulation of macrophages after adhesion on nanostructured substrates. 13 22 57 13,22,57,131 On nanometric grooves with a depth as small as 30 nm, an elongation of macrophages was observed associated with the expression of focal adhesions along the edges of grooves. 13 13,131 The phagocytic activity increased when the depth of the nanogrooves increased.131 The secretion of cytokines by macrophages was modulated by the dimensions of gratings with reduced levels shown on larger gratings.13
Cancerous cells
Few studies have studied specifically the response of cancerous cells to topography. The migration speed and the alignment of normal T lymphocytes was higher on grooved glass substrates than that of a malignant T lymphoma cell line.310 Carbone et al. compared the behaviour of primary, immortalised and cancer cells on nanostructured TiO2.311 No difference was detected in term of microtubule expression but some differences were observed in the focal adhesion morphology between immortalised cell lines and the others.
A very interesting paper119 compared the orientation, elongation and migration speed of normal and cancerous fibroblastic cells on PDMS substrates of different stiffness presenting lined or pillared microfeatures. The major difference between the two cell lines was the sensitivity of normal cells to both the substrate microtopography and rigidity; the cancer cells were strongly influenced by the substrate topography but not by the substrate rigidity. Normal cells exhibited a persistent type of migration which depended on the substrate anisotropy, whereas the migration of cancer cells did not seem to be affected by extracellular cues. Moreover, the cancerous cells exhibited uncorrelated migration trajectories and a large dispersion in their migration speed distribution.119 Again, this can be correlated with the lower CIL of cancerous cells.232
Recently, a fascinating phenomenon of nuclear deformation of human cancerous bone cells cultured on micropillared poly-L-lactic acid (PLLA) substrates was observed.217 This deformation of the nucleus has never been described before, and surprisingly did not strongly perturb the capacity of cells to survive, divide or express specific bone markers like alkaline phosphatase activity. The nuclear deformation was systematically observed with osteosarcoma-derived cells (SaOs-2, MG-63, U2-OS, OHS4) but not with normal or immortalised bone cells216 (Fig. 11). This capacity for nuclear deformation of cancerous cells could be related to the migration capacity of metastatic cells across tissues. Thus, the nuclear deformation of cancerous cells could be used to develop a test for their metastatic potential. In the same way, PDMS surfaces presenting 400 nm nanopillars or nanolines were used to develop microchannels. This microfluidic approach was used to separate, and enrich in cancerous cells, a mixed cell suspension containing normal and cancer epithelial cells. Separation was based on a difference in adhesion between normal and cancer cells, the last showing a lower adhesion regardless of culture time and surface nanotopography at all flowrates.312 Figure 10
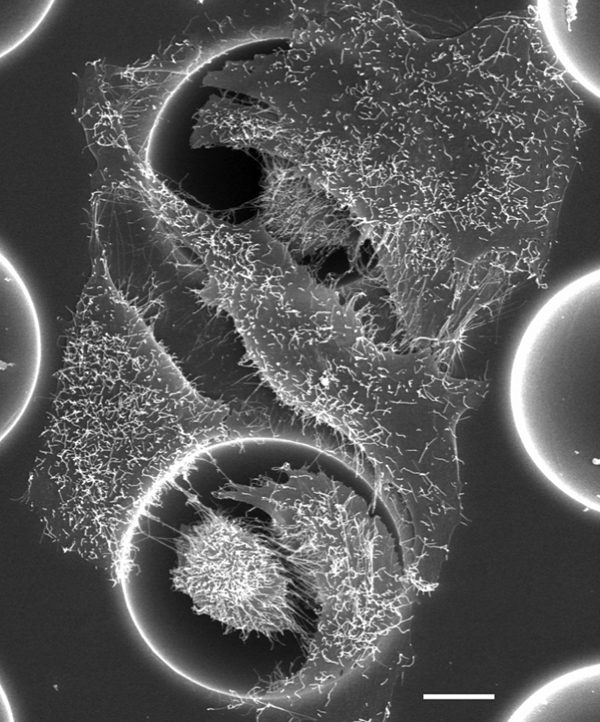
MG63 cells adhering and dividing inside and spreading outside 30 μm cavities on a titanium substrate.43 Bar = 8 μm
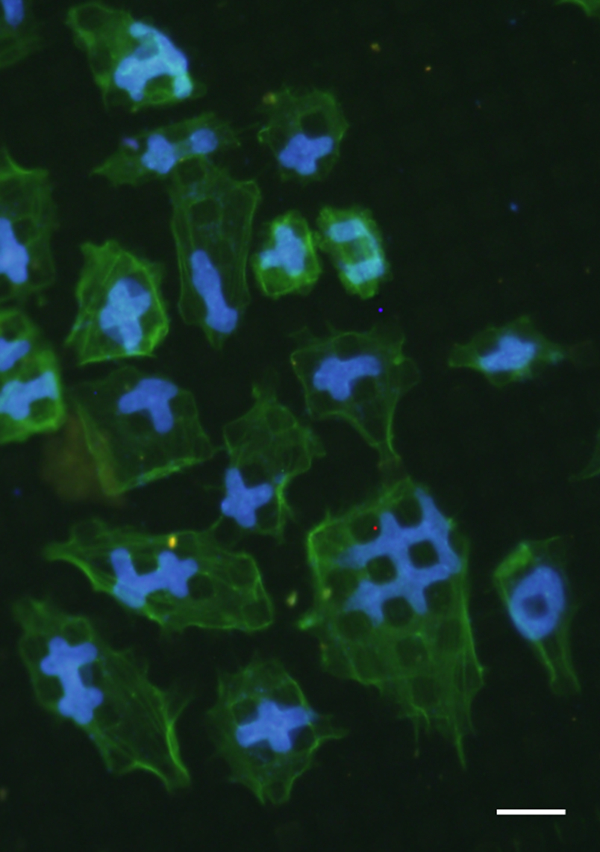
SaOs-2 cells adhering on PLLA micropillars and showing a never seen before nuclear deformation (nucleus: blue (light grey), actin cytoskeleton: green (dark grey))216 Bar = 20 μm
Stem cells
As described above, the term stem cells covers embryonic stem cells (ESCs) as well as adult stem cells. Relatively few papers have dealt with the response of embryonic stem cells to surface topography. Stem cells live in the body in a defined microenvironment that controls both their differentiation and their self-renewal. In order to control the in vitro microenvironment of murine ESC (mESC) a cell patterning chip was developed. This chip allowed modulation of cell–cell contacts and then control of the formation of mESC colonies.118 The culture of human ESC (hESC) on PDMS substrates with submicrometre line-grating (600 nm ridges with 600 nm spacing and 600 nm height) confirmed the capacity of hESC to align and elongate along the groove direction as well as the involvement of cytoskeletal components in this contact guidance ability.313 The induction of hESC without additional stimulative factor to differentiate into neuronal lineage was observed when the cells were cultured for 5 days on nanoscale ridge/groove pattern arrays on polymer.314
Most of the literature in this field concerns the rugophilia of adult stem cells. The culture of tendon stem progenitor cells (hTSPC) on aligned or random PLA nanofibres showed that they expressed more tendon specific genes on aligned nanofibres than those on randomly oriented nanofibres. In contrast, randomly oriented fibrous scaffolds induced differentiation of hTSPC into bone cells. These results were confirmed in vivo since the aligned nanofibres induced the formation of tendon-like tissues after implantation in nude mice.48 This study demonstrates clearly that stem cell differentiation is controlled by the organisation of the environment and thus that these cells are able to identify this organisation. This effect was also observed with human mesenchymal stem cells (hMSCs).1 In a very elegant study, it was demonstrated that hMSCs were able to differentiate on PMMA surfaces presenting 120 nm diameter pits (100 nm deep, 300 nm spacing) with hexagonal, square, displaced square 50 (±50 nm from the centre = DSQ50) and random placements. The most surprising result was that hMSCs differentiated more in the osteogenic pathway on DSQ50 than on the other surfaces and that their differentiation occurred without the stimulation with osteogenic media that is generally needed to induce it.1 MSCs are also able to identify and respond specifically to the size of surface features at both the micro- and the nanoscale. The expression of genes involved in the integrin pathway was upregulated when STRO-1 progenitor cells were cultured on 300 nm deep and 100 μm wide grooves, whereas it was downregulated on 300 nm deep but 10 μm wide grooves.106 On titanium nanopillars, the spreading capacity, organisation of cytoskeleton and differentiation of hMSCs was impeded when nanopillars height increased from 15 to 100 nm.41 The same was observed on nanotubes produced on Ti substrates by anodisation.34 Small (30 nm diameter) nanotubes promoted adhesion without noticeable differentiation whereas larger (70 to 100 nm diameter) nanotubes elicited a dramatic MSCs elongation which induced their differentiation into osteoblastic cells. It is important to note here that other authors, using rat MSCs and the same nanotube dimensions, observed decreased adhesion, migration, proliferation and differentiation when the diameter of nanotubes increased.33 This difference was explained by the different nature of the nanotubes: as-anodised amorphous TiO2 nanotubes33 versus heat-treated and crystallised anatase phase nanotubes.34 The effect of these titania nanotubular surfaces was confirmed in vivo.35 All together, the results on nanotubes clearly demontrate that cells, and notably adult stem cells, identify not only surface roughness but also subtle changes in surface chemistry and surface mechanics.
Comparisons between cell types
Several papers have compared the behaviour of cells of diverse origins on the same topography. In some cases, behaviour was similar, in particular when the studies concerned contact guidance. 45 92 108 111 315 45,92,108,111,315,316 Fibroblast and MSC behaviour as a function of surface topography was in general comparable. 108 108,315 MSC behaviour was postulated by several authors to be the same as osteoblast behaviour, 3 4 3,4,106 but to our knowledge they were not compared directly.
When fibroblasts were compared with osteoblasts, in most cases the authors observed that fibroblasts ‘preferred’ smoother surfaces whereas osteoblasts adhered, proliferated and differentiated better on rougher surfaces. 68 88 295 317 68,88,295,317,318 On patterned surfaces, fibroblasts were generally more sensitive to surface topography than endothelial cells 53 84 136 53,84,136,308 or epithelial cells. 2 111 2,111,130 In particular, they elongated and oriented more than endothelial cells on PDMS substrates displaying microgrooves with nanometre depth. The minimum groove depth to induce orientation was half that for endothelial cells.120 On the other hand, fibroblasts are relatively robust compared with other cell types. For example, when fibroblasts and endothelial cells were cultured on zinc oxide nanorods, fibroblasts stayed viable after adhesion whereas most endothelial cells died.53 Compared with fibroblasts, smooth muscle cells appeared less sensitive to surface topography, 120 120,317 although myoblasts or myocytes oriented and proliferated similarly. 92 92,135 Smooth muscle cells appeared to orient similarly to endothelial cells on grooved substrates.120 However, they adhered preferentially on conventional and microstructured PLGA substrates relative to nanostructured ones whereas the reverse was observed with endothelial cells.38 On laser-nanostructured polystyrene, the alignment of epithelial cells and myoblasts along the direction of the structures was different. Epithelial cells oriented on PS irradiated at 15°, whereas myoblasts needed deeper patterns irradiated at 45° to align.111 Similarly, smooth muscle cells appeared largely less sensitive to nanostructured Ti6Al4V substrates than osteoblasts.317
When osteoblasts were compared with endothelial cells, osteoblasts spread more and expressed more focal adhesions on nanostructured surfaces.56 Moreover, endothelial cells were less sensitive to nanotopography modifications than osteoblasts.295 In contrast, epithelial cells appeared more sensitive to microtopography than osteoblasts. They adhered and spread on polished and plasma sprayed titanium surfaces but not on sandblasted surfaces, whereas osteoblasts seem to adhere to all surfaces.72 Interestingly, experiments done on surfaces presenting tapered pits at the microscale confirmed that when epithelial cells from the periodontal area were cultured on pits they became trapped inside pits, unlike osteoblasts.125 However, when the space at the top was narrower, the epithelial cells had a tendency to cover the top of the pits. When cells were inoculated at high density the epithelial sheets migrated onto the ridge of the pits until covering a significant number of pits. In the same study, results obtained in vivo confirmed these in vitro observations.125
Compared with permanently adherent cells such as fibroblasts, osteoblasts, epithelial cells, or endothelial cells, blood derived cells appeared largely less sensitive to surface topography. 2 308 2,308,318 Cell orientation following grooves was observed on 20% of macrophages when 100% of fibroblasts aligned.2 An overview of the relative behaviour of different cell types versus topography is presented in Table 3.
Comparison of the behaviour of cells of different origins as a function of surface topography*
*≠ cells present different behaviour as a function of surface topography.
= cells present similar behaviour as a function of surface topography.
? The comparison of the behaviour of these cells on the same surfaces was not performed.
Conclusions
At the end of this review, it is clear that every cell type is able to identify and to respond to surface topography (and associated modifications of surface energy and protein adsorption) even when topography is considered at the nanoscale, i.e. at a scale greatly smaller than that of the cells themselves. However, the response and sensitivity to topography vary as a function of each cell’s phenotype. For example, it has been clearly shown that fibroblasts adhere more on smooth surfaces, whereas osteoblasts have a preference for rough surfaces. This can be related to the organisation of their natural extracellular matrix in their tissue of origin.
The capacity for contact guidance has been observed almost universally on adherent cells; among the blood cells only the most adherent ones (macrophages, monocytes) have shown this capacity. Every cell type is sensitive to the size and the distance between surface features but also, more surprisingly, to the organisation of surface features. A synergy has often been observed between the influence of surface topography and environmental factors such as other cells, growth factors or extracellular matrix proteins.
Finally, it is essential to adapt the topography of an implant or other biomedical material as a function of the tissues and cells concerned, and of the objective sought: to develop grooves to favour migration and elongation of neurites, to modify the topography to induce coverage of surface by epithelium or endothelium, to reduce the activation of platelets, to increase the adhesion of osteoblasts, etc.