
Abstract
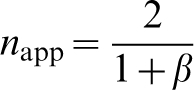
The literature data on the superplastic deformation of high purity yttria stabilised tetragonal zirconia polycrystals is reviewed in detail. It is shown that, based on the existence of a threshold stress, the single mechanism of grain boundary sliding (GBS) accommodated by diffusional processes can explain the superplasticity of these materials over all the ranges of temperature, stress, grain size, and surrounding atmosphere that have been studied. The origin of the threshold stress and its quantitative dependence on temperature and grain size is explained in terms of the segregation of yttrium atoms at the grain boundaries. A new model for GBS accommodated by lattice or grain-boundary diffusion is presented which can explain the transition of the stress exponent from 2 to 1.
Introduction
Since Wakai et al. 1 published the first observation of superplasticity in a 3 mol.-% yttria stabilised tetragonal zirconia polycrystal ceramic (Y-TZP) with a grain size of 0·4 μm, considerable effort has been put into the search for new superplastic ceramics. There is now a long list of ceramics and ceramic composites with superplastic behaviour. It is important both scientifically and technologically to determine the factors controlling the superplastic response. Technologically, for example, ceramic parts of complex shapes may be fabricated under advantageous processing conditions by superplastic forming 2,3 and joining. 4–6
With respect to the yttria–zirconia system in particular, there have been many studies of the superplastic deformation of fine grained zirconia polycrystals as a function of yttria content, impurities, temperature, grain size, type of test (tension or compression), and oxygen partial pressure. Reviews of this topic 7–10 report different, and indeed often conflicting, creep parameters for nominally similar materials tested under identical experimental conditions.
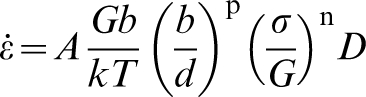
In most of these papers, the experimental results were analysed according to the classical creep equation
8

The values reported for the parameters n, p and Q, which determine the mechanisms controlling the superplasticity, vary widely for nominally identical materials under similar experimental conditions. The trends in the deformation parameters that are reflected in the data can be conveniently separated into four categories: stress exponent versus stress, stress exponent versus grain size, grain size exponent and activation energy.
Stress exponent versus stress
For ceramics with mean grain size below 1 μm, the values of the stress exponent n depend strongly on the impurity content: n≈2 for low purity materials over the entire range of stresses, whereas n ranges between 2 and ≧3 for high purity materials depending on the stress level, being 2 for the higher stresses and ≧3 for the lower stresses. 8,9,11–14 As pointed out in Ref. 14, the superplastic behaviour in TZP is sensitively affected by residual impurities. In this regard, we defined high purity materials when the impurity content is < 0·10 wt-%. 8
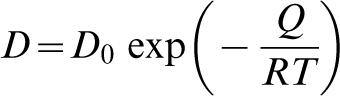
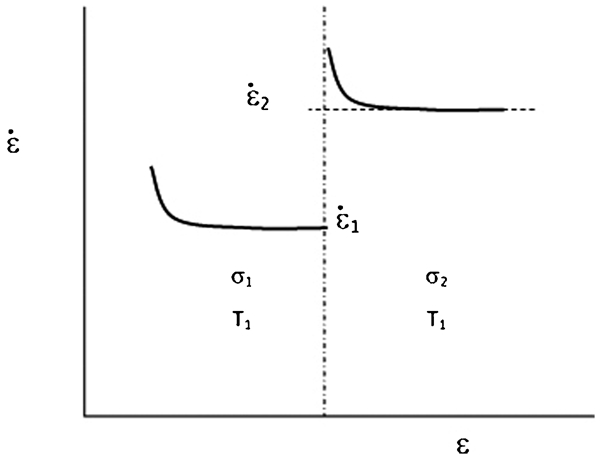
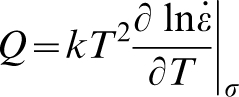
At very low stresses, the stress exponent tends to 1. 14,15 This trend has been described 16 in a plot of the strain rate versus stress, in arbitrary units, showing the different domains of values of n and Q (Fig. 1). The values of Q given in the figure will be discussed in a later section. At very low stresses, deformation occurs by Nabarro–Herring diffusional creep (Region I), with the n values tending to 1 and Q being ∼460 kJ mol−1. 8,15 When the stress increases, the creep parameters cease to be constant, with values of n from 3 to >5 being reported (Region II). 8,11,17–22
Strain rate versus stress in arbitrary units, showing different domains with values of n and Q
For materials with grain sizes smaller than 1 μm and with a high concentration of impurities or with glassy phases, the stress exponent has been found to decrease to 1 with increasing stress. 23–26 The mechanisms which appear to give the best explanation of this behaviour take into consideration the presence of a vitreous intergranular film whose thickness, of ∼1 nm, can provide diffusion paths for matter transport. At high stresses, diffusion in the glass is the controlling mechanism, whereas the entry into solution of atoms on the grain surface seems to dominate at low stresses. This mechanism will be discussed in detail in the section on ‘Nature of grain boundaries’.
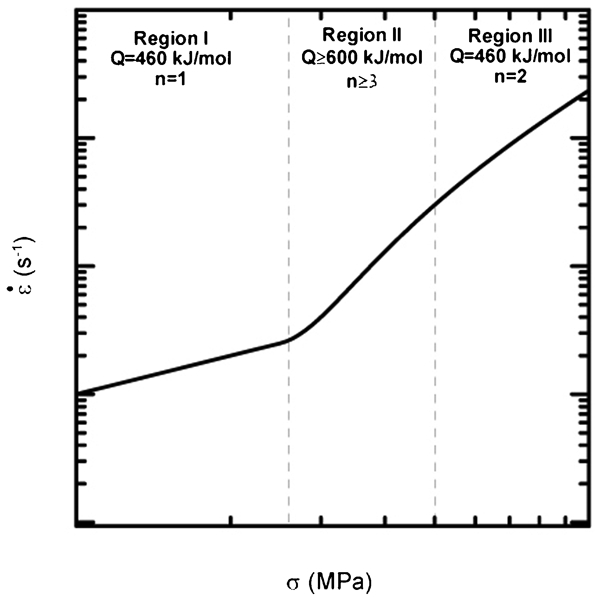
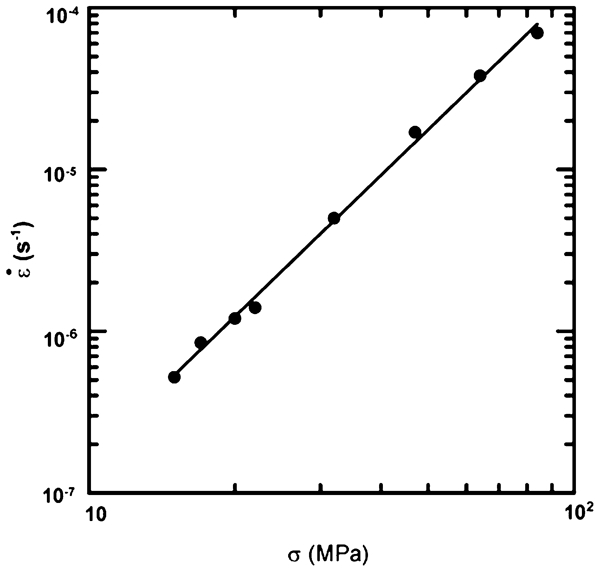
Debschütz et al. 12 reported a decrease in n from 4·5 to 2·2 as the stress increased from 20 to 50 MPa at 1200°C in high purity 3Y-TZP with d = 0·5 μm. At higher stresses, the value of n becomes 2 (Region III) 8,11,17 (Fig. 1). Figure 2 is a plot of true values of strain rate versus stress, with the data from various workers on high and low purity TZP samples deformed at 1400°C. For the sake of clarity, the plot represents values of TZP creep for grain sizes in the range 0·4–0·5 μm. Because there is little data available at very low stresses, we extrapolated data for TZP with a grain size of 0·8 μm (Ref. 15) to values of 0·5 μm using a grain size exponent of 2 (the reason for this grain size exponent is explained in the sections on ‘Grain size exponent’ and ‘Grain boundary sliding with threshold stress’). One observes the clear similarity between Figs. 1 and 2.
Variation of strain rate with stress from different authors for high and low purity yttria stabilised zirconia polycrystals (YSZP), and grain sizes between 0·4 and 0·5 μm, and deformed at 1673 K: we also represent values for low purity YSZP, 17 as well as values for YSZP with grain size 0·8 μm deformed at low stresses which have been transformed to values of 0·5 μm using grain size exponent of 2 (Ref. 15)
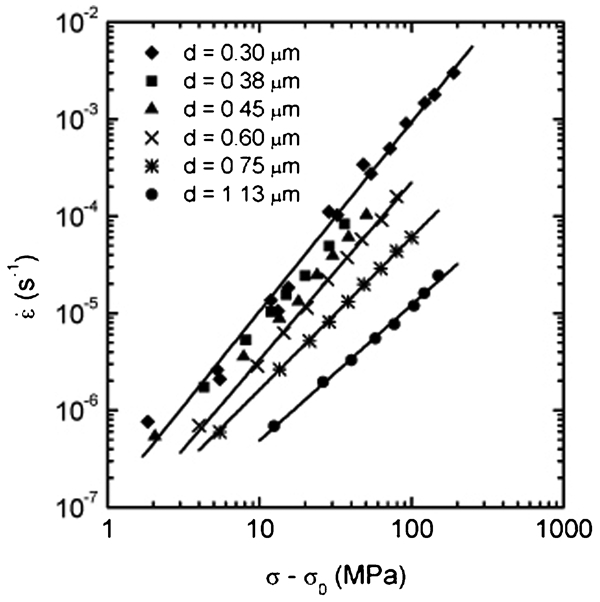
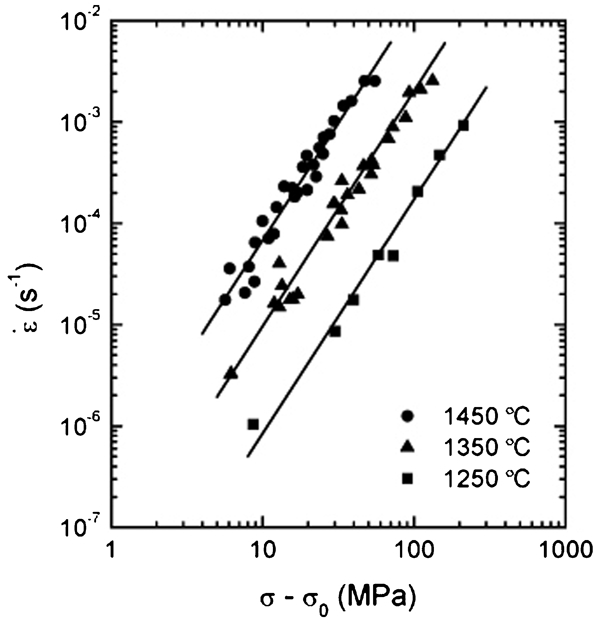
The transition stress separating the higher (n≈2) from the lower (n≧3) stress region depends on d and T. For a given T, the transition stress decreases when the grain size increases (Fig. 3a ), and, for a given grain size, the transition stress increases when T decreases (Fig. 4). 8,9
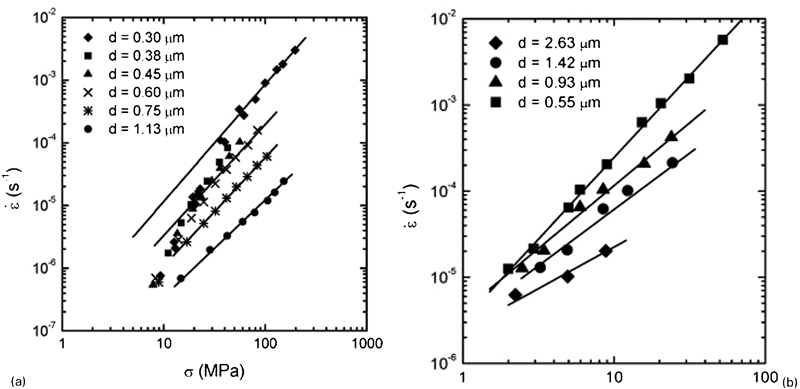
Strain rate versus stress at constant temperature for a set of investigated samples
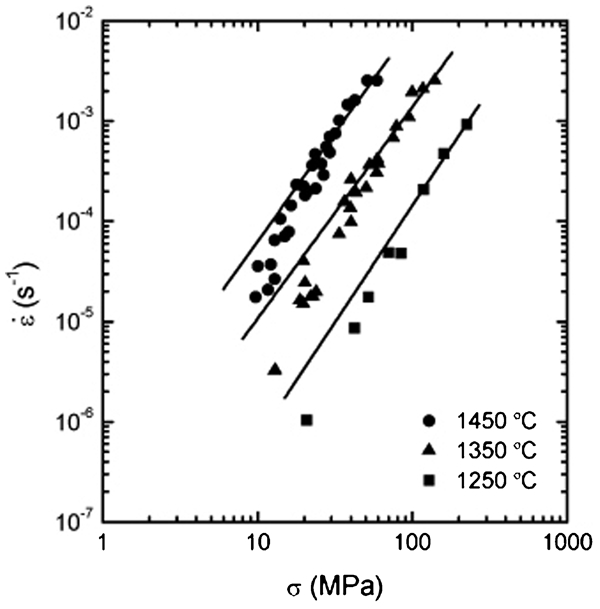
Strain rate versus stress for samples with grain size of 0·5 μm and deformed at 1250, 1350 and 1450°C: 9 one observes how transition stress separating higher from lower stress region increases when T decreases
Stress exponent versus grain size
When the grain size is >1 μm, there is a decrease in the stress exponent which tends to 1 as the grain size increases (Fig. 3). Figure 3a is a plot of strain rate versus stress at a constant temperature of 1350°C for samples from the same source but with different grain sizes. 28 It includes values from both tensile and compressive creep tests. 18 One observes that the creep rates are independent of the testing method (tension, compression). The same behaviour was found by Wakai et al. 29 in YSZP deformed at 1450°C, where the stress exponent decreased from the value of 2 for fine grained (0·55 μm) to ∼1·2 for coarse grained ZrO2 polycrystal material (2·63 μm) (Fig. 3b ).
At this point, we must emphasise that the creep rates are also independent of the testing atmosphere (oxygen partial pressure), 30 as also found in cubic yttria stabilised zirconia single crystals 31 and polycrystals. 32 As indicated above (Fig. 3a ), samples with the smaller grain sizes exhibit a nonlinear dependence while samples with the larger grain sizes exhibit a linear dependence, a behaviour that will be discussed below. In the case of YSZP ceramics, values of n = 1·5±0·3 are also reported for a grain size of 1·8 μm. 33 Quite recently, Tekeli et al. 34 reported stress exponent values equal to 1 in TiO2 doped 8 mol.-%Y2O3 stabilised ZrO2 with grain sizes between 1·6 and 4·5 μm under both tension and compression. Nauer and Carry 24,35 and Lakki et al. 25 find a transition in the stress exponent from 2·4 to 1·2 with an increase in the imposed stress.
The stress exponent of 99·4% dense MgO specimens at 1500–1600°C is equal to 1, with the mechanism controlling plasticity being grain boundary diffusion. 36 The same is the case for Li doped MgO’s deformed in a superplastic regime with n between 1·1 and 1·2. 37 A value of n≈1 has also been reported for the creep of polycrystalline MgO tested under bending at 1107–1527°C. 38–40 Ruano et al. 41 list eleven studies (Table 4 of that reference) of polycrystalline alumina in which the stress exponent was found to be ∼1. The data were explained by the GBS model with the rate controlling mechanism suggested to be dislocation glide, although without any microstructural support for this assumption.
This stress exponent versus grain size response has also been reported in polycrystalline Al2O3, when n is equal to 1 and the grain size larger than 1 or 2 μm. 42 Also values between 1·5 and 2 have been found, depending on the grain size. 43–45
There are also examples showing that n = 1 in NiO polycrystals with grain sizes between 9 and 21 μm, 46 and in UO2 with grain sizes between 2 and 10 μm. 47 Both of these ceramics deform by grain boundary sliding (GBS). In a review of the literature for UO2, Ruano et al. 48 find a number of studies presenting a value of n = 1 which they re-analyse as a Harper–Dorn mechanism. They do not, however, present any convincing proof such as microstructural characterisation or lack of dependence on grain size.
It is clear that many studies on MgO, Al2O3 and UO2 show a linear relationship between strain rate and stress which is explained in terms of diffusional models even though the measured strain rates are some orders of magnitude different from that predicted by creep models. 49 This discrepancy is usually put down to different impurity levels or, in some cases, to the experimental technique used, e.g. in bending beam experiments. Lacking is an in-depth microstructure characterisation, which would be able to unambiguously reveal the rate controlling mechanism. When a sample is deformed by a diffusional process, the grains are elongated with almost the same deformation as the sample. When the sample is deformed by GBS, however, the grains maintain almost the same shape and form factor.
Grain size exponent
Similar discrepancies have also been reported for p, with values ranging between 1 and 4 (the literature values are listed in Refs. 7 and 8). The explanation suggested was in terms of the level of impurities in materials obtained from the same source, or in there being a slight variation in the level of yttria content in the different studies. 7 However, as indicated in Table I of Ref. 8, although values of p = 3 and p = 1 have been reported for high (Region III) and low (Region II) stresses respectively, the conditions were such that n varies with d, thus preventing any correct determination of p. Instead, the explanation could be the dependence on d of the transition stress from the high (n≈2) to the lower (n≧3) stress region. Note that p = 2 is the only value reported for coarse grained YSZP 8,33,50 where the plot of strain rate versus stress is a straight line. On the other hand, when the data are analysed in terms of Nabarro–Herring diffusion creep, the p value is close to 2. 32
For the finer Y-TZP, there are examples 8,9,17 showing the apparent change in p when strain rate is plotted as a function of stress for YSZP with different grain sizes: the values of p decrease continuously from 2 to lower values, even to zero, as the stress decreases. One can also find a discrepancy if the value of p is obtained from samples with coarse and fine grains. Figure 5 shows, from the data of Fig. 3, the variation of p as a function of grain size due to the change in n. Note that values of p>2 are obtained if one takes into account YSZP with coarse grains in which n tends to 1, which would explain the values of p between 1 and 3 reported in the literature.
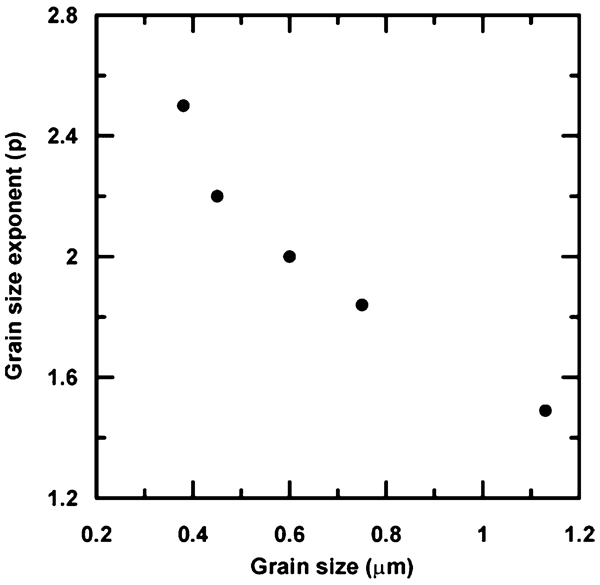
Grain size exponent versus stress from data represented in Fig. 3
Activation energy Q
The d and T dependence of the transition stress from the high (n≈2, Region III) to the lower (n≧3, Region II) stress region critically affects the determination not only of the grain size exponent, as indicated in the foregoing section, but also of the activation energy. Its value will thus be strongly influenced by the stress level, grain size and working temperature. This is clearly shown in Figs. 3 and 5 of Ref. 9, and it can be inferred from Fig. 4. For the finer grain size (d = 0·5 μm), Q decreases from 700 kJ mol−1 at 1250–1300°C to 540 kJ mol−1 at 1400–1450°C, at a similar stress level (σ≈ 25 MPa). For a specific temperature (1400–1450°C), Q decreases from 540 kJ mol−1 for d = 0·5 μm and 25 MPa to 470 kJ mol−1 for d = 0·8 μm and 40 MPa. A similar variation of Q with d at a fixed stress was reported by Wakai et al. 29 in high purity 3Y-TZP. The value of Q decreased from 603 to 455 kJ mol−1 as d increased from 0·5 μm (where n = 2·9) to 1 μm (where n = 2·1), at σ = 20 MPa. The value of Q deduced when n≈2 (Region III) is close to that reported in the creep of coarse-grained YSZP, 30,51,52 where n < 2, and for Y2O3-stabilised cubic-ZrO2 single crystals, regardless of the Y2O3 content. 53–56 This may be the reason for the large discrepancy in the values of the activation energy reported in the literature. 7–9,11,34,25
In conclusion, on the basis of the data reported in the literature, the mechanical behaviour of yttria stabilised zirconia polycrystals (YSZP) can be summarised as follows:
Ceramics with low purity behave straightforwardly, with a stress exponent equal to 2 and an activation energy in the interval 450–500 kJ mol−1. In this low purity regime there are only two values of the grain size exponent, both close to 2. 7
From Fig. 1, for high purity submicrometre grain size YSZP, the behaviour is more complicated. In Region II, the stress exponent (n) is as high as 5, the activation energy (Q) as high as 700 kJ mol−1, and the grain size exponent (p) is 1, whereas in Region III, n is 2, Q is in the interval 450–500 kJ mol−1, and p is 2.
For ceramics with high purity and coarse grain size (d≧1 μm), n decreases from a value of 2 to 1 as the grain size is increased, and Q tends to a value in the range 450–500 kJ mol−1. As noted above, since p is determined by comparison of the strain rate with samples of different grain sizes, there is no unequivocal value for this parameter.
Nature of grain boundaries
Before discussing the possible accommodation processes controlling superplasticity, we shall consider how the nature of the grain boundaries can alter superplastic behaviour.
It is well known that grain boundaries are sinks or sources of point defects, and that when secondary phases are added, normally as sintering aids, they are distributed along the grain boundaries and triple-point junctions of the grains. Consequently, depending on their nature, they may enhance or hinder the diffusion processes controlling superplasticity.
There have been many studies dealing with the influence of grain boundary segregation on superplasticity in ceramics. They have shown that the yttrium in YSZP polycrystals segregates at grain boundaries, and that this segregation can explain the superplastic behaviour (see the section on ‘Grain boundary sliding with threshold stress’ below).
The segregation of yttrium atoms whose electric charge is different from that of the parent ions induces a local negative charge density produced by the 
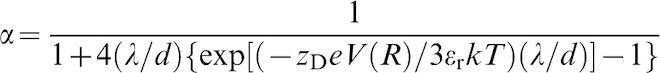
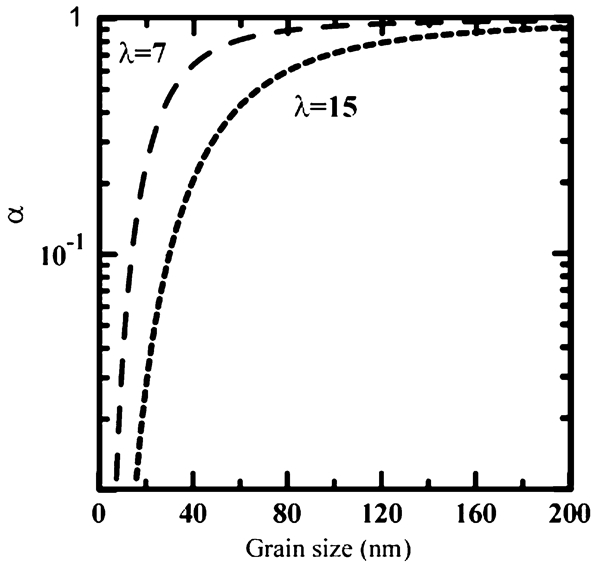
Variation of α versus grain size for different Debye screening depths according to equation (3): for details, see Ref. 47
Whereas there have been many publications dealing with submicrometre sized Y-TZP, there have been far fewer considering the nanometre scale. This is mainly because fully dense nanocrystalline Y-TZPs have only recently become available. Improved creep resistance has been reported in 50–70 nm Y-TZP deformed at 1200°C, in agreement with model predictions. 58–63 In this regard, it has been shown that the effect of segregation becomes increasingly important as the grain size becomes smaller. Indirect experimental evidence for this is shown in Fig. 7.

Normalised strain rate (
Only a few papers 64–66 have been published on nanocrystalline monoclinic ZrO2. However, in monoclinic materials there is no segregation at the grain boundaries, and the predictions of the model when segregation occurs can not be tested. Further systematic work on well defined systems is therefore needed at this point in order to verify the importance of electric fields in the diffusion process when the grain size decreases down to the Debye length scale. The creep behaviour of nano-YSZP is beyond the scope of the present review.
Cation segregation to the grain boundaries in Y-TZP has been interpreted in the light of a fairly rough model in which the ionic radius of yttria cations, larger than those of zirconium ions, induces an elastic energy locally in the lattice. Such energy in excess must be released by segregation to the grain boundaries due to the more favourable steric conditions, and the superplastic flow has been correlated with the ionic radius of the corresponding dopant, 67,68 as reported for 3Y-TZP specimens deformed at 1400°C. Cations with smaller ionic sizes reduce the flow stress, and vice versa. In the context of a more rigorous model, such as the bond valence model, 69 segregation can be described as a logical consequence of the change of the average bond lengths of the cations near the grain boundary. The bonds tend to minimise their size at the boundaries. According to the distortion theorem, such change must be correlated with a change in the effective valence bonds: the valence must decrease. One straightforward manner to achieve this is by an increase of the yttrium versus zirconium atom ratio. In any case, as suggested in Refs. 67 and 68, the flow stress is determined by grain boundary diffusivity, which in turn is affected by dopant segregation.
When a secondary glassy phase is added as a sintering aid, it may act as a lubricant for GBS, as a preferential location for the nucleation and growth of cavities, or to improve the diffusivity pathways along GBs and consequently also the flow stress and elongation to failure. This has indeed been found in barium and borosilicate doped 3Y-TZP. 70,85 In the case of non-oxide ceramics, such as SiC and Si3N4, their densification is normally achieved with sintering additives which, by reacting with SiO2 present in the surfaces of the powders, promote the formation of a higher diffusivity phase, melting at a lower temperature, and consequently producing the densification of these ceramics. The result is a two-phase composite consisting of a hard phase surrounded by a soft secondary glassy phase.
In the case of Si3N4, glass pockets and a thin glass film of ∼1 μm thickness often remain at the grain boundaries. 71 The viscosity of the intergranular glassy phase, together with the solubility of the crystalline phase in the liquid and its diffusivity, have often been found to control plasticity. 72–75 The solid solution of silicon nitride with some aluminium based compounds or mixtures forms the so called α′- or β′-SiAlON compounds. These become superplastic with the addition of a secondary glassy phase. For example, Rosenflanz and Chen reported that Li doped SiAlON deforms 10 times faster than Si3N4. 76 A review of the mechanical properties of these compounds can be found in the literature. 72,73 The enhancement of superplastic deformation by an intergranular glass phase is also applicable to liquid phase sintered SiC. 77,78
For ceramics with a secondary glassy phase, the accommodation processes are governed by this phase in different ways:
the glassy phase may act as a lubricant for GBS
it can improve the diffusivity pathways along GBs
it can provide a preferential location for the nucleation and growth of cavities.
The secondary phase melts at a temperature lower than the matrix, and, provided that the crystals are at least partially soluble in the glassy phase, creep may take place by:
solution of the crystal in the liquid phase at grain boundaries under compression
diffusion through the liquid phase
precipitation of the crystalline material at grain boundaries under traction.
This is the central picture of the so called solution precipitation model, developed by Raj and Chyung 79 and subsequently modified. 75,80,81 In the modified model, 75,81 it is assumed that solution and precipitation take place at steps (kinks) formed at the grain boundaries. The solution precipitation process involves the movement of these kinks, and the strain rate is therefore related to the kink velocity and density. The modified model’s prediction of the creep laws as a function of kink density are presented in a simplified form in Table 1. 81 As can be observed, the creep laws are similar to the Coble model, with the rate controlling processes being the diffusion in the liquid phase or in the adsorption layer.
*D L and D S are the liquid phase and adsorption layer diffusion coefficients.
†τ K is a characteristic relaxation time for the integration of solute at kinks.
An amorphous intergranular film is formed in low purity, unintentionally doped YSZP due to the segregation of the impurities resulting in rounded triple points that contrast with the sharp triple points observed in high purity YSZP. Thus, the mechanical behaviour of these low purity materials can no longer be regarded as genuine examples of the behaviour of YSZP ceramics. The strain rates for these materials 34,35,82–84 and for YSZP with glass phase 84–89 and CuO 90–92 additives are systematically above the strain rates for high purity materials. 70,85 The solution precipitation creep model has often been used to explain the superplastic behaviour of YSZP containing grain boundary phases. 85,86,91
The same improvement of the superplasticity has been found in 0·3 mol.-%SiO2 doped 3Y-TZP with d = 0·35 μm and 0·18 mol.-%Al2O3 doped 3Y-TZP with d = 0·4 μm. 68,93 This behaviour also seems to apply to fine grained Al2O3 with ZrO2 as a dopant. 94,95 Recently, for a YSZP doped with 4·8 wt-% titania, 96 it was suggested that the mechanism controlling superplasticity may be of a Coble type, described by equations similar to those of the solution precipitation model in ceramics with secondary phases (see Table 1).
The main concern in doping YSZP is to improve its superplasticity or to achieve high strain rate superplasticity. The mechanisms underlying these behaviours have yet to be the focus of study, however, and a more detailed understanding is required before any conclusions can be drawn. In the present review, therefore, the superplasticity of doped YSZP will not be dealt with.
For the sake of clarity, we shall concentrate in this review on high purity YSZP in which the occurrence of yttrium segregation is well established. We shall divide the analysis into two parts: materials with fine grain sizes of <1 μm and materials with coarse grain sizes (d≧1 μm).
Flow processes in fine grain size YSZP
Although, as mentioned in the previous section, YSZP creep parameters are strongly affected by grain size, impurity level, stress, temperature, etc., it is now broadly accepted that GBS is the dominant deformation mechanism both in metals 26 and in ceramics. 8,9,19,26,97 During GBS, motion of a rigid grain is a combination of translation and rotation, and the relative motion of two adjoining grains has components parallel and vertical to their common grain boundary. Grain boundary sliding is the component parallel to the grain boundary, and its contribution to the total strain is determined by the relative motion of neighbouring grains. 97,98 As in metals, it represents from 70 to 80% of the total strain in the superplasticity of fine grained ceramics. 99–101
As indicated in the previous section, for submicrometre grain size YSZP ceramics, the transition stress from Regions II to III is grain size and temperature dependent, and decreases with increasing grain size. This behaviour has formed the basis for three models developed to account for the experimental creep data. We shall summarise them critically in the following sections.
Two sequential processes
This approach to understanding superplasticity is due to Owen and Chokshi. 102 It is based on their own experimental results over a wide range of stresses which revealed a transition in the stress and grain size exponents for creep in the two regions described above: in Region II, n≈3 and p≈1, and in Region III, n≈2 and p≈3, with the transition stress decreasing with increasing grain size. The reported activation energy was the same in the two regions with a value of ∼550 kJ mol−1. Microstructural measurements revealed that grains remained essentially equiaxed with almost no grain growth. In this framework, the rate controlling deformation mechanism consists of the operation of two sequential processes. At higher stresses (Region III), as in metals, superplasticity is understood in terms of GBS and an accommodation by intragranular dislocation motion. At lower stresses (Region II), the deformation is controlled by an interface reaction controlled process for GBS.
There are several reasons for rejecting this approach, however:
Owen and Chokshi reported a constant n value equal to 3 in Region II and 2 in Region III. This exponent was usually obtained from 


Owen and Chokshi also reported a p value equal to 1 in Region II and 3 in Region III, and values of p between 1 and 4 are reported in Refs. 7 and 8. As was indicated in the section on ‘Grain size exponent’, however, the value of p can be mis-estimated due to the change of n with stress in submicrometre YSZP 8,9,11 or with grain size in micrometre YSZP. 28,29
It is difficult to understand why the activation energy should have the same value for the different accommodation processes at high and low stresses. At high stresses, the intragranular dislocation motion is by non-conservative climb because the activation energy is close to the value for cation lattice diffusion, 8,9,33,53–56 in which case the dislocations act as perfect sources or sinks of point defects. At low stresses, at which the interface reaction process controls superplasticity, there is a retardation in the accommodation process because the sources and sinks of point defects are now imperfect, implying an increase in the activation energy.
The stresses needed to activate dislocations in cubic zirconia single crystals (170–300 MPa), 103 as well as in tetragonal yttria stabilised zirconia single crystals (400 MPa) 104 when deformed at 1400°C and strain rates ∼10−5 s−1 are a factor of 20–40 times greater than in Y-TZP deformed under the same experimental conditions. It is easy to believe that dislocations can not be activated in this system for the conditions under which superplasticity is studied. In addition, neither a sample of Y-TZP deformed by tension in the superplastic regime and cooled down under load to avoid the recovery of dislocations nor another sample quenched after deformation show dislocation activity. 16
Logarithm of strain rate versus logarithm of stress of sample with grain size 0·3 μm deformed at 1573 K: from this plot, stress exponent n is equal to 3; data are obtained from plot of strain rate versus stress from Ref. 11 in which values of n from 5·2 to 2·5 are shown
Interface controlled diffusion creep
Based on the creep data of Ref. 102 and on the idea that GBS can not be accommodated by intergranular slip, Berbon and Langdon
105
suggested that the flow process in 3Y-TZP is controlled by Coble creep instead of two sequential processes. There is a well defined crystallographic structure in grain boundaries in which grain boundary dislocations act as discrete sources and sinks for vacancies through their non-conservative motion in the boundary planes. The presence of these discrete sources and sinks significantly modifies the continuum models of diffusion creep by introducing an interface controlled behaviour. The characteristics of this interface controlled diffusion creep were addressed in some detail by Arzt et al.
106
in a work that makes two main assumptions: first, that the cores of the grain boundary dislocations are not perfect sources and sinks for vacancies, and second, that the dislocations are evenly spaced in the boundary planes so that they all climb at the same speed. The Coble diffusion creep equation is then replaced by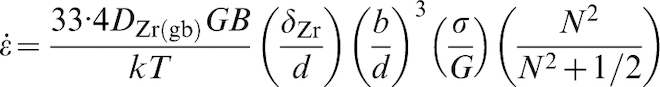
As noted above, the flow process model developed by Berbon and Langdon 105 is based on the creep data of Ref. 102, so that the same criticisms outlined in the section on ‘Two sequential processes’ also hold for this approach. However, there are two other major objections:
First, it is generally accepted that during Coble creep, grains of the polycrystal will change shape to reflect the overall strain within the sample. However, in the work of Owen and Chokshi, 102 the microstructural evaluation of the deformed samples indicated that the average grain size and grain shape remained almost unchanged. Indeed, this is commonly observed in the superplasticity of Y-TZP 8,9,11,18,20,107 and has been the main supporting evidence for GBS as the mechanism controlling superplasticity. Work applying different techniques to measure the contribution of GBS to the superplasticity of metals and ceramics 7,100,108,109 has concluded that GBS accounts for essentially all the deformation under optimal superplastic conditions.
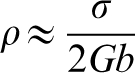
Second, in the modified Coble equation (equation (4)), N is the number of dislocations in a single grain boundary wall and is equal to ρd, where ρ is the surface density of grain boundary dislocations
106

Grain boundary sliding with threshold stress
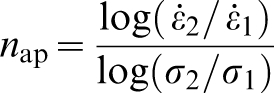
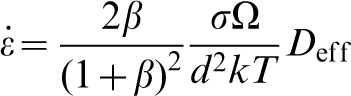
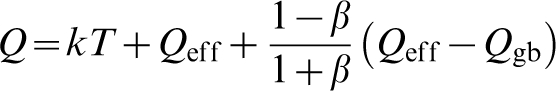
A different approach to explaining the superplastic behaviour of fine grained YSZP assumes that a single mechanism operates over the entire stress range, with there being a threshold stress σ
0. With this assumption, the flow process is GBS accommodated by diffusional processes. The discrepancies in the creep parameters outlined above disappear, and these parameters become n = 2, p = 2 and Q = 460 kJ mol−1 for any stress or temperature of the test (Fig. 4), and the creep equation can be written as
8,9,11,17–19

The existence of a threshold stress has been verified by deforming a Y-TZP at very low stresses (below the threshold stress). Extensive internal cavitation was found with a low strain percentage instead of the microstructural characteristics of superplasticity exhibited by these materials at intermediate and high stresses (i.e. no cavitation and a constant form factor). 15
Yoshida et al. 64 deformed monoclinic zirconia polycrystals (MZPs) and Y-TZP ones at 1373 K. They found different responses between the MZP and the Y-TZP: whereas in Y-TZPs the stress exponent increased from 3 to 4 when stress decreases, in MZPs the stress exponent is constant and equal to 2·5 over the wide stress ranged studied. They point out that this difference may be due to the existence of a threshold stress associated with the segregation of yttria at the grain boundaries. As there is no segregation in MZPs, no threshold stress should exist, in contrast with the facts reported in Y-TZPs. Later, the same authors 65 deformed MZPs in the range of temperatures between 1273 and 1373 K, and found the same stress exponent in all the experimental conditions studied. A constant value of the stress exponent of 1·7 has also been found by Roddy et al. 66 when they deformed MZPs at 1273 K. There was claimed to exist no threshold stress. These discrepant results merit further, more detailed, investigation to account for the controlling mechanism in MZP specimens.
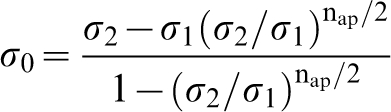
The threshold stress can be estimated easily from a linear plot of 


Strain rate versus strain in arbitrary units showing stress change used in determination of stress exponent and threshold stress
From the values found in the literature
8,9,11,17,61
and assuming the same behaviour in ceramics as in metals, we have plotted σ
0
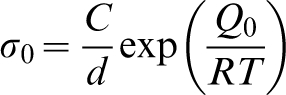
d versus 1/T in Fig. 10, allowing equation (10)) to be validated for ceramics. The constants C and Q
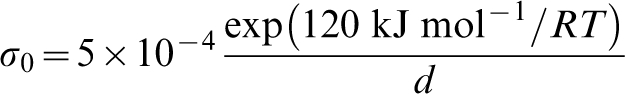
0 in equation (10) are estimated to be C = 3–5×10⁻⁴ MPa m and Q
0 = 120±30 kJ mol−1, and equation (10) will then be written as
9,11
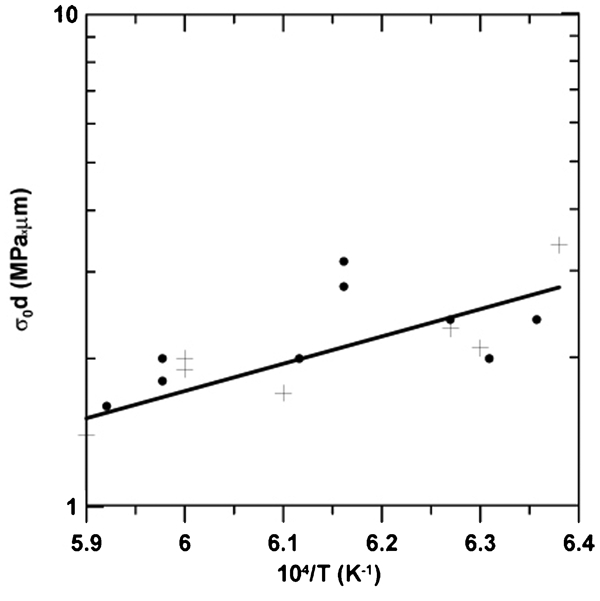
Grain size reduced threshold stress versus inverse of absolute temperature for different materials studied: for more details see Ref. 11
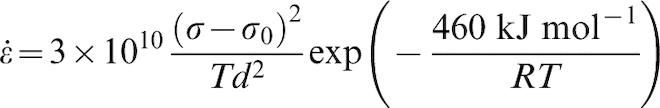
A plot of the strain rate versus the square of the effective stress (σ−σ 0) at a given temperature or grain size (Figs. 11 and 12) shows a linear dependence. If a similar analysis is made for the calculation of the activation energy, a constant value of this quantity is found irrespective of the applied stress.
Strain rate versus effective stress (applied stress minus threshold stress) for samples deformed at 1625 K (Fig. 3a ): one observes that relationship now is linear
With this approach, the constitutive equation, which is identical to that found in metals when lattice diffusion is the rate controlling mechanism,
8,9
can be written as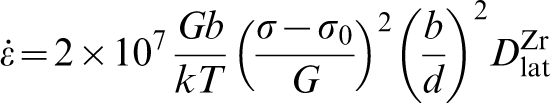
A threshold stress has been shown to account for a superplastic behaviour of Pb–63Sn and Zr–22Al alloys 116 which depends strongly on temperature and may result from the segregation of impurity atoms at boundaries and their interaction with boundary dislocations, although they do not show any dislocation activity. Dislocation activity has been demonstrated in a three-phase alumina–zirconia–mullite composite, 117 but its relationship with threshold stress is unclear.
In addition, dislocation activity has been reported in a high strain rate superplastic multiphase ceramic deformed at 1650°C and τ between 50 and 90 MPa. 118 Those authors do not, however, correlate this activity with a threshold stress. Altogether, therefore, while dislocations may be activated in ceramics under special conditions, they may not be correlated with threshold stress, at least in the zirconia system.
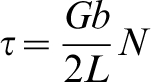
Taking into account that for polycrystals the applied stress is one-third of the shear stress acting on the pile-up plane, the ratio between the shear stress concentration (τ) and the applied stress σ (τ/σ) is in the range from 40 to 75, too high to be explained by the stress concentration induced at multiple grain junctions during GBS. Clearly then, the dislocations reported by Morita and Hiraga are likely to be an artefact rather than any intrinsic mechanism. Recently, Bernard-Granger et al. 119 reported that, although almost all grains appear depleted of any dislocation activity in the as received samples, the picture is different after deformation. First, the residual porosity has increased, and second, only some grains show evidence of dislocation activity as reported by Morita and Hiraga. 113 Bernard-Granger et al. suggest, however, that these two features may be related to the relaxation of internal stresses created during the densification process adopted for the preparation of the fully dense starting TZ3Y material, or during exposure to the creep temperatures, but by no means can they be responsible for the existence of the threshold stress as claimed by Morita et al.. 113–115
Also, as noted above, a sample of Y-TZP deformed by tension in the superplastic regime and cooled under load to avoid recovery of the dislocations, and another sample quenched to room temperature after deformation, have been found to show no evidence of dislocation activity. 16 This seems to argue against the likelihood of the mechanism proposed by Morita and Hiraga being operative in the present system.
Another weak point in this explanation of the origin of the threshold stress is that a dislocation pile-up can not account for the dependence of σ 0 on T and d. In particular, Morita et al. give a dependence on d (σ 0≈d −1) 115 which is in disagreement with the established dependence of pile-up stress on grain size (σ 0≈d −1/2). In sum, therefore, the explanation put forward by Morita and co-workers does not appear to be strong.
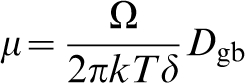
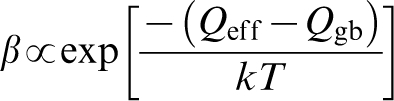
Recently, another model to account for σ 0 has been proposed based on the segregation of yttrium atoms at the grain boundaries which is able to explain quantitatively the dependence of σ 0 on both temperature and grain size. 61 It is now accepted that yttrium segregates at grain boundaries or at the dislocation cores in Y-TZP (see the section on ‘Nature of grain boundaries’). The origin of this segregation is the relaxation of the elastic energy around yttrium atoms as a consequence of the difference between the ionic radii of Y3+ and Zr4+, with Y3+ being ∼20% larger than Zr4+ as has been proven experimentally by different techniques such as X-ray photo-electron spectroscopy, Auger electron spectroscopy, and high resolution transmission electron microscopy. 20,120–124 In all cases the segregation layer ranges between 2 and 5 nm. It was shown recently that yttrium segregation depends on temperature, bulk concentration c b and grain size. 125 The space charge potential V due to the segregation has been measured by impedance spectroscopy as a function of the grain size in a 3 mol.-%Y-TZP, and was found to increase from 0·18 to 0·25 V as the grain size increased from a few tenths of nanometres to >1000 nm. 123 Quite recently, a new first principles based theoretical analysis has allowed the segregation profile of all chemical species to be determined as a function of both temperature and grain size. 126 Cation segregation to the grain boundaries changes the chemical composition as well as the space charge at the boundaries, creating a local electric field E, and consequently affecting such deformation mechanisms as GBS. This, in turn, may affect the mechanical behaviour of the zirconia alloys as has been shown in several recent papers 57,127 providing details of how segregation can influence the superplasticity of Y-TZP and explain the existence of the threshold stress. The same explanation has been put forward for a magnesium aluminate spinel in which the threshold stress is related to an electrical double (barrier) layer postulated to form to compensate the net charge at the interfaces of non-stoichiometric ceramics. 128
If one assumes that the interface region between two grains is very narrow and in electrostatic equilibrium, this electric field can be determined as a function of the yttrium bulk concentration, the thickness of the segregation layer (Debye length λ), and the reduction in energy per atom of dopant when one of them segregates to the grain boundaries (the absorption free energy ΔG). For details,
During deformation, one grain is displaced relative to its neighbour, and the work conducted during this displacement can be written as
57,127
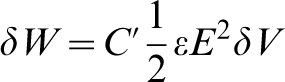
Since the work during the displacement is also equal to the net force F per unit area times δξ, and this force can be taken to be that which needs to be exerted for a grain boundary to start to slide, it can be considered to give the threshold stress (σ
0) which, by substituting the different expressions, can be written as
61
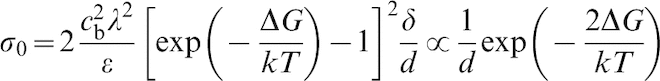
As one observes in equation (15), the impurity segregation at the grain boundaries not only provides an explanation for the existence of the threshold stress, but also gives the experimentally found grain size and temperature dependence (equation (11)).
Flow processes in coarse grain size YSZP
For coarse grain size specimens, the observed behaviour is different. Since the threshold stress is inversely proportional to the grain size, and becomes negligible for all coarse grain specimens, it can obviously have no significant influence on the mechanical response. The origin of the smooth dependence of the stress exponent on grain size must have a fundamental basis. There are two possible explanations.
One is that GBS obviously becomes ever more limited with increasing grain size, and higher stresses are required to obtain the same strain rates. These conditions favour diffusional creep over GBS. Consequently, the actual deformation mechanism is likely to be a superposition of GBS and diffusional creep, the latter becoming more important as the grain size increases. Since diffusional creep is characterised by a stress exponent n = 1, one would expect intermediate values between 1 and 2, as is indeed observed experimentally. A problem with this explanation is, however, that it entails some changes in grain shapes during deformation, and this is contrary to present observations.
The second possible explanation is as follows. It is well known that GBS is compatible with a stress exponent equal to 1 in systems other than the present one, especially in metals. The Ashby and Verrall (AV) model, 131 with strong assumptions concerning the grain boundary shape, predicts such a value for superplastic deformation. The conditions which lead to either of the two values n = 1 or 2 for the superplastic response are unknown. As indicated in the section on ‘Stress exponent versus grain size’, many examples show that n = 1 for coarse grained ceramics deformed by GBS. As also has been noted above, in the case of Y-TZP ceramics, the stress exponent decreases from values of 2 or greater to values close to 1 as the grain size increases, 28,29,35 while for grain sizes between 0·3 and 0·6 μm which probably correspond to the most extensively studied Y-TZP ceramics, the reported values of n are between 2 and 5. 8 Quite recently, Tekeli et al. 34 find stress exponent values of 1 in TiO2 doped 8 mol.-%Y2O3 stabilised ZrO2 under tension and compression. One induces from their micrograph illustrations that the grain sizes of their specimens are >1 μm. Several workers have found similar behaviour in Y-TZP specimens (for a list of the references, see the paper of Tekeli et al. 34 ).
These results show that a given mechanism may be characterised by different n values, suggesting that only the grain dynamics may be dependent on grain size. In the present work, there is strong support for this statement from the fact that p and Q show no dependency on grain size. Within the experimental uncertainty, the values p≈2 and Q≈500 kJ mol−1 are in full agreement with those given in the literature for lattice cationic diffusion as the accommodation mechanism in plasticity. 8,17 This is clear evidence that no change in mechanism is occurring in our set of samples: the accommodation mechanisms are the same, but the grain dynamics are modified by the larger grain sizes. Indeed, grain boundary profiles like the one described in the AV model may be more likely to occur when the grain sizes increase than when they decrease. Although it seems that the threshold stress can explain the discrepancies outlined above for submicrometre Y-TZP, there remains one problem that needs to be understood. This is related to decreases in the stress exponent from 2 to 1 when the grain size increases. Given the importance of the problem, in the following section we shall first describe the earlier AV model, and then present a generalised model of GBS with a focus on explaining why this generalised model is needed, and how it fits the experimental findings.
Grain boundary sliding mechanisms
It is now accepted that superplasticity in YSZP is governed by the switching of neighbouring grains (GBS), with the movement of point defects being the mechanism relaxing the stresses created during this switching because, as indicated in the previous section, in the deformed sample no dislocations are observed and the grains almost retain their original shape (form factor). For this reason, we shall not consider the model proposed by Ball and Hutchinson 132 or the unified approach to GBS for superplasticity 97 which describes the deformation as being due to intergranular dislocation glide accommodated by dislocation climb at GBs.
As mentioned above, an improved version of the original AV model was proposed 106 in which grain migration is taken to be controlled by the mobility of evenly spaced GB dislocations. The mobility of these dislocations is severely limited by the dragging effect of solutes present in the grain boundaries. However, as also noted above, although the predictions of the model are verified for many metallic alloys, it has to be discarded because in most non-metallic systems, including ceramics, dislocation activity would require very high applied stresses which are well above those determined experimentally.
The original AV model of GBS (Ashby and Verrall 131 ) considers a two-dimensional array of four identical hexagonal grains loaded under uniaxial tension. With this set-up, a full deformation equal to 0·55 is obtained, and it is implicit that long range grain correlation is maintained during deformation.
The keystone of the original AV model is that deformation proceeds sequentially in two steps: grain slide, and accommodation through matter transport along the bulk and grain boundaries. The first step (grain slide) is taken to be too fast, so that it is the second which is the process that determines the plasticity kinetics. There is a subtle hypothesis which is also assumed. This is that the two times are proportional: no matter the grain size or the local stress, the two-step mechanism takes place with the same kinetics in all sets of four grains. Mathematically, this means that there is a constant ratio between the mean sliding time and the mean diffusion time. Geometrically, it means that plasticity proceeds in similar way in all grains. Larger grain sizes are homothetic to the smaller ones. The dynamics of the motion of the grains is, however, uncorrelated at a long time scale, as has been observed experimentally. 108 The sliding time therefore does not depend on the diffusion time. This fact has important implications. It means that the ratio between the sliding and diffusion times does depend on grain size and/or stress level, especially mainly systems in which grain boundary mobility is limited by solute drag (impurities), by grain boundary pinning due to second phase particles (Zener drag), or by pores (pore drag).
The model’s basis is a topological mechanism for GBS followed by accommodation in the form of diffusion of atoms through the bulk or along grain boundaries. These two processes are always dominant at low stresses because the rates of diffusional flow are usually linear functions of stress, whereas those involving dislocation motion are nonlinear. The model assumes that all boundaries are flat, thus implying a constant microstructure with no grain growth.
During this flow, four irreversible processes take place:
a diffusive process in which grains temporarily change shape
grain or phase boundaries behave as sinks and sources for point defects
GBS
fluctuations in the boundary area.
By considering the entropy change in these four processes and taking lattice and grain boundary diffusion into account, one obtains the constitutive equation of the AV model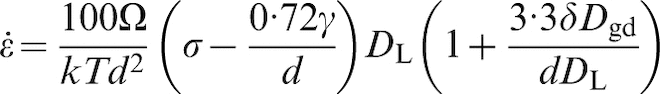
This model predicts a linear stress dependence of the strain rate n = 1, and a threshold stress for GBS which depends on the interface boundary energy. In the case of zirconia, where the value of γ is ∼0·15 J m−2, 133 the threshold stress for a grain size of 0·4 μm is ∼0·3 MPa, far below the measured values. 8,11,61
As a consequence, the strain rate should exhibit a sigmoidal stress dependence at low stresses, reflecting the presence of the threshold stress, as is indeed observed (Fig. 1). There are, however, certain inconsistencies with experiment:
The stress exponent can take no other value than n = 1, while it is well documented in the case of YSZP that the value in many cases is equal to 2.
The predicted threshold stress values are usually too small to be experimentally detectable. In particular, they are much lower than those that have sometimes been measured, and, contrary to experiment, they are independent of T.
Finally, for a given stress, the predicted strain rates are four orders of magnitude smaller than the measured ones.
Another inconsistency in the AV model that was pointed out by Spingarn and Nix 134 is that the AV model does not satisfy the basic physical requirement of the normal stresses on opposite sides of a grain boundary being identical. Those authors treat grains as elastically rigid, and their solution provides an explicit description of the equilibrium boundary traction distribution during steady state flow. This solution suggests that grain neighbour switching can occur in single phase materials only when grain boundary migration occurs. The AV model has also been criticised from a topological perspective. 135
The equation proposed in Ref. 134 differs from the AV equation in two aspects: one is that there is no threshold stress, and the other is that diffusion only exists along grain boundaries. Although the inconsistency of the AV model for the flow of point defects is resolved, this modified model 134 is unable to explain the experimental results at least for YSZP – the transition of the stress exponent from 2 to 1, and the accommodation processes by diffusion through the bulk. There have been several other proposed modifications of the original AV model by different workers, but the main features of the original AV model remain unchanged.
In sum therefore, there was still no real understanding of superplasticity in these systems. This gap in understanding motivated the development of the model that in the following section we shall present and discuss, and then apply to our ceramic systems.
Generalised GBS model
In the original AV model, GBS is responsible for the deformation, while the strain rate is controlled by the diffusion of point defects through lattice or grain boundaries. Although not stated explicitly, the only time scale taken into account is that of diffusion, and this is one of the differences in the new model which considers time scales of the two processes: GBS and point defect diffusion. This model has already been published, 136 so that in what follows we shall describe it in a simplified form and show how it can account for not only the occurrence of superplasticity in the absence of dislocation motion, but the following experimental facts as well:
deformation must proceed at constant microstructure and volume
the stress exponent is n = 1 in many polycrystalline systems, but it is also commonly found to be n = 2 in others. Furthermore, a transition from n = 1 to n = 2 is found upon increasing the flow stress or the grain size
the grain size exponent p ranges between 2 and 3 in most cases, although the value p = 1 is occasionally reported.
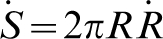
We consider a cylindrical polycrystalline specimen (Fig. 13) with average grain size d and dimensions S (cross-sectional area) and z (the height of the sample) subjected to a constant uniaxial compressive stress at a temperature high enough for the grains to be able to move relative to each other. The choice of this particular loading condition permits a simple mathematical treatment with no loss of generality. This approximation permits one to ignore the local effects due to the boundary conditions. This is consistent with the Saint-Venant’s principle according to which these effects would be negligible provided the sample is large enough. As was proposed by AV, the microstructure is then periodically altered and reconstructed through the switching of neighbouring grains in small clusters. The overall result is a heterogeneous deformation along the loading axis produced by the radial shear displacement of some grains in normal cross-sections. We finally assume that grain motion is uncorrelated at times that are long with respect to the time scale of a single event. This has been verified experimentally recently in Y-TZP. 108
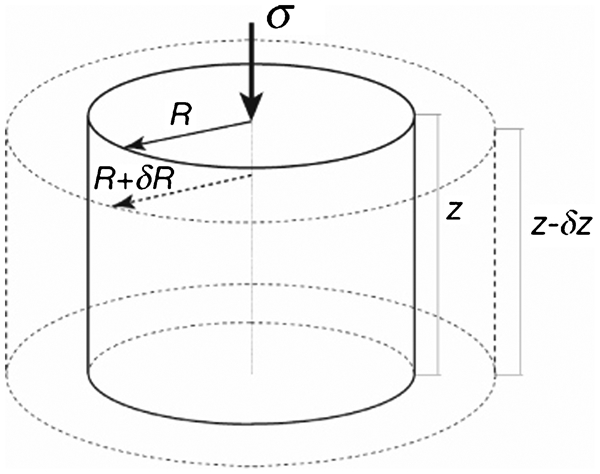
Schematic representation of macroscopic deformation in compression of cylindrical sample of radius R and height z: in normal cross-section, motion of grains is radial
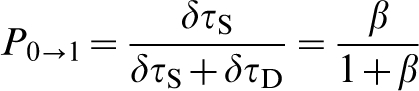
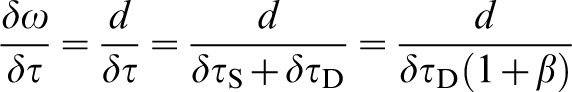
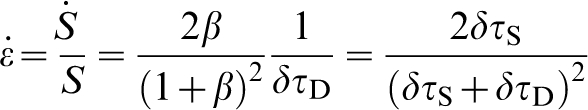
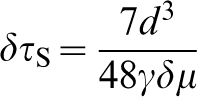
During GBS, any motion of the mass centre of a rigid grain consists of a combination of translation and rotation. The relative motion of two adjoining grains has two components: parallel (shear motion) and perpendicular to their common grain boundary. Grain boundary sliding is the component parallel to the grain boundary. Statistically, a mean flight time δτ S, can be associated with this pure shear motion. The contribution of GBS to the total strain is determined by the relative motion of neighbouring grains, 97,98 and, as in metals, it corresponds to between 70 and 80% of the superplasticity of fine grained ceramics. 99,100 The perpendicular motion is mostly governed by diffusional processes over a mean characteristic time δτ D and is responsible for the rate controlling mechanism. During accommodation, there is either no or negligible additional deformation. In what follows, we shall make use of the ratio of these two characteristic times, β = δτ S /δτ D. Shear displacement proceeds when there are open pores to provide enough room for grain glide. The pore distribution fits a lognormal form with a mean value equal to d. In consequence, the glide displacement of grains would follow a similar distribution with a mean value equal to the grain size.
Although the AV model only takes the time for diffusion into account, with increasing grain size the GBS obviously becomes ever more limited, and higher stresses are required to obtain the same strain rates. Consequently, the new model also takes into account the time associated with pure shear motion.
The condition of volume conservation during plastic deformation (Sz = const.) may be written as zdS+Sdz = 0. Under compression, the strain rate is given by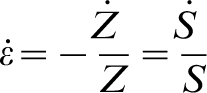
Superplasticity is controlled by shear events, and it has been shown
108
that the grain motion is uncorrelated during steady state deformation, with the grains moving stochastically in a Markov process (there is no correlation in time between the two processes).
137
Under such conditions, the net deformation is produced by pure shear events of a constant number of grains N. The number of grains moving by pure shear events per unit time 
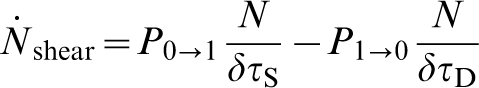

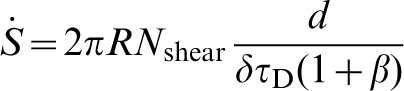
Evaluation of characteristic time δτD
The characteristic time for diffusion is straightforwardly obtained from diffusion theory. Taking a diffusion path of length approximately equal to d (because during sliding a void is open equal to the displacement of the grain, and this void needs to be closed by diffusion in order to keep the volume constant), and a driving force deriving from the gradient of chemical potential on the grains,
138
one obtains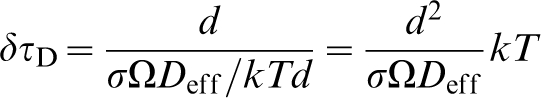
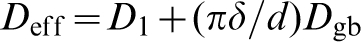
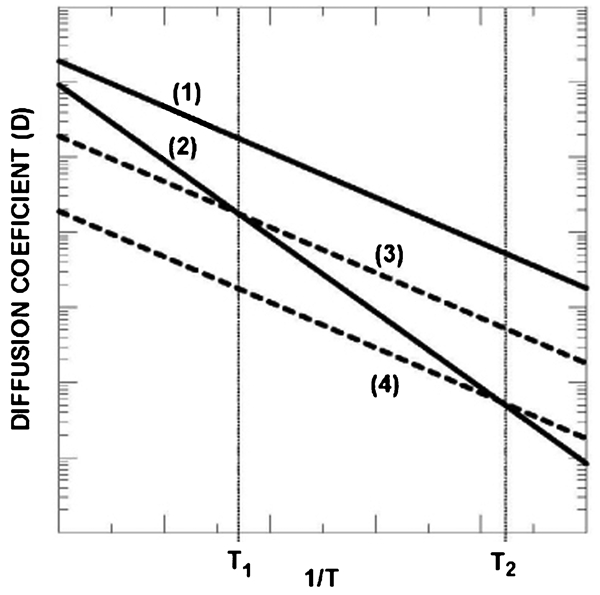
Schematic plots of the diffusion coefficients versus inverse temperature. The solid lines 1 and 2 correspond to a hypothetical grain boundary D gb, and lattice diffusion coefficients D l respectively. The dashed lines 3 and 4 correspond to the effective grain boundary coefficient (πδ/d)D gb for nanometric (30 nm) and micrometric (1 μm) grain sizes respectively. T 1 and T 2 correspond to the transition temperature for lattice to grain boundary diffusion for the two ranges of grain size
Evaluation of characteristic time δτS
To determine δτ S, one needs to know its dependence on temperature and stress. It also depends on the system under study through the mechanism governing grain boundary mobility during a shearing event.
In highly pure single phase materials, or in a system such as CeO2–ZrO2 in which grain boundary mobility is unlikely to be limited by solute drag, the motion of a curved grain boundary is governed by Hillert’s equation. 139 This equation corresponds to the motion being driven by the gradient of the surface energy, i.e. by the tendency to minimise the interface energy γ by flattening the grain boundary surface. 140 This is a further difference with the original AV model in which the GBs were taken to be flat, whereas in the new model they are curved as an effect of the applied stresses.
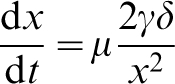
In a linear approximation, the velocity of a grain dx/dt, is proportional to its mean curvature x/2, where x is the normal distance from the grain boundary to the centre of curvature of the grain. One then has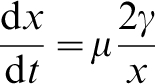
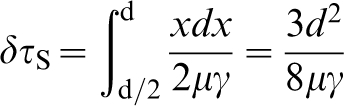
Shear displacement proceeds when there are open pores providing enough room for grain glide. The pore distribution fits a lognormal form with a mean value equal to d. This is the reason for the choice of d as the upper integration limit. In other systems, particularly in those in which grain boundary mobility is limited by solute drag (impurities), by grain boundary pinning due to second phase particles (Zener drag), or by pores (pore drag), grain boundary motion usually obeys the expression
137,138
Evaluation of constant β
Once the characteristic times have been calculated, one needs to evaluate the parameter β in the two cases analysed above in order to determine the strain rate (see equation (22)).
In pure single phase materials, from equations (23), (25) and (26) one has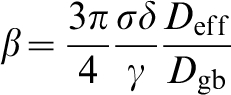
Evaluation of creep equation as function of β
We shall consider two situations:
the shearing step is much faster than the accommodation step (β≤1).
the two characteristic times are similar (β≈1).
In situation (i), the accommodation processes control the superplasticity, and equation (31) can be approximated by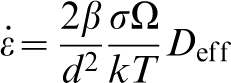
In the second case, the shearing is governed by solute drag (impurities), grain boundary pinning by second phase particles (Zener drag), or pores (pore drag). Then β is giving by equation (30), and substituting into equation (32), the creep equation becomes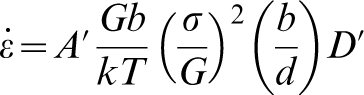
Under these conditions, grain growth may be expected, and will prevent there being any large scale superplastic regime. Indeed, this is what is observed in some ceramic systems in which extensive grain growth is associated with plastic flow, microstructural evolution and strain hardening. However, superplastic behaviour is observed in many other ceramic materials, with yttria tetragonal zirconia polycrystals being a notable example in which solute drag can retard grain growth to a point where superplasticity can reach a large scale before the onset of any appreciable grain growth.
In situation (ii), when the two characteristic times are similar and β≈1, equation (31) will become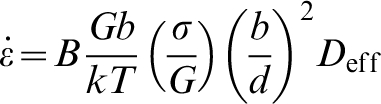
Creep parameters in this generalised model
In order to determine the stress exponent, we shall use the classical equation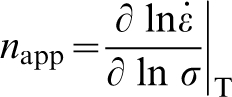
Similarly, and using equation (31), the activation energy defined as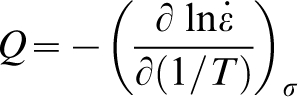
It is important to emphasise that these two dependences can not be explained in the framework of a dislocation based model. Such a model would predict there to be no temperature dependence of the activation energy. Moreover, it would predict a constant value of the stress exponent (n = 2) over the entire range of stress and temperature of the plastic regime, 132 or only for very small stresses if the modified version 106 were considered. Such predictions are just the opposite of those of the new model discussed here and of what is observed experimentally. In the following section, we shall show that the experimental observations can not be understood in the context of a dislocation driven model, but are consistent with the new model.
Experimental validation of model for yttria–zirconia system
The high temperature mechanical behaviour of the yttria–zirconia system is probably the most extensively studied as a function of yttria content, impurities, temperature, grain size, type of test (tension or compression) and oxygen partial pressure. 7–10 It is today widely accepted that GBS is the dominant process responsible for large deformations, and that the stress exponent is n = 2 in the superplastic regime, with the typical grain size of superplastic Y-TZP specimens being in the range 0·2–0·5 μm. However, Wakai et al. 29 reported that the stress exponent decreased from the value of 2 for fine grained (0·55 μm) to ∼1·2 for coarse grained (2·63 μm) ZrO2 polycrystal materials when deformed at 1450°C. The same trend has been described by Zapata-Solvas et al. 28 They measured the dependence of the stress exponent on grain size at a constant strain rate and a temperature of 1350°C, and found that it decreases from a value of 2 for fine grained (0·38 μm) to ∼1·5 for coarse grained (1·15 μm) ZrO2 polycrystal materials. In addition, there have been many studies reporting that when d increases to >1 μm, there is a tendency for n to decrease towards unity. 8
The stress exponents for 5 and 10 wt-%TiO2 doped 8Y-CSZ under compression have been calculated as being close to 1, and it has also been shown that the addition of dopants to 8Y-CSZ decreases the stress exponent. 34 However, the consideration of doped YSZ is beyond the scope of the present paper.
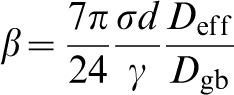
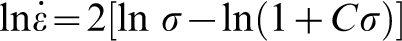
For a constant strain rate, the larger the grain size, the greater the flow stress according to equation (1), with p = 2 for n≤2. Thus, increasing the grain size implies increasing the value of β. In the case of Y-TZP, where the grain boundary mobility is limited by the Y segregation, β is given by equation (30). From this equation (30), β is proportional to stress and grain size. Hence, from equation (31) one finds after some algebraic manipulation that 
Plot of
Experimental validation of model for other systems
In order to check the model, another system was analysed. Several alumina ceramics exhibit the same behaviour as Y-TZP. The data, as presented in Fig. 5 of Ref. 136, are taken from the literature on alumina ceramics deformed at 1300°C. 43,45,144 The results are again in fairly good agreement with the predicted dependence.
As was noted in Ref. 136, in β-SiAlON the stress exponent has been found to decline from 2 for the lowest stresses (β≤1) to 1 for the highest (β≈1),
145
as predicted by equation (38). The authors of this last study
145
concluded that dislocations played no important role in the deformation of this material, in spite of the suggestion that the Artz–Ashby–Verrall model
106
may account for the observed transition in stress exponent values. The same behaviour has been found by Tokiyama et al.
146
for Al doped SiC polycrystals deformed at 1850°C, with there being a transition in the stress-exponent which increases from n≈1·4 to n≈2·6 as the stress decreases, and no evidence of dislocation activity. In the case of fully dense nanocrystalline MgO, although there are no data available on the value of n as a function of d, the observed value of n = 2 when the material is deformed at temperatures between 700 and 800°C
147
can be explained with the new model. To estimate the value of β, given the nanoscale of MgO, we relate the effective diffusion coefficient to the grain boundary diffusion coefficient by 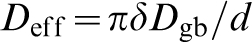
With respect to the activation energy, it is impossible to check the validity of the model in the case of the yttria–zirconia system because there is no reliable value of the activation energy along grain boundaries. Nevertheless, in the case of β-SiAlON, 145 the activation energy was found to depend on stress (as well as on temperature). Its value decreases from Q 1≈1200 kJmol−1 for the lowest stresses (β≤1) to Q 2≈900 kJ mol−1 for the highest (β≈1). Such a dependence is consistent with the prediction of equation (38). One would then have Q eff≈ 900 kJ mol−1 and Q gb≈600 kJ mol−1.
In Ref. 146, the flow stress values for which the stress exponent is n≈1·5 were also determined as a function of temperature. From equation (38), a value of n≈1·5 corresponds to β≈0·3, and one deduces from equation (29) or (30) that the temperature dependence of the flow stress σ
1·5 should obey an Arrhenius expression of the form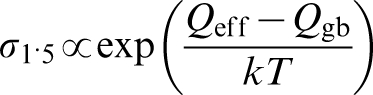
Conclusions
This review paper has given an overview of superplastic behaviour of pure yttria–zirconia system ceramics as a function of the grain size, stress, and temperature. It is proposed that, for all the range of experimental conditions, superplasticity is governed by grain boundary sliding accommodated by the diffusion of point defects without the concurrence of dislocation, and that there is a threshold stress σ 0, below which grain boundary sliding can not proceed.
A model was developed to explain the origin of this threshold stress based on yttrium segregation at the grain boundaries and the electrical nature of the grain interfaces. This segregation of yttrium plays an essential role in forming the electric field that is responsible for the electrostatic interaction of the grain boundary interfaces. Theoretical estimates are in reasonable agreement with experiment, and can explain the dependence of the threshold stress on grain size and temperature.
Finally, another model was proposed to explain the transition of the stress exponent from 2 to 1 as the grain size increases. This model is based on very simple physical ideas. A key element is the role of grain curvature as the driving force for grain sliding. Assuming that in a grain boundary between two grains with high misorientation angle, there is no discrete array of dislocations, we describe a mechanism of grain boundary sliding accommodated by diffusion which is able to explain the values of the stress exponent, in particular the value n = 2, and its possible dependence on stress and temperature. Several ceramic systems in which no dislocation activity can be detected were extensively discussed.
Footnotes
Acknowledgements
We are grateful to S. de Bernardi for help in preparing the figures. This work was supported financially by the Ministry of Education and Science (Government of Spain) through the projects MAT2009-14351-C02-01 and MAT2009-11078, and by the Junta de Andalucía (Spain) through the excellency project P05-0337-FQM.