
Abstract
The primary focus of this review concerns the test methods used to evaluate thermal spray coatings. Techniques to measure coating intrinsic properties such as (i) porosity and (ii) residual stress state; as well as extrinsic mechanical properties that include (iii) hardness, (iv) adhesion, (v) elastic modulus, (vi) fracture toughness, and (vi) the Poisson’s ratio of thermal spray coatings are presented. This review also encompasses the feedstock and thermal spray method since process variants create a specific microstructure. An important aspect of this work is to highlight the extrinsic nature of mechanical property measurements with regard to thermal spray coatings. Thermal spray coatings exhibit anisotropic behaviour and microstructural artefacts such as porosity and the splat structure of coatings influence the mechanical characterisation methods. The analysis of coating data variability evolving from the different measurement techniques is of particular relevance to interpret the character of thermal spray deposits. Many materials can be thermal sprayed but this review focuses on alumina and partially stabilised zirconia since (i) these materials have many proven applications, and (ii) there is a wealth of information that has been reported on these ceramics.
Introduction
The rapid solidification and stacking of molten metal or ceramic splats by multiple passes of the spray torch form the fundamental building blocks of a thermal spray coating. 1,2 The so-formed splat anatomy is the result of the spatial interaction of three inputs; i.e., the feedstock distribution and associated physical characteristics, the temperature–velocity field of the heat source, and the temperature–velocity fields of the particles. 3,4 In practical terms, the spreading of the molten particles during splat formation, 5 along with other important artefacts such as oxides and voids can be controlled by the feedstock and thermal spray processes employed. The term ‘voids’ is inclusive of cracks and porosity.
The thermal spray process selected by the operator dictates the flame jet temperature and particle velocity, which together are known as the TV relationships. 6,7 It is important to note that the modern (post year 2000) interpretation of TV relationships pertains to the properties of the in-flight particle, which includes information concerning the particle size distribution. 8,9 The flame jet temperature provides the operator with a reference point concerning the degree of melting of the sprayed material. Particle velocity refers to the value before impact with the substrate and is imparted by an inert carrier gas and the velocity field of the flame jet. The combination of feedstock material and size must be considered with regard to the thermal spray process; that is, different feedstocks present microstructural differences that reflect on physical property measurements. Therefore, a retrospective review of commercial feedstocks and thermal spray methods is relevant.
The coating architecture and associated microstructural properties are also examined; including the porosity and cracking behaviour, as well as its residual stress state. In addition, although thermal spray coatings have been produced for specific applications, certain mutual mechanical properties exist. These mechanical properties are often used to determine the structural integrity of the component. This review presents a focussed critique on measurement techniques that enables an improved understanding of performance–property relationships.
Thermal spray feedstock
Feedstock is a generic term that is applied to materials that are fed into a thermal spray device. Feedstock materials for a thermal spray device can be classified into three categories: (i) powders, (ii) rods and wires, and (iii) solutions and suspensions. The following discussion refers largely to powder feedstock, unless otherwise stated, since this is the prime product for the thermal spray market.
A key prerequisite for a feedstock is its transportation to the thermal spray device in a regular and consistent flow; and this is termed as the ‘flowability of the feedstock’. Powders are fed via polymer tubes with an internal diameter of ∼3 mm for distances of up to 5 m. Table 1 lists commercial powder feedstocks and the associated thermal spray method that is typically used. The particulate morphology will manifest itself in the coating architecture; therefore, an understanding of this feature is critical when interpreting material properties.
Compilation of commercially available powders sorted by application method
FS: flame spray; APS: atmospheric plasma spray; VPS: vacuum plasma spray; HVOF: high velocity oxygen fuel spray; CS: cold spray.
All particle sizes have been presented in absolute terms. ‘−90+45 μm’ indicates that the particle size lies between 45 and 90 μm. US mesh sizes have been presented where appropriate.
The principal characteristics of all feedstocks are linked to their manufacturing process. 10–14 In essence, the feedstock that is injected into the torch is transformed into a highly oriented coating structure with lamellae that lie approximately parallel to the substrate surface. This unique microstructure determines the properties of the thermal spray coating because the individual splats can be viewed as the fundamental building blocks of the coating. It is widely recognised that no thermal spray process or post-coating procedure can compensate for a poor quality feedstock; that is, the oxide content in coatings can never be lower than that of the sprayed feedstock. 15,16 It is vital that the feedstock be of high quality to obtain correspondingly high-quality coatings.
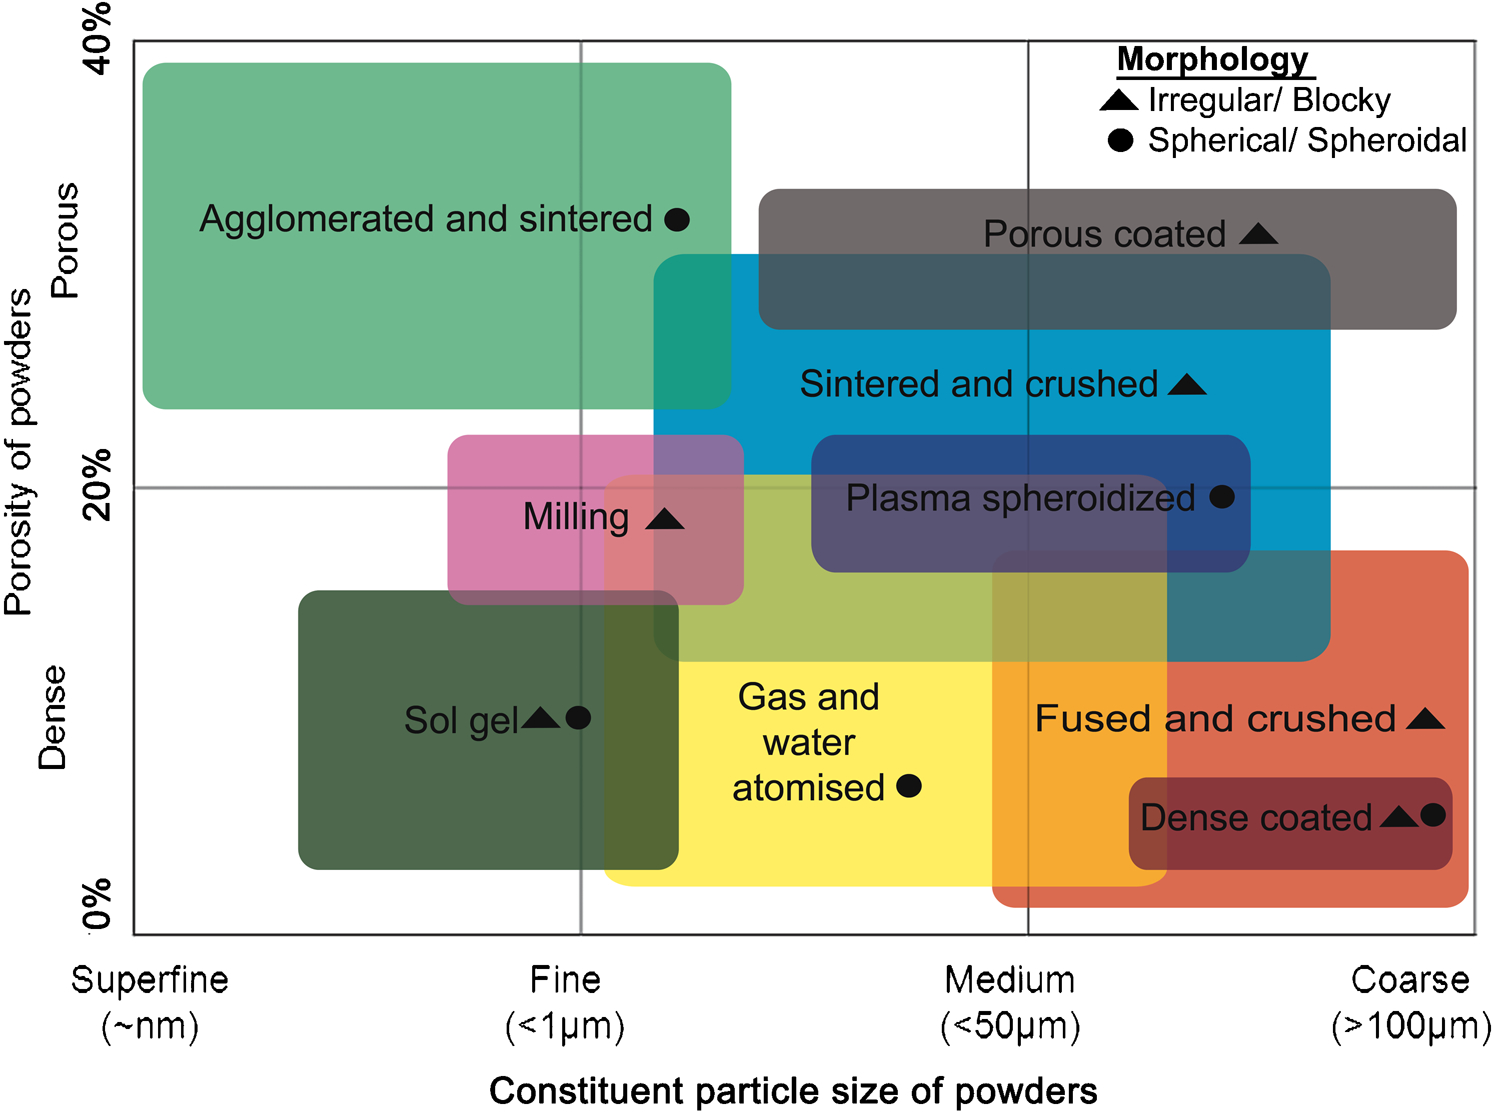
The important characteristics for thermal spray feedstock, other than the starting chemical composition, include the particle size distribution, bulk density, morphology, and grain size. 17 Similar materials with identical chemical composition, for instance alumina or tungsten carbide, can have distinctive characteristics that depend on the powder manufacturing process. Figure 1 presents a map that summarises the manufacturing routes and relates them to the porosity and grain fineness. In general terms, more dense particles are likely to form dense coatings that exhibit mechanical properties more akin to the bulk material.
Note: 50 μm is about mesh 270 and 100 μm is about mesh 140
The typical powder size ranges for feedstock used in thermal spray are from 15 to 45 μm [mesh−325 +15 μm] (termed as ‘a fine cut’) and 45 to 106 μm [mesh−140 +325] (termed as ‘a coarse cut’)*1. Other size permutations, such as a narrow cut from 5 to 22 μm [mesh−500 +5 μm], can be specified and it is generally accepted that a narrow powder size distribution will produce more homogenous coating properties. 18,19 In general terms, particle size ranges of 20–60 μm [mesh−230 +632] are preferred to form coatings of high integrity. However, the more recent sol gel technologies are also capable of forming fine grained, dense coatings that exhibit good mechanical properties. 20,21
In any spray torch setup, regardless of axial or radial particle injection, the average particle speed at the injector exit port is independent 22 of the particle size distribution for a given feed condition. In other words, for a specified carrier gas flow and injector port diameter, the friction and collision among particles results in similar injected particle velocities. However, the individual particle momentums would be diverse due to their different specific masses and, thus, the distribution of particle trajectories within the spray jet often exhibits a large spread. Consequently, the final impact velocities and temperatures imparted from the energetic spray jet to the feedstock particles will be affected and cause coating property variations. 23
Another variable that influences the particle impingement velocity and temperature is the particle morphology and porosity content. Feedstocks of different morphology but of similar chemical composition require an optimisation process to achieve a coating with comparable properties.
24
For instance, hollow spherical powders
25,26
(HOSP™)*2 exhibit excellent flow properties and their low mass allows consistent melting in the high temperature plasma spray jet.
27
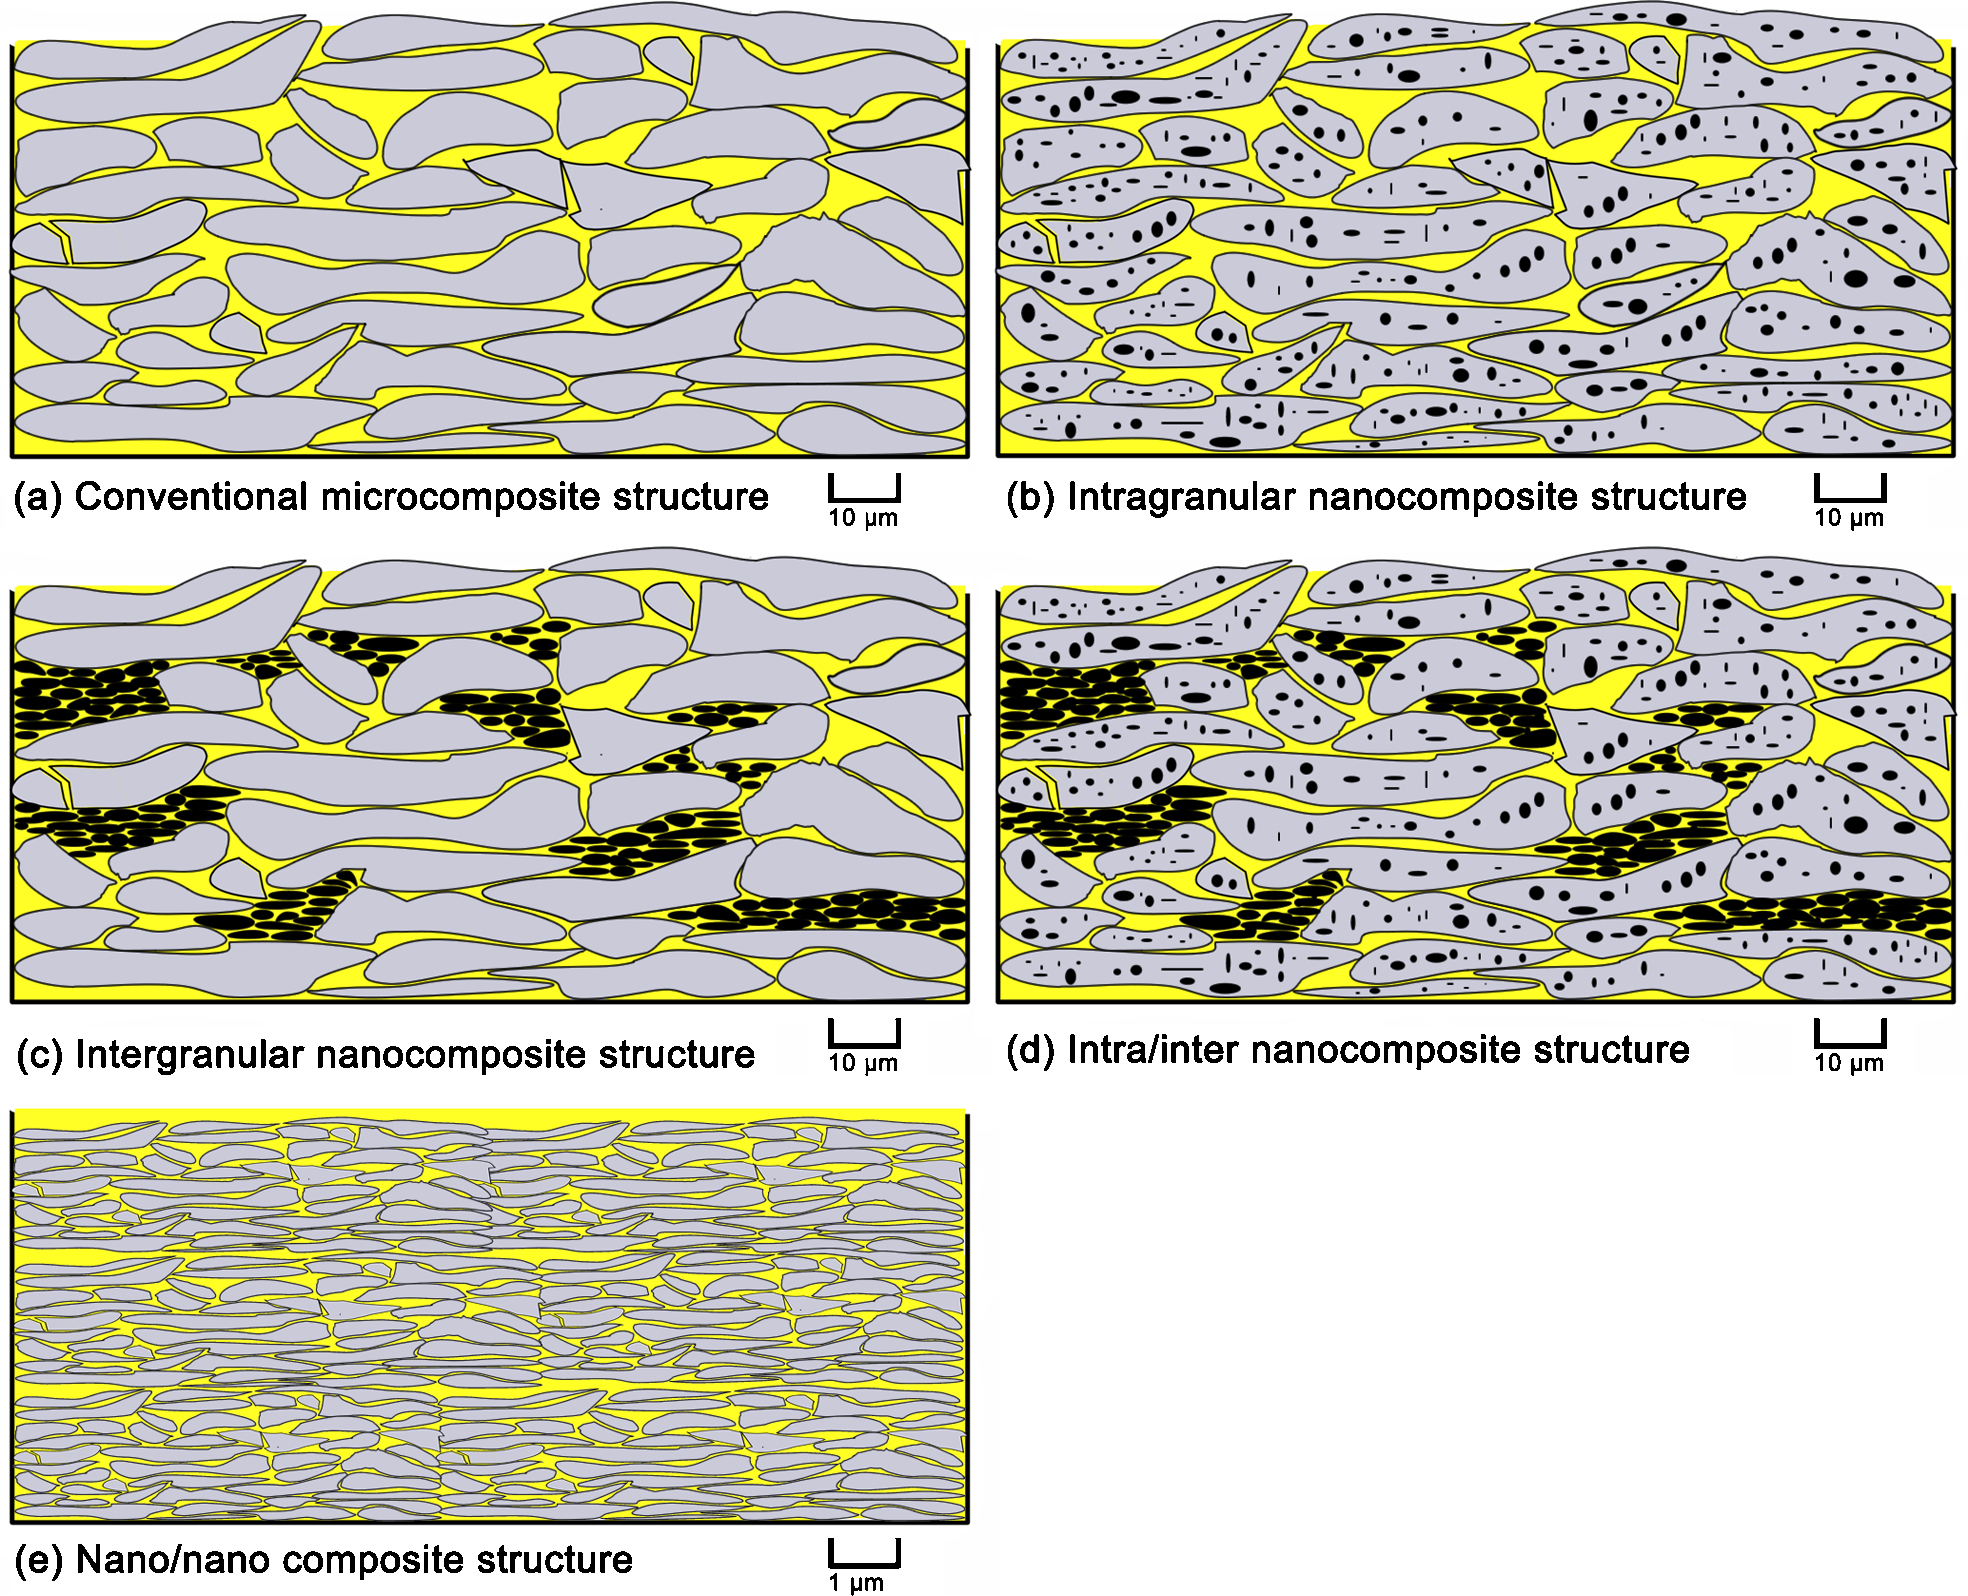
With reference to Fig. 1, it can be seen that feedstock porosity level varies with respect to the production methods. The intrinsic grain size of the powder particles and morphology can also be altered by the production method, which suggests different surface area to volume ratios (SA : V). Also, the morphologies of feedstocks can be described by the circularity shape factor, measured by two-dimensional image analysis (IA)
28
and defined as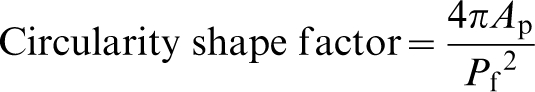
A classification of SA : V and circularity shape factor of powders manufactured via different production routes is shown in Fig. 2. It can be noted that for particles of similar size, spherical particles will exhibit the least SA:V compared to blocky feedstock. In addition, porous or agglomerated powders reveal a greater surface area compared to dense, spherical powders. This finding relates to the heat transfer and melting of powders during thermal spraying, which ultimately controls the coating mechanical properties. Materials with large SA : V (i.e. very porous or blocky in morphology) are heated more rapidly because the increase in surface area benefits heat transfer processes.
Classification of powder surface to volume ratio with respect to shape factor. The circularity shape factor varies from 0·16 for a granular and angulated feedstock to 1·00 for a spherical particle
There is also the potential for irregular pulsing during spray torch operation. Irregular powder flow can arise from either (i) insufficient carrier gas flow, or (ii) overloading of the feeding system with a too-high powder delivery rate. In both of these instances the irregular feeding is manifested by spasmodic powder flow that is technically known as ‘saltation’. 1 This observation is indicative of sequential powder clogging and discharging within the feed tube because of pressure fluctuations in the powder delivery equipment. This processing condition will be reflected in the formation of a heterogeneous microstructure with clumping of unmelts or porous features; all of which influence mechanical properties.
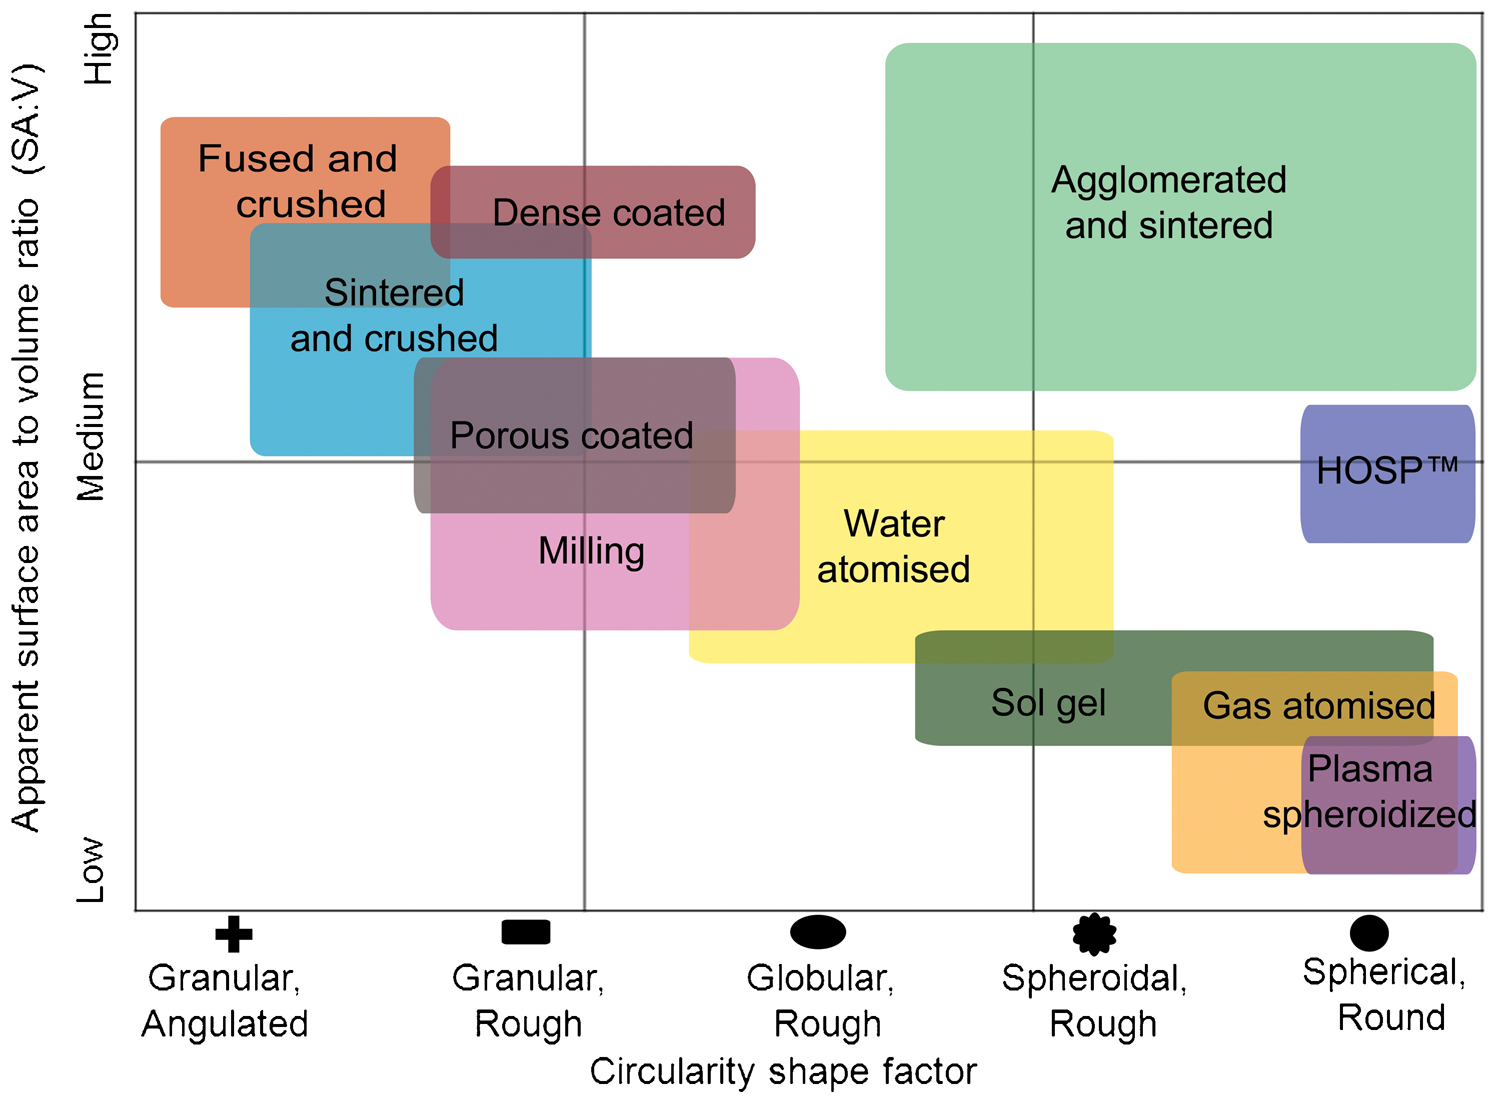
With regard to the powder grain sizes, there has been interest in the production of nanostructured coatings, similar to ceramic nano-composites proposed by Niihara, 29 in which nano-sized particles are either dispersed within the matrix grains or at the grain boundaries of the matrix (see Fig. 3). However, one constraint of thermal spraying is the formation of nanostructured coatings from nano-sized primary particles. First, conventional powder feeding techniques and equipment cannot deal with feedstock sizes below 10 μm. Second, strong agglomeration of the nano-scaled powder prevents good flowability. 30,31 Third, potential health hazards exist because the nano-particles may be distributed into the atmosphere and absorbed by human skin or into the respiratory system. 32,33
Classification of nanocomposite structures in thermal spray coatings. Note that the typical scale for a type (e) structure is more refined
The approach to overcome these issues is to pre-agglomerate the primary nano-particles into micrometre-sized feedstock. 34,35 However, it has been reported that agglomerated particles may either lose their nanostructure 36–38 or undergo undesirable chemical changes owing to melting and solidification. 39 With reference to the current work that focuses on mechanical properties; certain types of nano-composite coatings demonstrate significant advantages in terms of mechanical strength and fracture resistance when reducing the splat grain size. 40,41
Another approach taken to achieve nanostructured coatings is via sol-gel or suspension plasma spraying. 42–45 Much research has been undertaken by Fauchais and coworkers 12 to understand the challenges encountered in this novel process. The as-sprayed coatings of suspension plasma sprayed alumina, yttria stabilised zirconia (YSZ) and metal oxides have been reported 42–45 to surpass the performance of conventional plasma spray deposits.
Thermal spray processes
Thermal spray processes can be classified into three broad families: (i) the use of combustion heat sources; namely the flame, detonation gun and high velocity oxygen fuel spray (HVOF) processes; (ii) another uses electrical energy; either in the form of plasma or as an arc, and (iii) the third is a recent extension to the thermal spray family 46 and is known as cold spray, kinetic spray or hypersonic spray, which uses the energy that evolves from gas expansion. Figure 4 shows the relationship among the achievable particle velocity, particle temperature and the typical feedstock size. 13 This process map is different from the conventional TV map in three respects: (i) the temperature and velocity are represented in terms of the optimised particles rather than the effluent environment, (ii) there is an overlay for material class on the right hand side, and (iii) a logarithm scale for the feedstock particle size is used.
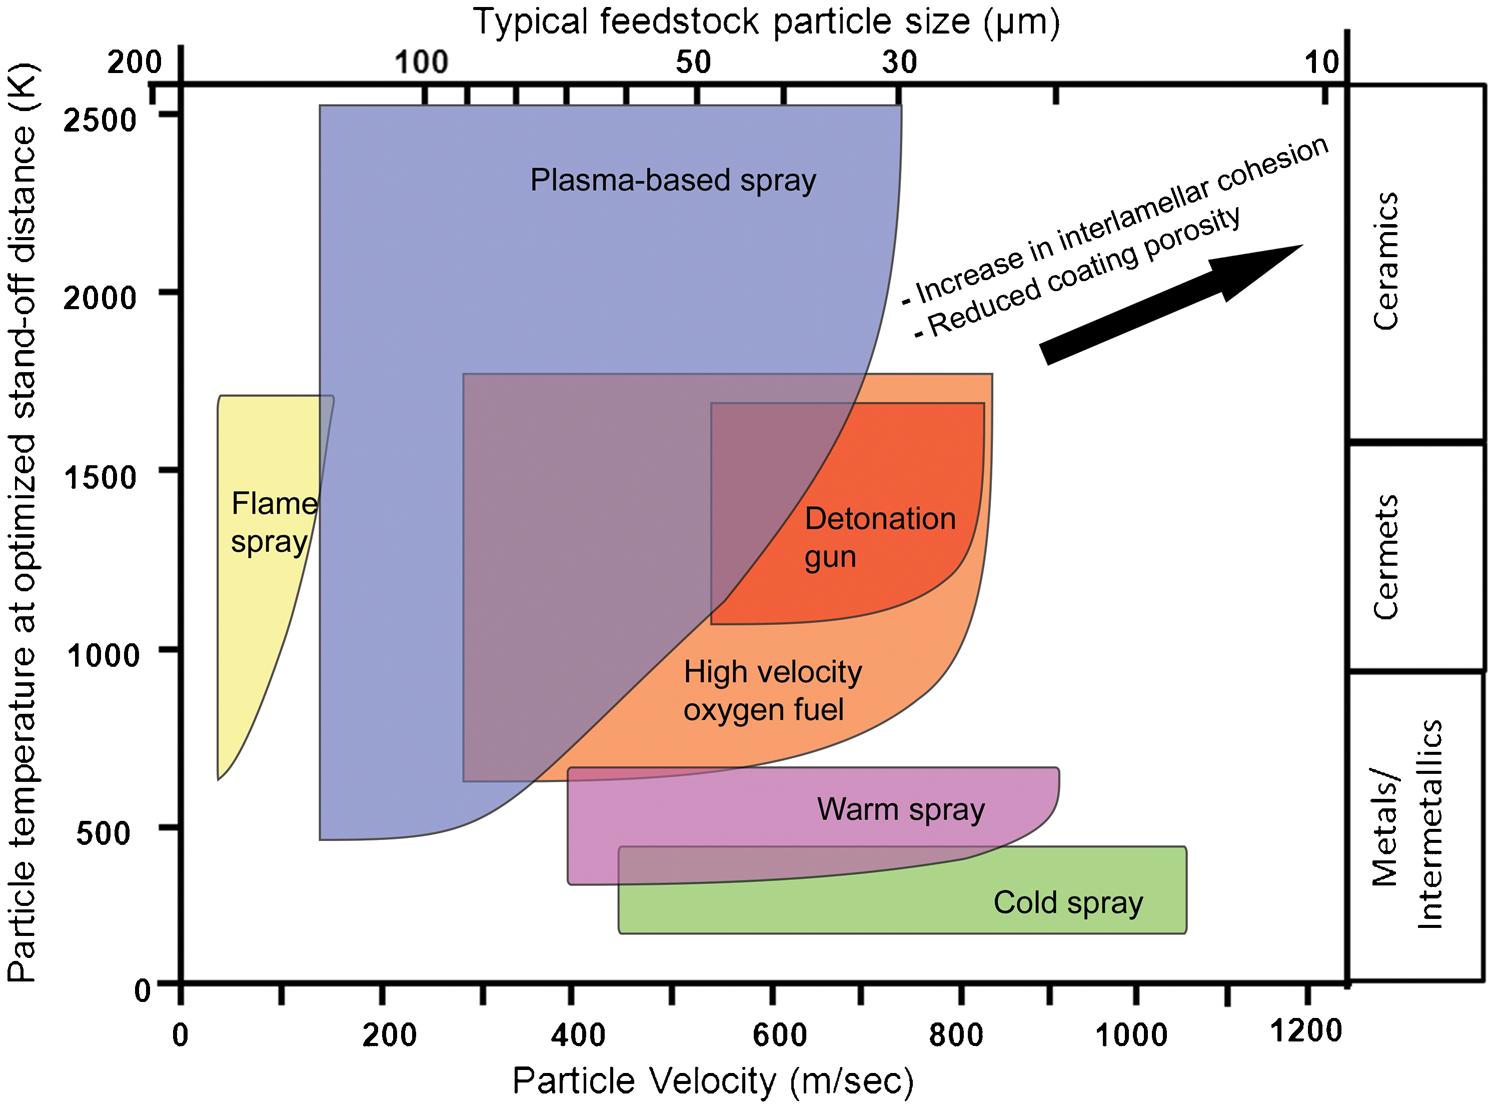
Classification of thermal spray processes in accordance with particle velocity, particle temperature and average feedstock size. The right hand scale indicates the range of materials that correspond, approximately, to each spray process
Fuel gas processes
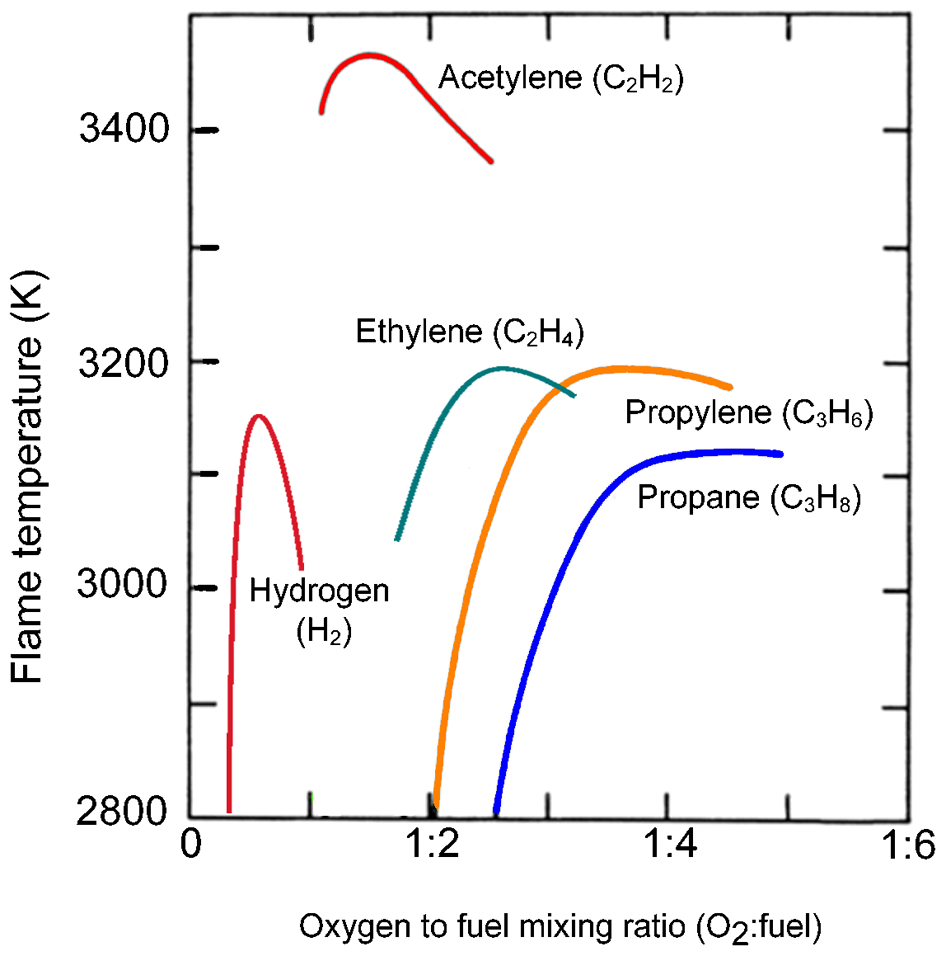
The flame spray (FS) process was first described by M.U. Schoop’s patent in 1912 47 and represented the rudimentary form of the combustion process; which now accounts for 30–45% of the worldwide thermal spray coating business. 48,49 In conventional FS torches, a stream of fuel and oxygen is combusted externally at the nozzle tip while powders are introduced axially into the flame via an inert carrier gas such as argon or nitrogen. The feedstock can also be in the form of wires or rods, in which a carrier gas is not needed. This process yields the lowest particle acceleration (>200 m s−1) because the fuel gases are supplied at low pressure and combustion occurs at atmospheric pressure outside the torch; that is: FS employs an open, non-confined flame. Flame jet temperatures in excess of 2900 K may be obtained depending on the type of fuel gas and the oxygen/fuel gas ratio, Table 2. 50 Propane provides the lowest flame temperature while acetylene will generate the highest temperature. Figure 5 shows the relationship of flame jet temperature with respect to the oxygen/fuel ratio of different fuel gases. 51
Common process gases used for the flame spray (FS) process
Properties of typical fuel gas for flame spraying arranged in the order of ascending flame temperature 50
The detonation gun, D-Gun®, process is a proprietary process developed by Union Carbide Inc. 52 in the 1950s. Coating services are now offered under Praxair Surface Technologies Inc., the company that evolved from Union Carbide Inc. Russian researchers have also developed a similar patented process. 53 The working principle of the torch is based on generating a high energy pressure wave through repeated ignition of an explosive mixture, usually acetylene and oxygen, within a long, constricted tube. The thermal output and detonation pressure waves, operating at 3–15 Hz, are intense and represent the TV source that heats and accelerates the powder particles towards the substrate. D-Gun® coatings have achieved dense coatings with high bond strength 54,55 and they have been compared to plasma spray coatings under conditions of abrasion and erosion wear resistance. 56 In general, D-Gun® coatings outperform plasma spray coatings in niche markets but they are not as versatile as other thermal spray coatings with regard to materials selection, equipment availability and engineering design of the component.
The high velocity oxygen fuel spray process, developed and marketed in the early 1980s by Browning and coworkers, uses high kinetic energy and controlled thermal output to produce dense, low porosity coatings. 57 Unlike the exclusive D-Gun® process, variants of HVOF systems are regularly being introduced by equipment manufacturers. The operating characteristics are based on a continuous combustion of the fuel gas mixture supplied at high volumetric flow to the burning chamber of the torch. Process gas selections include propylene, propane, hydrogen or natural gas used in gas-fuelled systems and kerosene in liquid-fuelled systems. 58
Table 3 shows the HVOF torches that use these fuels and their typical oxygen-to-fuel ratio for combustion. The torches in Table 3 have been ranked in accordance to their chronological development. The increase in combustion rate of the DJ series torches over the JetKote™ is evident while the use of liquid fuel, i.e., kerosene, provides increased particle acceleration. 59 Recent developments of HVOF spray systems have aimed predominantly at optimising the combustion, minimising fuel consumption, and increasing the particle acceleration.
Properties of typical high velocity oxygen fuel spray (HVOF) fuels and torch combinations*
Compiled from (i) equipment manufacturers published technical data and (ii) typical spray tables provided from feedstock suppliers.
The values for the liquid feed processes are high since the liquid flow rates are comparatively low.
Depending on the fuel gas used and torch design, the combustion jet temperatures reach 4000 K and the energies are in the order of 288–1000 MJ h−1 (80–278 kW). After passing the nozzle, the gas velocities are in excess of 1800 m s−1, resulting in the formation of a ‘shock’ diamond pattern within the exiting flame jet. The feedstock, in powdered form, is usually axially fed through the torch using an inert carrier gas such as nitrogen. The ignited gases surround and heat the powdered spray material as it exits the torch and particle velocities may reach 800 m s−1. 60,61 As a result of the high kinetic energy transferred to the particles through the HVOF process, the coating material generally does not need to be fully molten. 61,62 Instead, the powder particles can be in a semi molten state so that they flatten plastically on impact against the work piece.
High velocity oxygen fuel spray coatings often exhibit densities of >95% and adhesion values greater than 10000 lb in−2 (69 MPa). 1,63 High velocity oxygen fuel spray coatings demonstrate lower residual internal stresses 64,65 compared to air plasma spray coatings because the coating deposition temperatures are significantly lower; and hence reduce the tensile quenching stresses experienced by the splats as they cool and solidify. In addition, peening stresses are generated when particles impact at high velocity. These stresses induce compressive stresses that superimpose and reduce the prior-formed tensile quenching stresses. 66 Therefore, dense HVOF coatings of up to 2 mm can be deposited. 67,68 The feedstock undergoes a short flame residence time, measured in milliseconds, 69 that minimises excessive metal oxidation, decarburisation or phase changes. 70,71
Plasma processes
Energy sources for the thermal plasmas used in spray equipment are usually the DC electric arc or RF discharge that create arc energies of 72–720 MJ h−1 (20–200 kW). 1 Plasma temperatures in the heating region range from 6000 to 15 000 K; significantly above the melting point of any known material. 72,73 In the field of thermal spray, thermal plasmas are employed in atmospheric plasma spray (APS), vacuum plasma spray (VPS; and also called low pressure plasma spray, LPPS™), and controlled atmospheric plasma spray (CAPS) processes. Atmospheric plasma spray is extensively discussed in the following sections because it is a common coating method that can serve as a model for typical thermal spray processes.
The plasma jet flow influences the trajectories of feedstock owing to the relative amount of momentum imparted to the in-flight particles. 74–76 There is a large temperature drop of several thousand degrees centigrade over a few millimetres from the jet core to the boundary between the nozzle and the environment, and the velocity also decays rapidly as the jet exits from the nozzle. 72 Thus, depending on the design of the plasma torch, 77,78 there will be variations to the kinetic energy 76 imparted to the feedstock that influence the final coating microstructure. 79,80 In addition, the feeding position of the feedstock is usually in the radial direction. Axial injection, such as employed for the Mettech Axial III™ DC plasma torch, has claimed attributes in terms of improved heat transfer to the particles. 73,81
Another important point to discuss in DC plasma spraying concerns arc root fluctuations for stick type plasma torches. 82,83 These fluctuations arise because of (i) the movement induced by the drag force of the gas flowing in the cold boundary layer, and (ii) the magneto hydrodynamic forces that result from arc short circuits. The corresponding transient voltage can exhibit a restrike, take-over or mixed mode that leads to voltage fluctuations of ±35%. 84 The frequency of voltage fluctuations, ranging between 3 and 8 kHz, depends strongly on the condition of the torch anode and its operating parameters. 83 A peak frequency at around 4 kHz is usually observed 85,86 for stick type plasma torches. Such fluctuations influence the plasma jet velocity and, subsequently, the melting of feedstock for coating formation. 83,87,88
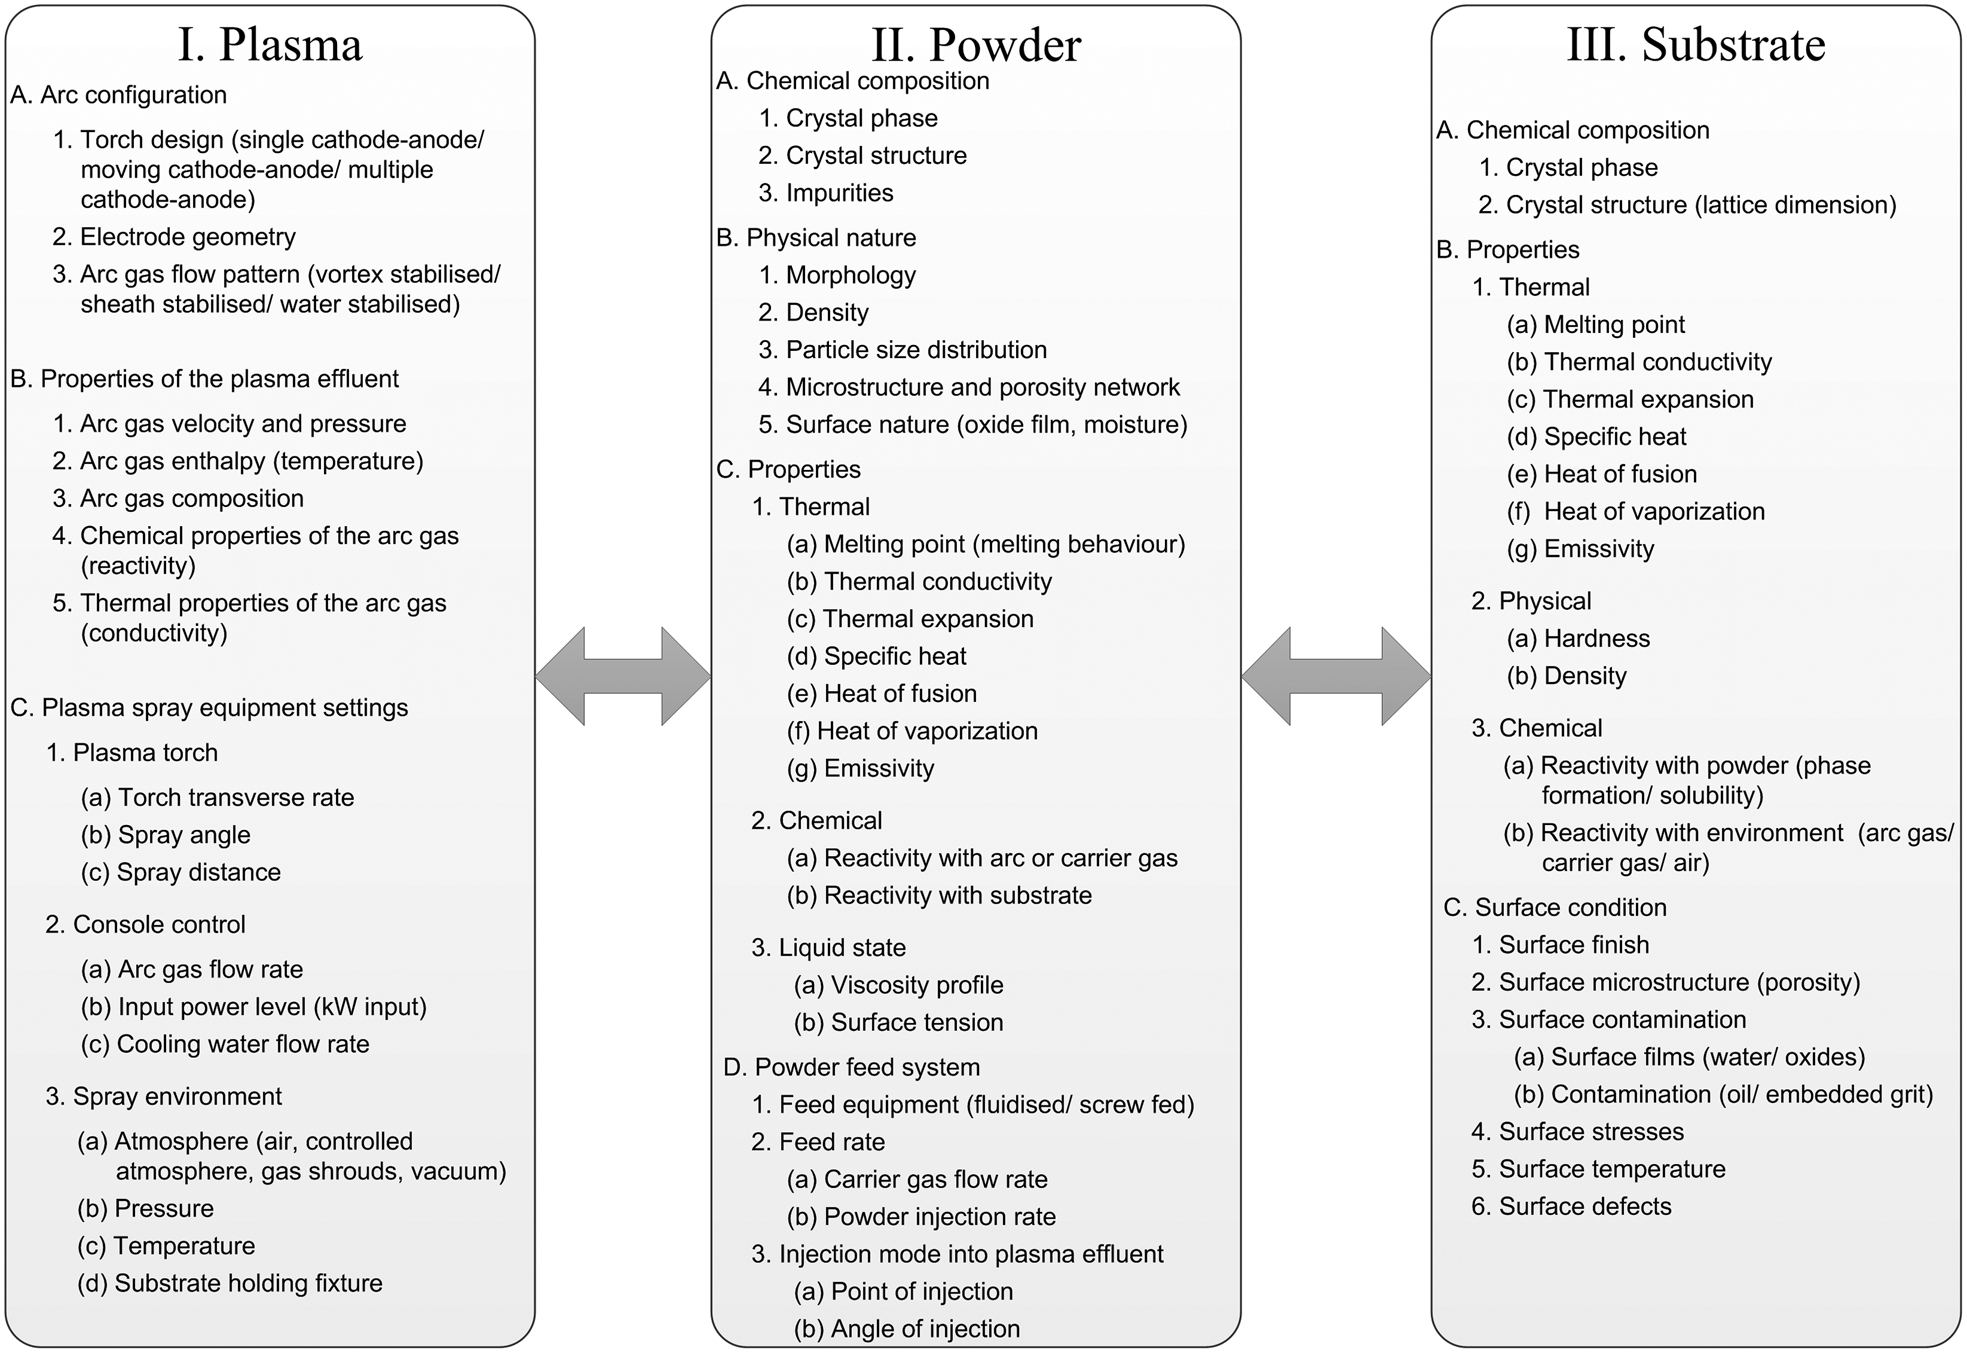
The feedstock particle temperature and velocity during plasma spraying is also sensitive to torch parameters such as input power, arc gas flow, carrier gas, spray distance and type of plasma arc gases used. A summary of plasma spray process parameters has been compiled by Gerdeman and Hecht; 89 which are depicted in Fig. 6. Many parameter settings have been studied extensively 90–92 and, for instance, Mash et al. 90 have schematically illustrated the effects of some process variables on the coating deposition efficiency in Fig. 7.
Adapted from Ref. 89
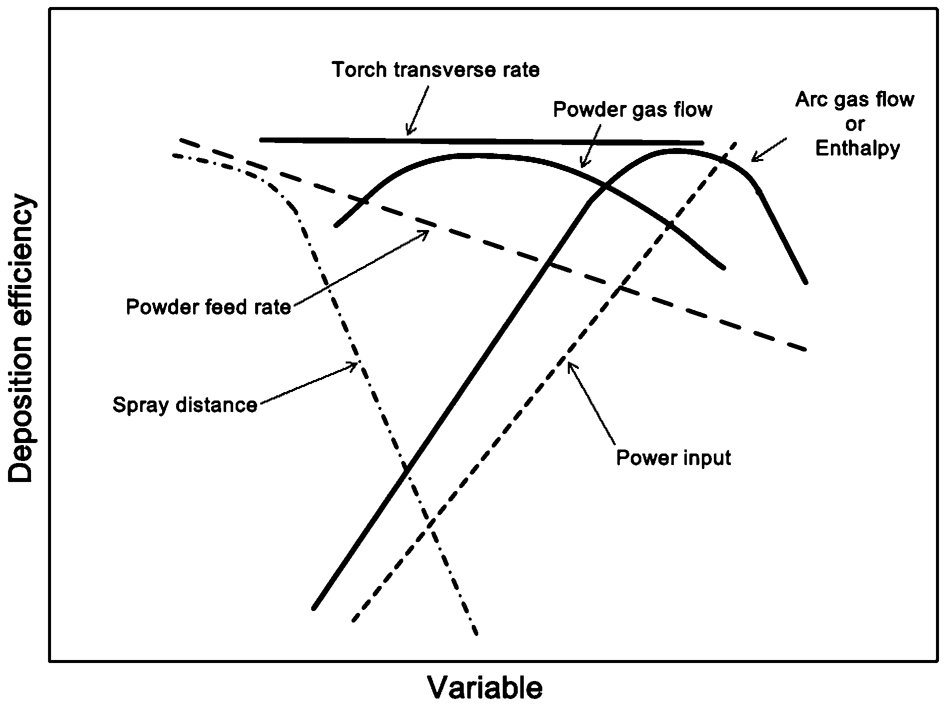
The figure has been redrawn from the original paper 90
Wire arc spray process
The twin wire arc (TWA) spray process originated from a patent of M.U. Schoop in 1910. 93 It is a reliable, economical and commonly used method for depositing metal coatings for, mainly, corrosion protection applications. The principal technical details are simple: a direct current electric arc is formed between two consumable electrode wires and a high velocity gas jet propels the molten material towards the substrate. The temperature within the arc jet (∼7000 K) is sufficient to melt the consumable electrodes, which are atomised into particles, accelerated and deposited onto the substrate. Thus, the thermal efficiency of the wire arc spray is greater than other thermal spray processes because the particles are in a fully molten state when they enter the spray jet. Deposition efficiencies of up to 99·5% have been reported but typical spray efficiencies lie in the range of 58%*3 due to practical application limitations. 94
The molten particles start cooling immediately after leaving the arc zone. Therefore, coating properties such as porosity and adhesion can be affected. Developments of this process, such as high velocity nozzle caps, have opened up new applications with particle velocities similar to those experienced for HVOF processes. Wire arc spraying is not limited to metal wires; for instance, cored wires consist of powdered materials such as carbides or amorphous alloys that are contained within a nickel or iron-based metal sheath.
Cold spray process
The cold spray process of thermal spray was discovered during the mid-1980s. 95 It was established that when a particle-laden supersonic gas jet impinged onto a solid surface, above a particular minimum particle velocity, then the abrasion caused by the metal particles transitioned to adhesion of the particles. 96 The relatively small and unmelted particles, ranging in size from approximately 1–50 μm in diameter, deformed and subsequently a coating deposited onto an appropriate substrate. The phenomenon of ‘cold spray’ was coined. It was further found that the coating effect was enhanced by an increase in gas temperature. 46,97
The most distinguishing feature of the cold spray process is an ability to produce coatings with preheated gas temperatures in the range of 0–800°C, a range that is lower than the melting temperature of the feedstock. 98 Consequently, the deleterious effects of high temperature oxidation, decarburisation, melting, residual stress, de-bonding, gas release, and other concerns associated with high temperature thermal spray processes are reduced. 1,46,99 The size distribution of the powder is also important and powder cuts between 10 and 40 μm are favoured to obtain dense cold spray coatings. 100
The mechanism by which the solid state particles deform and bond, both to the substrate and to each other, is not well understood. However, modelling 101 of cold spray processes shows a change in almost all key parameters near the particle interface with the beginning of unstable adiabatic shear at the interface. The shear instability is characteristically associated with high strain rate deformation. Experimental, theoretical, and computational investigations have also documented the formation of ‘surface scrubbing’ jets; that is, high interfacial pressures that disrupt the oxide films on the particle and substrate surfaces. The atomic structures of the impacting materials are placed into intimate contact, there are large extents of plastic deformation in the interfacial region, and temperatures are increased during impact. 102,103 Most recent studies have recommended that the adhesive bonding to a dissimilar metal substrate arose from the mechanical interlocking of the deformed particles onto the substrate and discrete local atomic bonding. 104
Anisotropic nature of thermal spray coating architecture
The fundamental feature of any thermal spray coating is its lamellar microstructure formed by the rapid solidification of impinging molten droplets and cohesion among splats. Formation of this lamellar microstructure is a stochastic process and is associated with confounded processing variables such as the feedstock size, feedstock material, flame jet temperature, and particle velocity. The flattening ratio may be derived from the splat dimensions and depend on the spray method; as compiled in previous work. 5 An illustration of a typical ceramic thermal spray microstructure is depicted in Fig. 8. As a result of the cumulative interactions of variables within the spray stream, discriminating features such as splat dimensions, pore sizes, crack density, inter-splat coalescence, and associated artefacts can be determined.
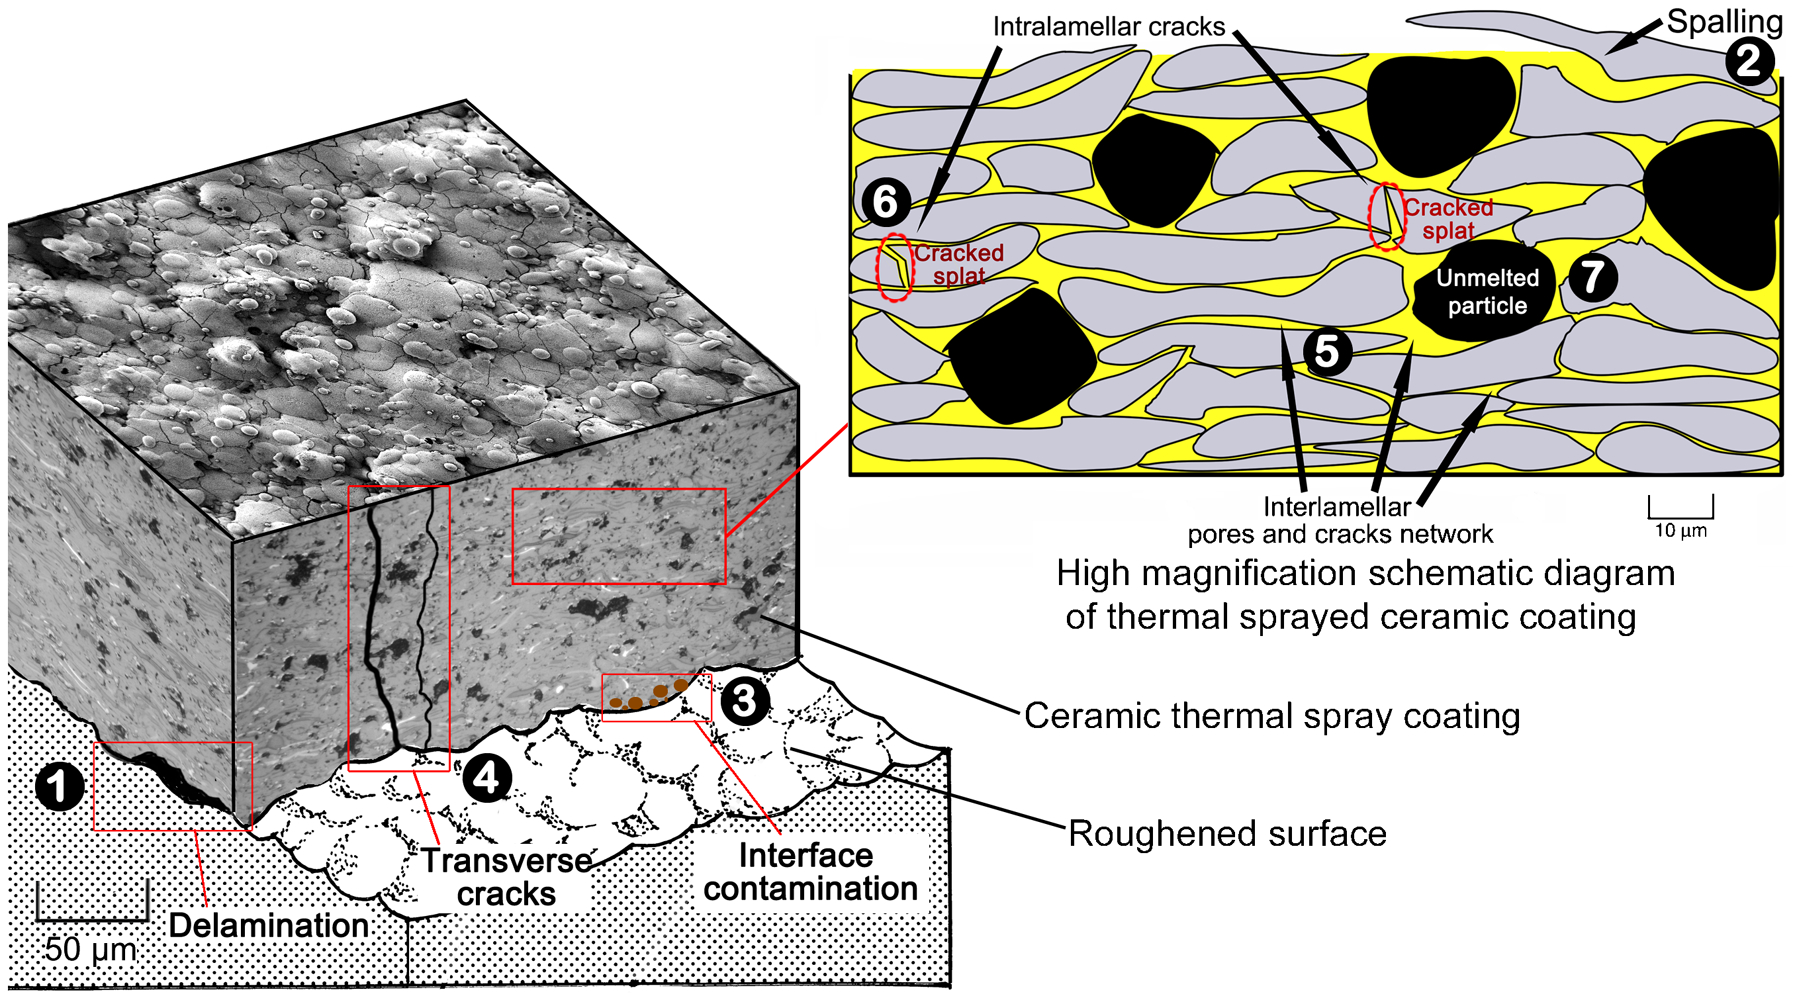
The numbered features are keyed to Table 4. Feature 8 is not indicated since this is an artefact arising from the metallographic preparation technique
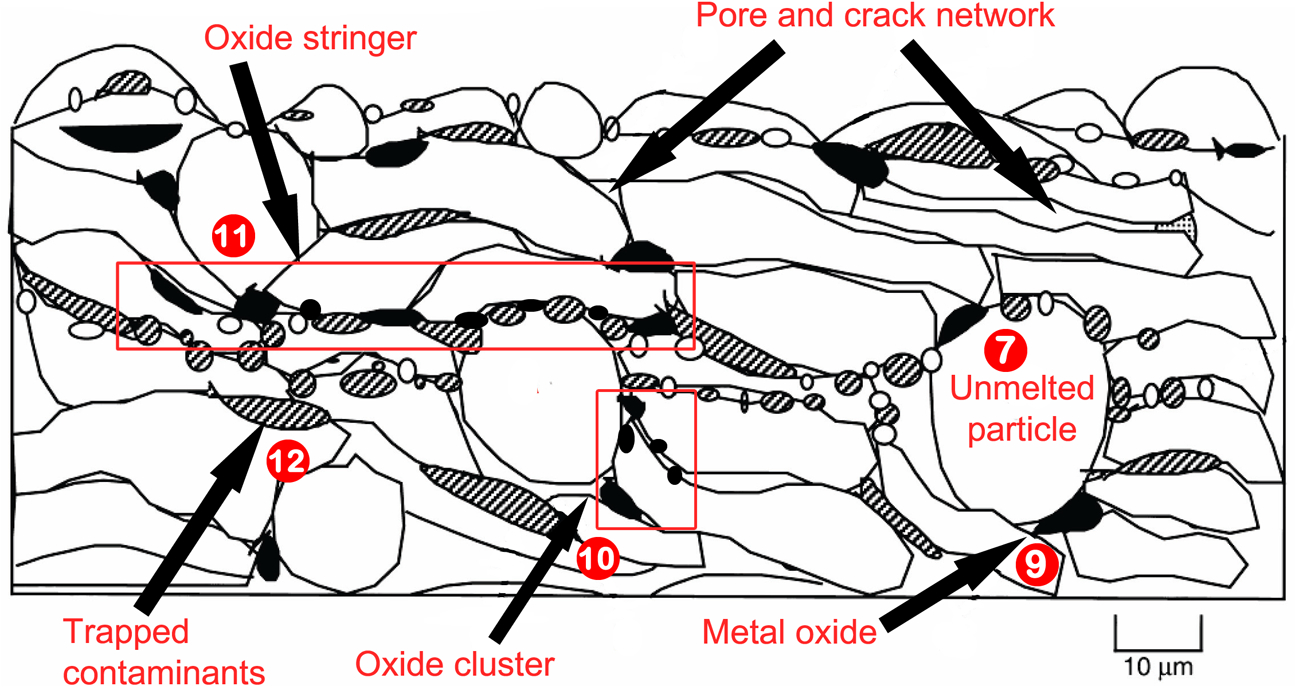
A schematic for a metal-based thermal spray coating is presented in Fig. 9. 1 The key difference is that spraying metal particles under a normal atmosphere is likely to create oxides during the time of flight or during spreading and solidification. Metal oxides will be trapped within the coating and influence the mechanical properties and other performance characteristics of the coating.
The terminology of thermal spray microstructural elements can be found in Table 4. The lamellar splat structure also gives rise to the highly anisotropic mechanical properties of thermal spray coatings. Thus, the coating material properties depend on the direction measured as opposed to an isotopic bulk material. The anisotropic nature of a thermal spray microstructure has been specifically defined as transversely isotropic because the architecture has two orthogonal planes of symmetry: i.e., (i) a microstructural texture that follows the spray direction, and (ii) a cross-section orientation, perpendicular to the spray direction (Fig. 8) that reflects the cross-sections of splats.
Microstructural characteristics of a thermal spray coating
Defects that occur only in metal-based thermal spray coatings.
In addition, there is an overall reduction of mechanical properties due to the pore and crack network, which together are termed as the void network, within a thermal spray deposit. 105 The void microstructure formed in a thermal spray coating is dominated by two morphologies: inter-lamellar pores and intra-lamellar cracks.
The formation of the dominant void system varies with the spray technique and material. Ilavsky and coworkers 106 showed that alumina deposits, manufactured by a high-power water-stabilised plasma spray system, consisted of a microstructure dominated by intra-lamellar cracks. The same material deposited by a standard lower-power, gas-stabilised, plasma spray system exhibited equal surface areas for the intra-lamellar cracks and inter-lamellar pores. However, in the case of zirconia, the microstructure was always dominated by inter-lamellar pores.
The influence of the dominant void system also affected the elastic and fracture behaviour of a thermal spray coating. 107 This was due to the fact that intra-lamellar cracks, which were perpendicular or normal to the substrate, reduced the coating mechanical properties in that direction. Inter-lamellar pores were manifested in a scattered orientation and their effect imparted a condition that can be described as ‘inverse anisotropy’ on the coating mechanical strength. 108 That is, the strength in the direction normal to the substrate was improved.
The third distinctive feature of a thermal spray coating lies within the two similar orthogonal planes or cross-section views of the coating as shown in Fig. 10. The ‘XZ’ and ‘YZ’ planes representing a cross-sectioned coating are essentially similar. Both planes exhibit a lamellar microstructure due to the flattening of splats as represented by the splats being elliptical-shaped (see Fig. 10). The microstructural characteristics of these planes will be controlled by the spray protocol; primarily the spray beam diameter and the degree of overlap during the coating manufacture. The microstructure would be expected to exhibit differences of material properties when measured across axes in the (i) z direction, or (ii) the x and y directions. This cross-sectioned anisotropic behaviour has been highlighted by Ostojic and McPherson 109 when carrying out fracture toughness tests along the different cross-sectional axes. Therefore, the anisotropic mechanical behaviour of coatings produced via different thermal spray methods is related to a distinctive splat structure and their associated void systems.
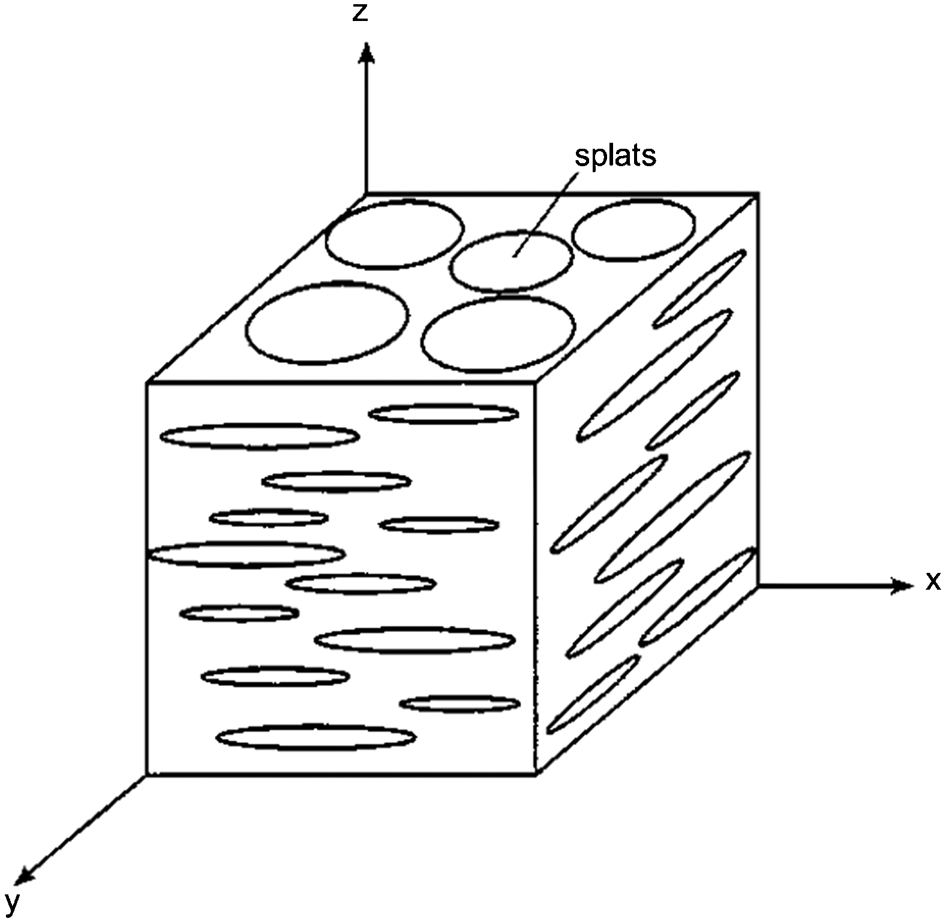
Schematic representation of splat microstructure with respect to the principal axes
In many practical cases of thermal spraying ceramics, the incorporation of a bond coat is required and this increases the complexity of the manufacturing process. The coating system of the substrate, bond coat and ceramic overlay may be treated as a three-dimensional, interlaced, tile structure that is composite-like in character. This complex material system alters the deformation mechanism, which reflects on the mechanical property value. A metal-based bond coat is applied before the deposition of a ceramic top layer for several reasons: (i) to reduce thermal mismatch between the substrate and ceramic coating; especially for high temperature applications, (ii) to provide a surface architecture that enables keying in of the ceramic overlay, and (iii) to protect the substrate from environmental effects such as high temperature corrosion.
The success of the two-layered thermal barrier coatings (TBCs) found in modern gas turbine engines can be attributed to the use of a nickel-based (NiCrAlY) bond coat. 110,111 NiCrAlY bond coats have been extensively used in TBCs for two reasons; first to help accommodate differences in coefficient of thermal expansion (CTE) between ceramic topcoats and metal substrates. This compliant layer partially accommodates thermal stresses in the TBCs during the cyclic thermal operating conditions. The second reason for using bond coats was to seal the underlying substrate from corrosive mediums; especially since the ceramic YSZ top coat was porous. Strong bonding between the oxide ceramic and metal substrate was achieved even after being subjected to a high temperature oxidation environment. Bond coat thicknesses for most cases should be between 150 and 200 μm. Other selections of bond coats are indicated in Fig. 11. 112
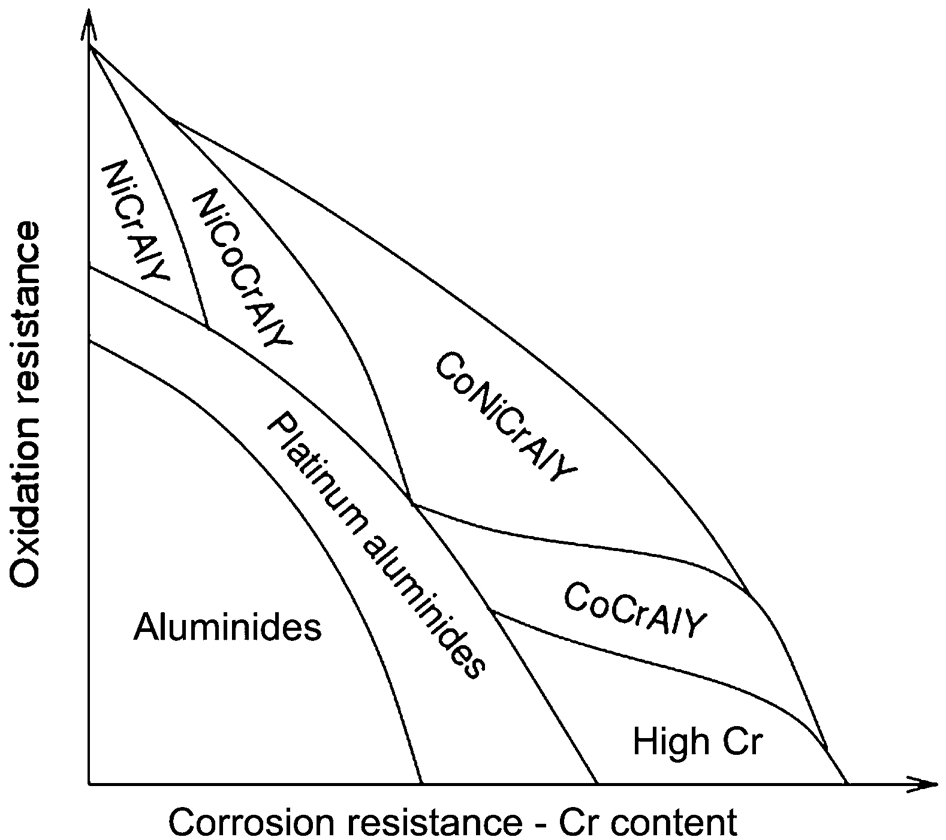
Reproduced from Ref. 112
Other unique coating architectures are formed in nanostructured thermal spray coatings or in bimodal-structured thermal spray coatings. 40,113 The intention of such coating architectures was to modify the anisotropic behaviour of the coating by introducing micro- and nano-structures that act as crack arresters; thereby enhancing the as-sprayed coating toughness. 40
Residual stresses of thermal spray coatings
Apart from the complex porosity and crack networks, the thermal spray process also generates residual stresses. These were initially referred to as ‘internal stresses’ in coatings by Fisher, 114 Ballard 115 and Marynowski. 116 The generation of ‘transient and residual stress’ suggested by Tucker 54 was used to describe the generation of coating stress states. The term ‘residual stress’ was used in the 1990s 117,118 to refer to the collective summation of stresses imposed onto the surface during the different stages of thermal spraying. The compressive or tensile residual stresses will influence the mechanical properties of thermal spray coatings. 54,118
The review on the origins of residual stress by Clyne et al. 118 proposed two main contributors to residual stresses: (i) quenching stresses, and (ii) differential thermal contraction stresses. The quenching or intrinsic stresses arise due to the hindered shrinkage of individual molten splats as they undergo rapid solidification; 117 refer to Fig. 12. Therefore, quenching stresses relate to micro stresses since they arise at the splat level. 119 The existence of quenching stresses has been suggested by McPherson 3 and measurements of these stresses were executed by Kuroda et al. 120 The quenching stresses were found to be always tensile in splats; 119 however, the values in many cases are less than 100 MPa 117 due to stress relaxation.
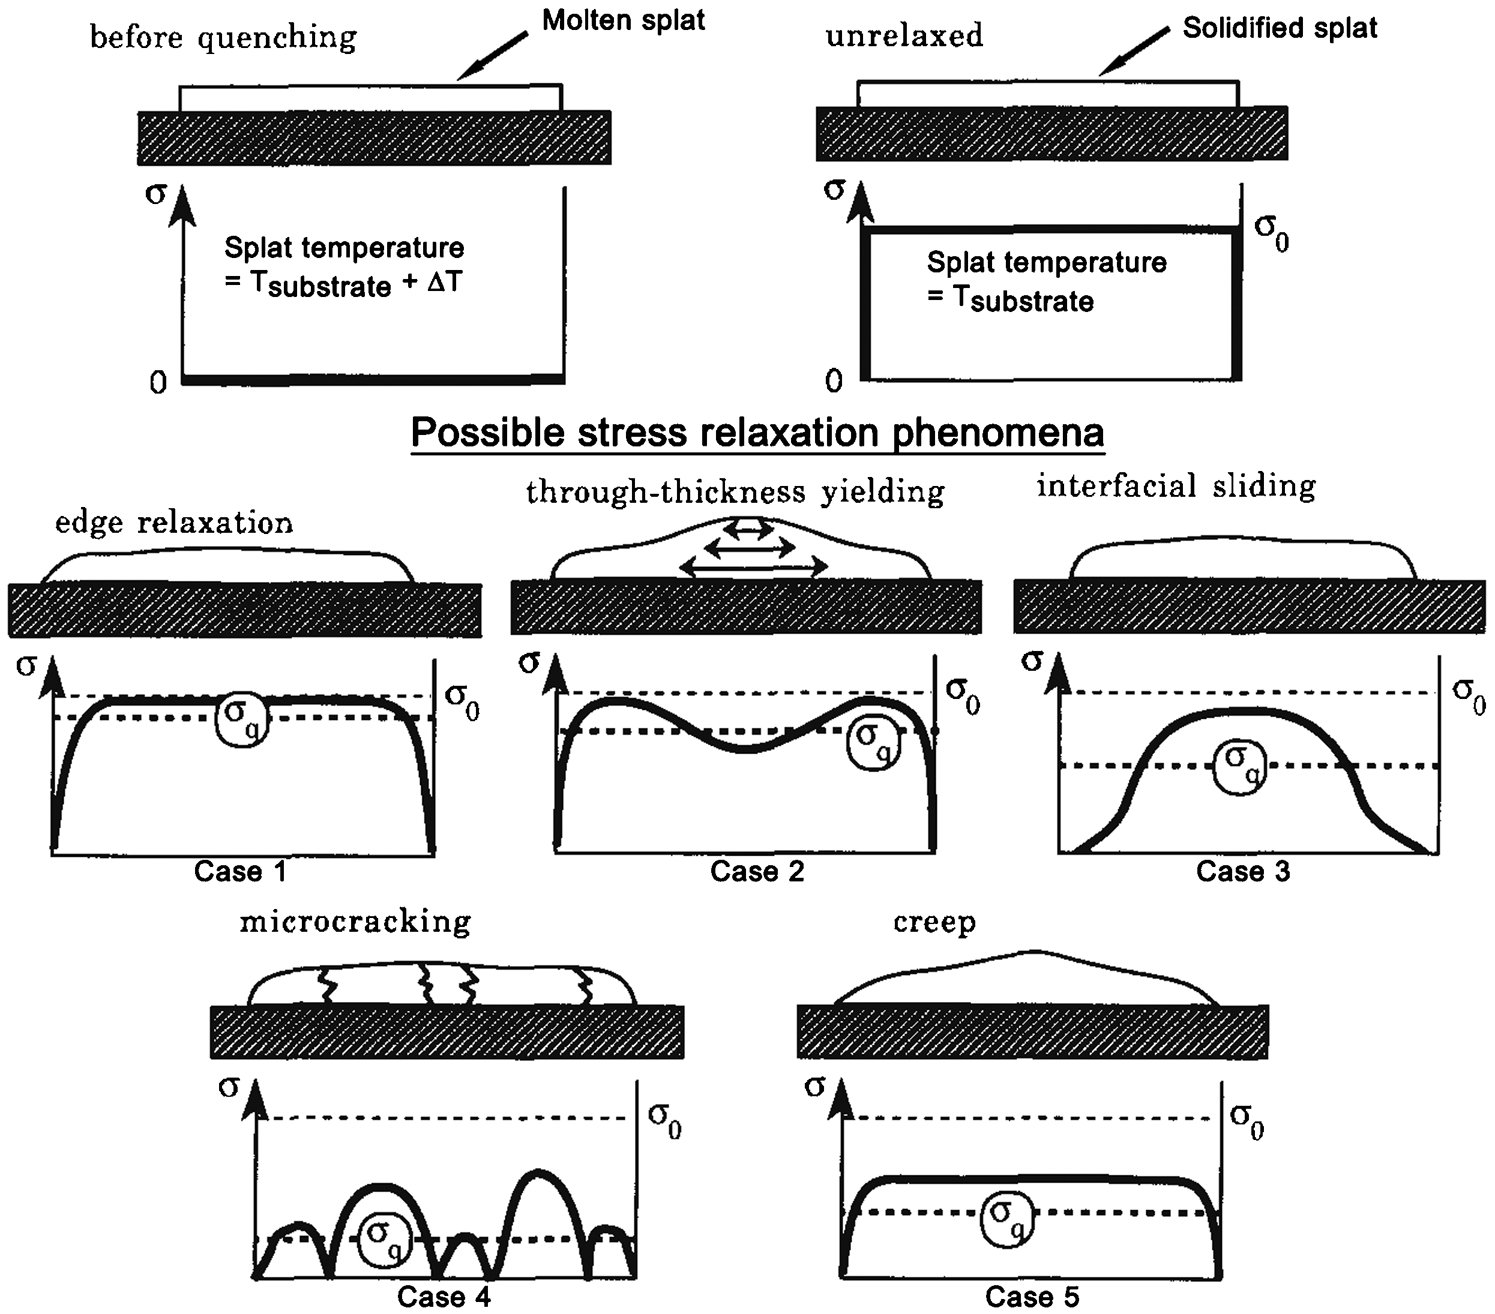
Reproduced from Ref. 117
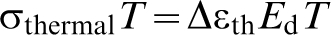
The substrate is usually maintained at an elevated temperature during coating deposition. Consequently when the coated system is allowed to cool, any differences between the thermal expansion of the deposit and the substrate will generate a second type of residual stress that is termed as the differential thermal contraction stress. Depending on the sign of the expansion mismatch, Δϵth, the macro type stresses can be tensile or compressive.
118
That is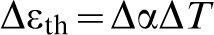
Coefficients of thermal expansion and thermal conductivity for some substrates and coating materials 121
In addition, when considering high particle velocity spray systems such as HVOF and cold spray, the semi-molten or solid particles impinging on the substrate or underlying sprayed layer cause a release of kinetic energy similar to the shot peening process. 66,119 The micro stresses that evolve are known as peening stresses. These stresses are compressive and can be considered to occur at the splat level; i.e., within microstructural elements in the order of tens of micrometres. It has been proposed that peening stresses are created within cold sprayed coatings. 122 For processes such as HVOF or D-Gun®, plastic deformation of the underlying surface will only arise when the impacting particles are partially solidified and possess sufficient momentum. The surface layer of the coating will still exhibit quenching stresses 66 due to solidification of the splats.
Apart from the coating process, the compressive stress state of the substrate surface could also be induced via the grit blasting operation. However, these stresses are partially relaxed if the preheat temperature is near the recovery temperature. These sources of stress within the coating and substrate will interact and superimpose to establish the residual stress state of the coating/substrate system. Figure 13 indicates that different thermal spray methods will produce dissimilar outcomes of the residual stress state.
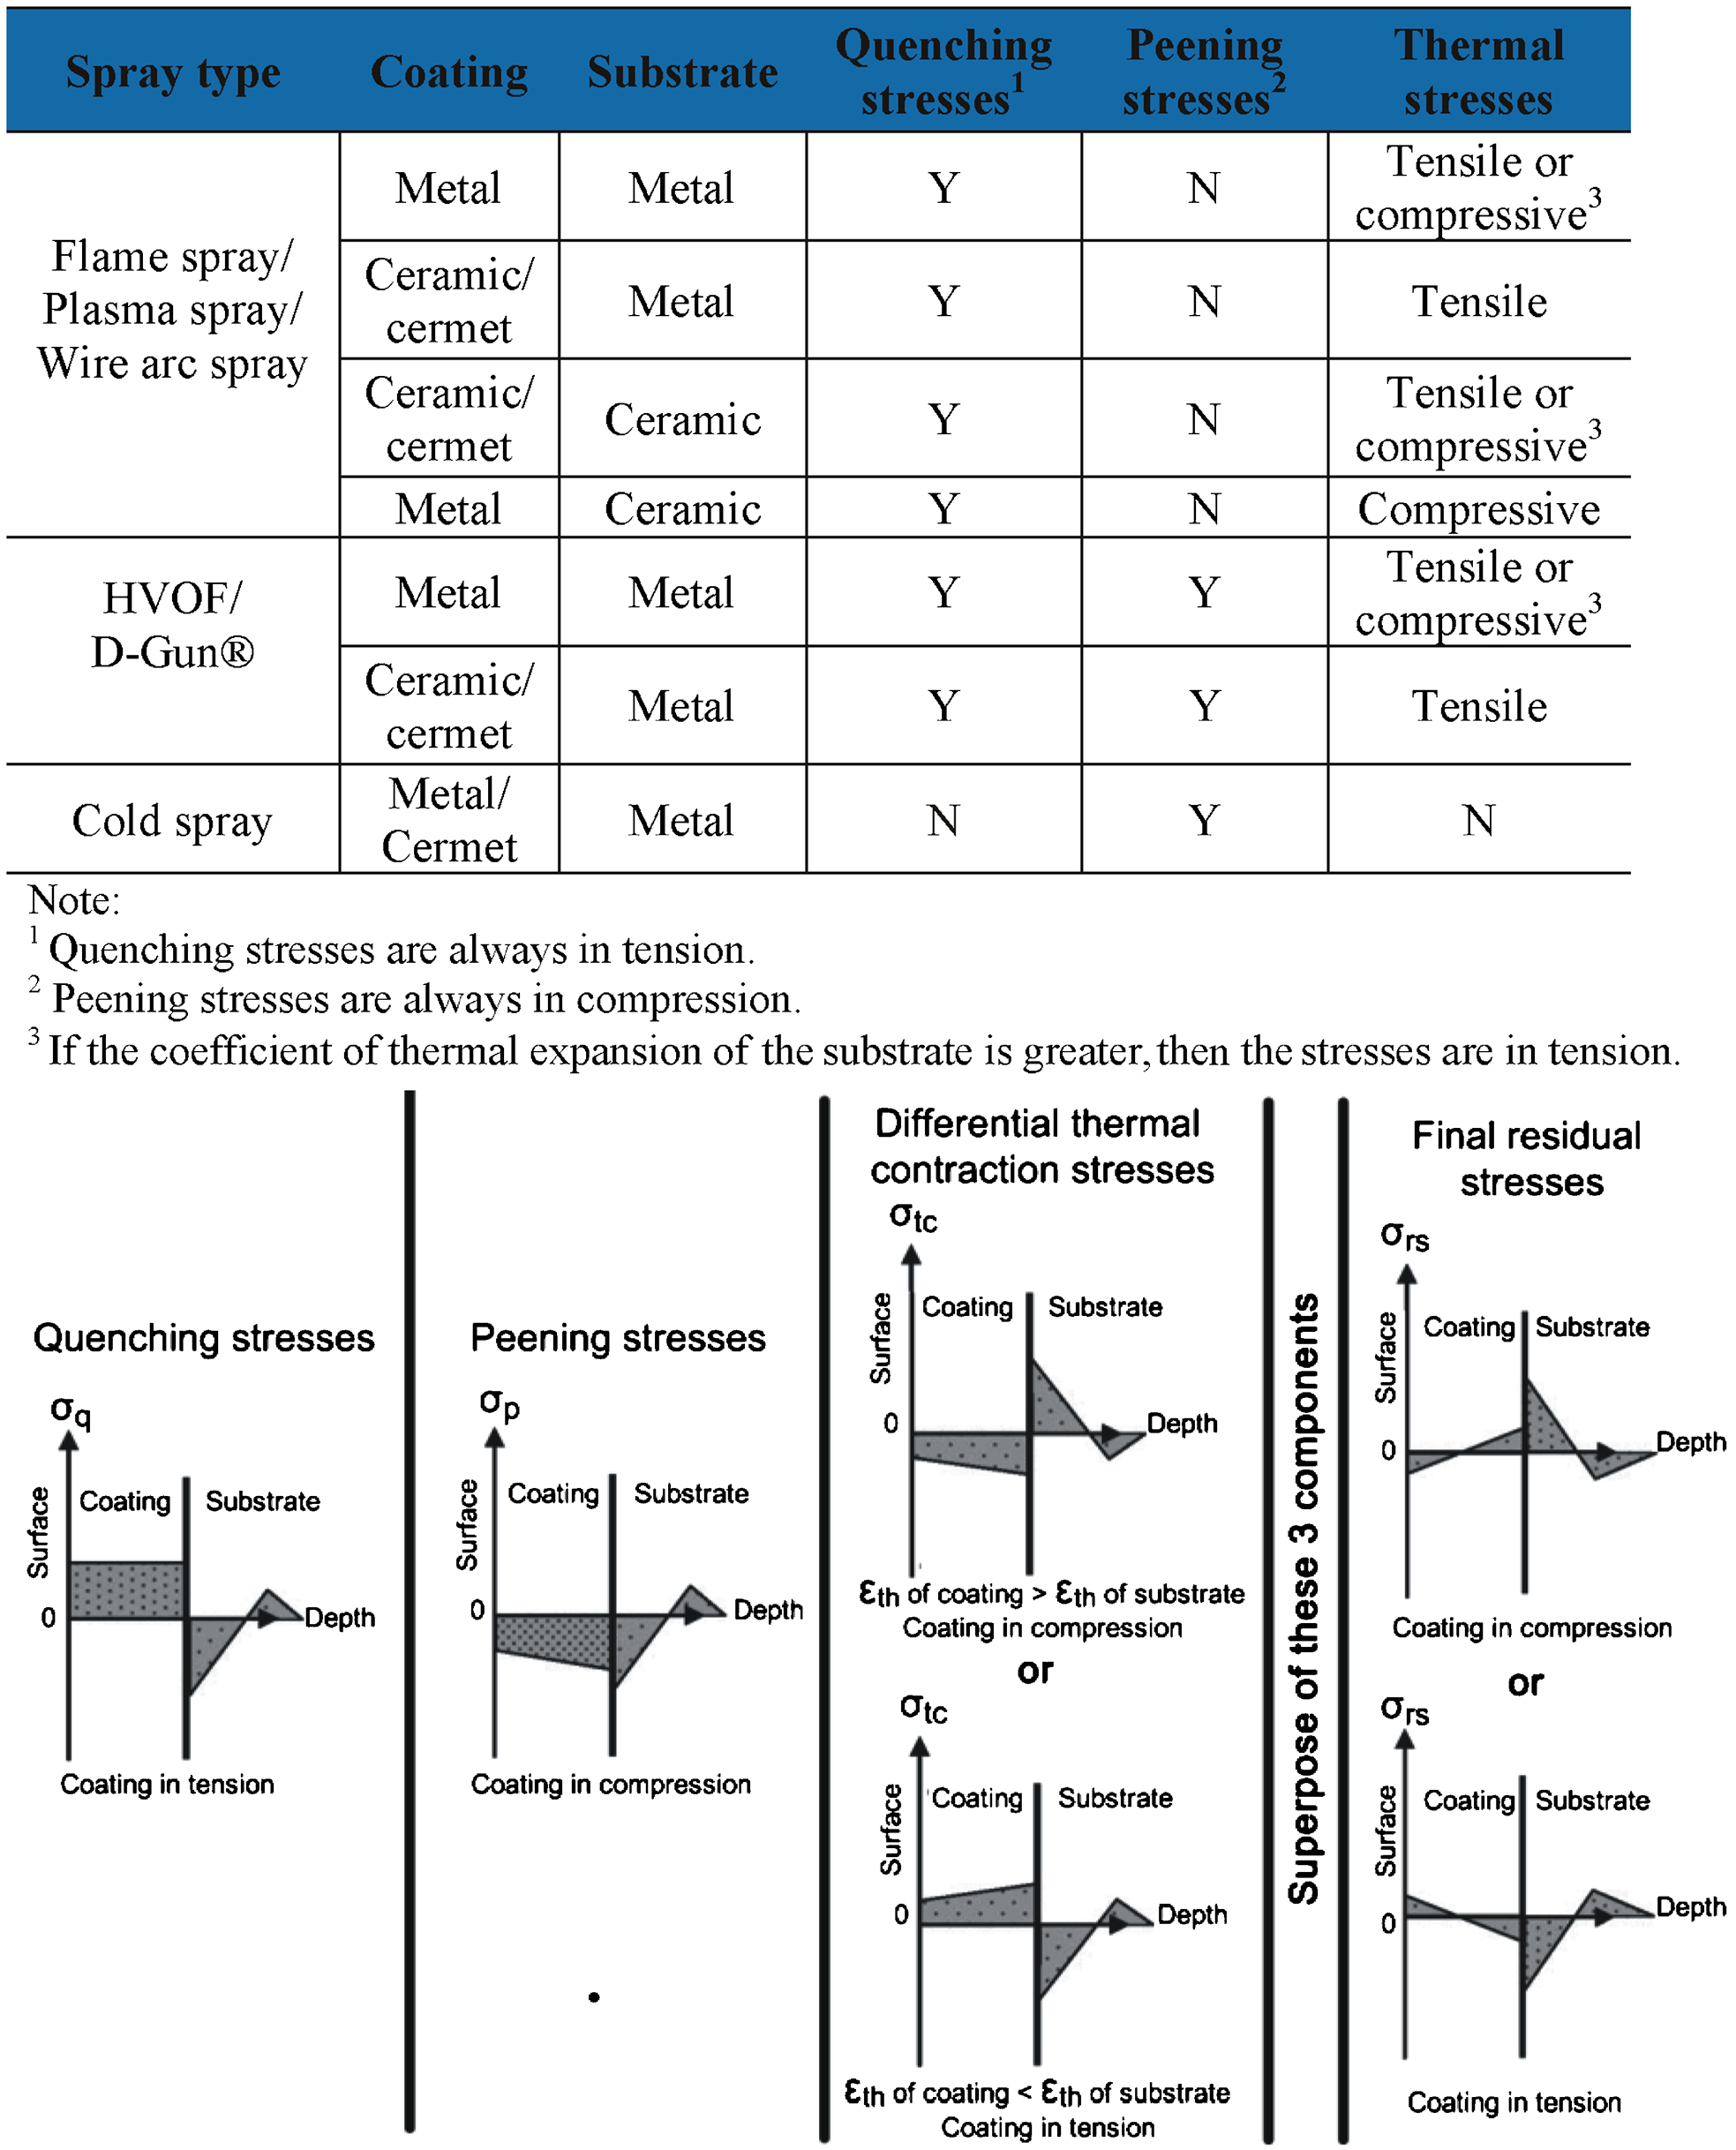
Based on Ref. 68
The final residual stress state evolves from a complex balance of stresses generated within the coating and substrate system. There are two essential considerations during practical spray process. First, the thickness per pass should be less than 50 μm and be tuned with regard to the traverse speed of the spray torch. It has been shown that a rapid rate of coating build up per pass can be detrimental to the coating mechanical properties 123 due to the discontinuity of the splat architecture. The slow torch traverse speed leads to an unbalanced distribution of coating residual stresses, 118 in particularly splat quenching stresses, 117 which can result in micro-cracking and delamination between the coating layers. Conversely, a low thickness build-up rate; i.e., less than 5 μm per pass, would lead to longer spray times that are not practical from the production and manufacturing efficiency viewpoints.
The second consideration relates to the heat flux input from the thermal spray process to the coated work piece. There are merits and disadvantages of thermal spraying a work piece at an elevated temperature. With most thermal spray processes (except cold spray), the impacting molten particles and hot gas stream imparts heat to the coated surface during deposition. Auxiliary cooling accessories, such as compressed air nozzles attached alongside the spray torch or stationary cooling air hoses, are employed to reduce the temperature of the work piece. The heating rate of the entire work piece is directly proportional to the traverse speed of the spray torch across its surface. The shape, size and mass of the substrate, along with thermal conductivity and influence of any auxiliary cooling processes, affect the net temperature of the work piece during coating. Thus, control over the substrate spray temperature requires a balance between (i) the traverse speed of the spray torch, which imparts large heat fluxes into the substrate, and (ii) the removal of excess heat with cooling accessories. The cooling jets should provide active cooling during spraying without interfering with the stream of the molten particles.
The heat flux input from the thermal spray torch traverse motion should not be confounded with the procedure of preheating substrates with a propane torch. Preheating before grit-blasting and coating deposition is intended to remove condensates and adsorbates from the substrate surface. 124,125
Maintaining the sprayed substrate at an elevated temperature during the thermal spray process has been shown by Sampath et al. 126 to lower porosity, improve coating mechanical strength and increase the coating thermal conductivity. These effects can be attributed to the crack structure within the coating because intrinsic splat quenching stresses are lower when impacting molten particles flatten onto a heated surface. 127,128 The molten splats experience longer solidification time and splat-to-splat contact is promoted. Columnar grain growth through splats occurs, further improving the interlayer bonding strength that aids to reduce the density of both vertical and horizontal cracks within the coating microstructure. As previously discussed, micro-cracking of the deposit is related to the evolution of the splat quenching stresses. 117
However, thermal spray operations at substrate temperatures above 400°C magnify other sources of residual stress; especially the differential thermal contraction stresses that arise between the substrate and coating. Table 5 shows that the values are larger for metal substrate and bond coat materials compared to the ceramics. Consequently, when spraying at high temperature, large misfit strain can arise when the coated specimen cools to room temperature and inelastic release of thermal contraction stress occurs. A thermal spray ceramic deposit undergoes extensive micro-cracking at high substrate temperatures; whereas metal deposits are prone to plastic yielding or creep. It is, therefore, not feasible to thermal spray at high substrate temperatures; although there are exceptions under VPS conditions.
Thermal spray coating testing methods
Porosity of coatings
Porosity is a key microstructural feature of thermal spray coatings. The pore and crack network originate during the chaotic processes of flattening and solidification of impacting molten droplets. Splat breakup and cracking due to rapid solidification, splat shrinkage upon cooling, and trapped unmelted particles are some of the traditional explanations for porosity formation. 1 Controlling the quantity and size of pores and cracks is essential for reliable coating performance. For instance, a coated bearing surface would require a dense coating with minimal porosity 1 while a medical implant coating requires 8–12% porosity of 50–100 μm in dimensions to allow bone ingrowth during the healing process. 129
The strain tolerance of APS YSZ coatings for thermal barrier applications has also been attributed to the numerous pores, gaps, microcracks and interfaces 130 that form the microstructure of these complex coatings. However, the high permeability of oxygen requires a dense bond coat that reduces the oxidation rate in a severe corrosion environment and such coating barriers can be applied by HVOF or VPS processes. A comprehensive review of thermal barrier coating compositions and technical approaches has been discussed by Darolia et al. 131
It is necessary to classify void morphologies to discriminate among the many pore morphologies and types of micro-cracks. The three prime void morphologies, following the outline in Table 4, are: (i) inter-lamellar pores, (ii) intra-lamellar cracks, and (iii) delamination features. It is also possible to distinguish the void network of the coating in terms of its connectivity. There can be two types of void connectivity within a thermal spray coating microstructure; (i) a closed void network, and (ii) an open void network. A closed void network describes voids that are not connected and confined within the interior microstructure of the coating. An open void network accounts for all the pores and cracks that are connected to the coating surface.
Other key interests in porosity characterisation are the total porosity content, also known as global void content, and the void size distribution. Common measuring techniques used to quantify porosity have been reviewed by Fauchais et al. 132 and Table 6 presents a compilation of these techniques with respect to the measurement capabilities. Many measurement devices are available to characterise porosity and cracks. Nonetheless, most of these techniques are highly specialised to measure a certain variable; such as the open void network content, and are unable to provide other concurrent measurements. Thus, a complete analysis of void morphologies and connectivity requires a combination of methods.
Compilation of methods to quantify porosity
Emerging technique and is still limited by sensor spatial resolution.
Many researchers have quantified porosity via IA due to its ease of implementation and ability to distinguish void morphologies, distribution and content. The IA method is described in Ref. 145. The procedure involves cross-sectioning the coating sample, then polishing and obtaining suitable images for stereographic protocols. This method, although suffering from the disadvantage of being destructive, provides an indication of porosity. The reliability of the results is influenced by factors that include (i) metallographic preparation, 138,146 (ii) the sample imaging technique, 139 and (iii) post processing techniques of the image such as thresholding procedures and other technical details.
Image digitisation of a cross-sectioned sample requires the proper combination of camera resolution, lighting and magnification. The minimum sensor resolution of the camera should be at least 3 μm per pixel when capturing a thermal spray coating with porosity artefacts of approximately 10 μm2 in area. The photographic configuration should employ near monochromatic 147 lighting. The sensor size and lens magnification also must allow an image dimension to be between 10 and 15 times larger than the objects of interest and account for the representative elementary volume (REV) of the structure. 148 For these reasons, images taken via the scanning electron microscope (SEM) that has a higher resolution than a conventional optical microscope are preferred. It has been claimed that SEM images allow the detection of finer globular and inter-lamellar pores; and finer microcracks also become visible. In addition, the higher depth-of-field allows the identification and elimination of pullouts and the crack network that is associated with sample preparation procedures. 139
The REV size requirement is governed by the magnification of the microscope images because the image resolution is determined by a fixed number of pixels on the charge coupled device (CCD) camera. While high magnification and high image resolution allow the fine details of the structure, such as micro-cracks, to be photographed, the resulting REV may be too small. The optimal REV must be large enough to capture the complete material structure and may, therefore, require a low magnification that sacrifices the image resolution. Consequently, a compromise between a high resolution and a low magnification must be made, which should be representative of the structure and independent of its location within the sample.
Post-processing of the image involves converting it into an 8-bit greyscale image format with 256 possible grey scale levels or ‘bins’. Once the image is in a grey scale format, it is converted into a black and white image by using a thresholding method. The value of the threshold impacts the output thresholded image and, as a result, can be adjusted to suit the needs of the investigator. To avoid any biasing of the results, it is recommended to use a standardised method of threshold selection such as Otsu’s method. 149 The porosity is calculated by dividing the number of black pixels by the total number of pixels in the image. In addition to this, multiple images of the sectioned sample should be taken in different locations and a consistent image processing method used. Sufficient images taken at random locations are required to ensure that the calculated average porosity is a true representation of the coating porosity distribution.
Antou and Montavon et al. 148 suggested that filters be applied on the digitised image to calculate the different void morphologies in thermal spray coatings. Filtering techniques can be divided into two categories: (i) convolution filters that are linear in nature, and (ii) non-convolution filters that are non-linear. Both techniques accomplish their results by examining and processing an image in small regions, called pixel neighbourhoods. A neighbourhood is a square region of image pixels (i.e., 3 by 3 in size). The commonly used filters are:
Non-convolutional erosion filter to remove pixels from the edges of the objects, where contiguous black areas in the image are considered objects and the background is assumed to be white. This is a morphological filter that erodes (i.e., reduces) the boundaries of bright objects in an image and enlarges the boundaries of dark ones. It is often used to reduce, or eliminate, small bright objects. A pixel will be removed (i.e., set to white) if four or more of its eight neighbours, depending on the selected option, are white. The erosion filter separates objects that are touching and removes isolated pixels.
The ‘dilation’ filter has an opposite effect compared to the ‘erosion’ filter. It adds pixels to the edges of the objects. A pixel is added (i.e., set to black) if four or more of its eight neighbours, depending on the selected option, are black. Dilation connects discontinuous objects and fills in holes. The filter changes the shape of objects by enlarging the boundaries of bright objects, and reducing the boundaries of dark ones. The dilation filter can be used to increase the size of small bright objects.
The ‘open’ filter successively executes the ‘erosion’ and ‘dilation’ filters. It smoothens the outline of the digital object and removes isolated pixels.
The ‘close’ filter has an opposite effect compared to the ‘open’ filter. It sequentially performs the ‘dilation’ and ‘erosion’ filters. It smoothens the outline of the digital object and fills in isolated holes within objects that can correspond to artefacts.
Appropriate applications of image manipulation methods allow isolation of the distinctive morphological features in an image. Subsequently, the calculation of relevant void content can be carried out.
A compilation of measured coating porosity levels using the different methods is presented in Table 7. Note that there are large variations in reported levels, even for coatings of similar feedstock and spray method. First, coating porosity levels calculated from IA via conventional optical light microscopy tend to register higher results compared to those gathered from SEM. Second, the limitations of these techniques become apparent. Particularly, IA tends to overestimate 139 and MIP provides underestimated readings compared to other techniques. X-ray computed microtomography may be used to obtain a three-dimensional representation of the porosity architecture.
Compilation of reported porosity levels for thermal spray coatings
The number of measurements for porosity varies over a large range.
Details concerning the thermal spray process, feedstock morphology, and feedstock particle size are presented.
APS: atmospheric plasma spray; VPS: vacuum plasma spray; HVOF: high velocity oxygen fuel spray; CS: cold spray; IA: image analysis; SANS: Small angle neutron scattering; MSANS: multiple small angel neutron scanning; USAXS: ultra-small angle X-ray scattering; CMT: X-ray computed microtomography; MIP: mercury intrusion porosimetry; HOSPTM: hollow spherical powders; YSZ: yttria stabilised zirconia.
Measurement of residual stresses in thermal spray coatings
Residual stress measurement techniques for thermal spray coatings can be generally classified as (i) non-destructive, and (ii) destructive. These methods can be further subdivided on the basis of the measurement principles to detect the residual stress states, Table 8.
Classification of methods to measure residual stresses in thermal spray coatings based on the measurement principle
Non-destructive methods
Non-destructive methods can be grouped into two categories. The first category employs electromagnetic radiation directed towards a coating in the form of X-ray diffraction, 172,173 neutron diffraction 174,175 or laser beam excitation spectroscopy. 176 Diffraction methods are based on the measurement of the lattice plane spacing and are capable of determining the stress state of specific coating phases. The laser beam excitation spectroscopy method explores the shifts in the Raman bands 177 or Cr3+ luminescence peaks. 176 Electromagnetic radiation methods are often adopted due to the simple experimental setup, but care needs to be taken with respect to the specimen thickness requirement and the detection depth limitations, Table 9.
Comparison of electromagnetic radiation methods of measuring residual stresses in thermal spray coatings
The use of laboratory X-ray diffraction (XRD) methods employs the reflection-based sin2ψ technique. Changes in crystal lattice plane d-spacing are measured with respect to the coating surface. Shifts in d-spacing from the original diffraction peaks and the specimen tilt angle, ψ, are correlated with internal strains in the coating. Thus, coating stress can be calculated with the use of appropriate elastic constants. 173
The conventional laboratory XRD method is limited due to the shallow penetration of the X-ray beams, typically in the several micrometres range. It is possible to determine a coating’s through-thickness residual stress profile by performing XRD measurements that require progressive mechanical or chemical layer removal. 68 However, this procedure compromises the non-destructive character of the XRD method; the details of which are provided in the next section.
Synchrotron or high energy X-rays offer 20–300 keV photons that are over a thousand times more penetrating than laboratory X-rays. Among the synchrotron techniques, transmission high energy X-rays have been used to determine localised phase composition and strains in plasma sprayed coatings. 180 This method is also based on the sin2ψ concept, but allows for diffraction of discrete volumes of coating material through the coating thickness and uses an area detector to capture the full Debye diffraction cone from polycrystalline coatings. 181 The transmission technique requires cross-sectional samples with limited thickness but does not require material removal for discrete measurements throughout the entire thickness of the coating.
The neutron diffraction methods are capable of providing a through-thickness stress profile analysis up to centimetres, without the need of successive layer removal or cross-sectioning. This method uses a pulsed polychromatic neutron beam to measure Bragg reflections at fixed scattering angles and the time of flight of each diffracted neutron defines its wavelength. Two apertures, one before and one after the specimen, define the size of incident and diffracted beams. 178 Their intersection defines the ‘gauge volume’ and is the volume being probed by the neutrons. From a set of lattice spacings in different orientations, and a stress-free lattice spacing, an elastic strain tensor can be found. Subsequently, using Hooke’s law, the stress tensor component can be established. At least six measurements in different orientations are required for the determination of the six independent stress tensor components. 182
While neutron diffraction is not limited by penetration depth, the low spatial resolution (∼0·3 mm) necessitates long scanning times 178,185 of about tens of minutes per measurement point. Neutron-based depth profiling near the interface is usually not representative of the coating. 186,187 Also, the surface ‘vertical scan’ arrangement is preferred, in which the coated specimen is moved up or down in the ‘z’ direction for the depth profiling of strain in the coating and substrate material. 188 In this arrangement there is no change in diffraction angle and, hence, no pseudo-strains generated since the gauge volume is consistently referenced with respect to the surface. A comparison of these methods 178,179,181 is presented in Table 9.
The second category of non-destructive methods to measure residual stress involves substrate curvature monitoring by optical or mechanical means. The residual stresses can be calculated by comparing the curvature of strip-shaped samples before and after spraying. 189 The in-situ curvature monitoring method, proposed by Kuroda et al., 117,120 can provide information of (i) intrinsic quenching stresses during coating deposition and (ii) the differential thermal contraction stresses created during the cooling process. Variations of this method have been implemented across laboratories 190,191 to monitor the residual stress build-up during the deposition and cooling stages.
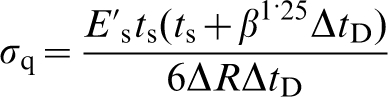
Quenching stresses are determined from knowledge of the coating thickness and the gradient of curvature response during deposition. The quenching stress, σq, can be determined by using Brenner and Senderoff’s formula
192


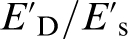
After the deposition process, the differential thermal contraction stresses can be evaluated 190 from equation (3). An example of temperature–curvature data of a plasma sprayed molybdenum coating is shown in Fig. 14. 195 The different sub-processes such as preheating, deposition and cooling can be identified. Furthermore, the effect of the deposition condition is observed to influence the evolution of the coating stress states.
Reproduced from Ref. 195
Destructive methods
In destructive tests, the thermal spray coating is subjected to strain release as a result of material removal. The measurement of change in the stressed coating microstructure can be performed by means of (i) conventional, physically attached strain gauges, 196,197 (ii) XRD, 68 or (iii) optical displacement measurements. 198,199 The destructive techniques are unable to differentiate the source of the induced stress. In addition, challenges exist in removing the material in a controlled manner. Plastic deformation or damage of the coating microstructure, especially ceramic coatings, implies that the assumption of a linear elastic change in the through-thickness stress state is invalid.
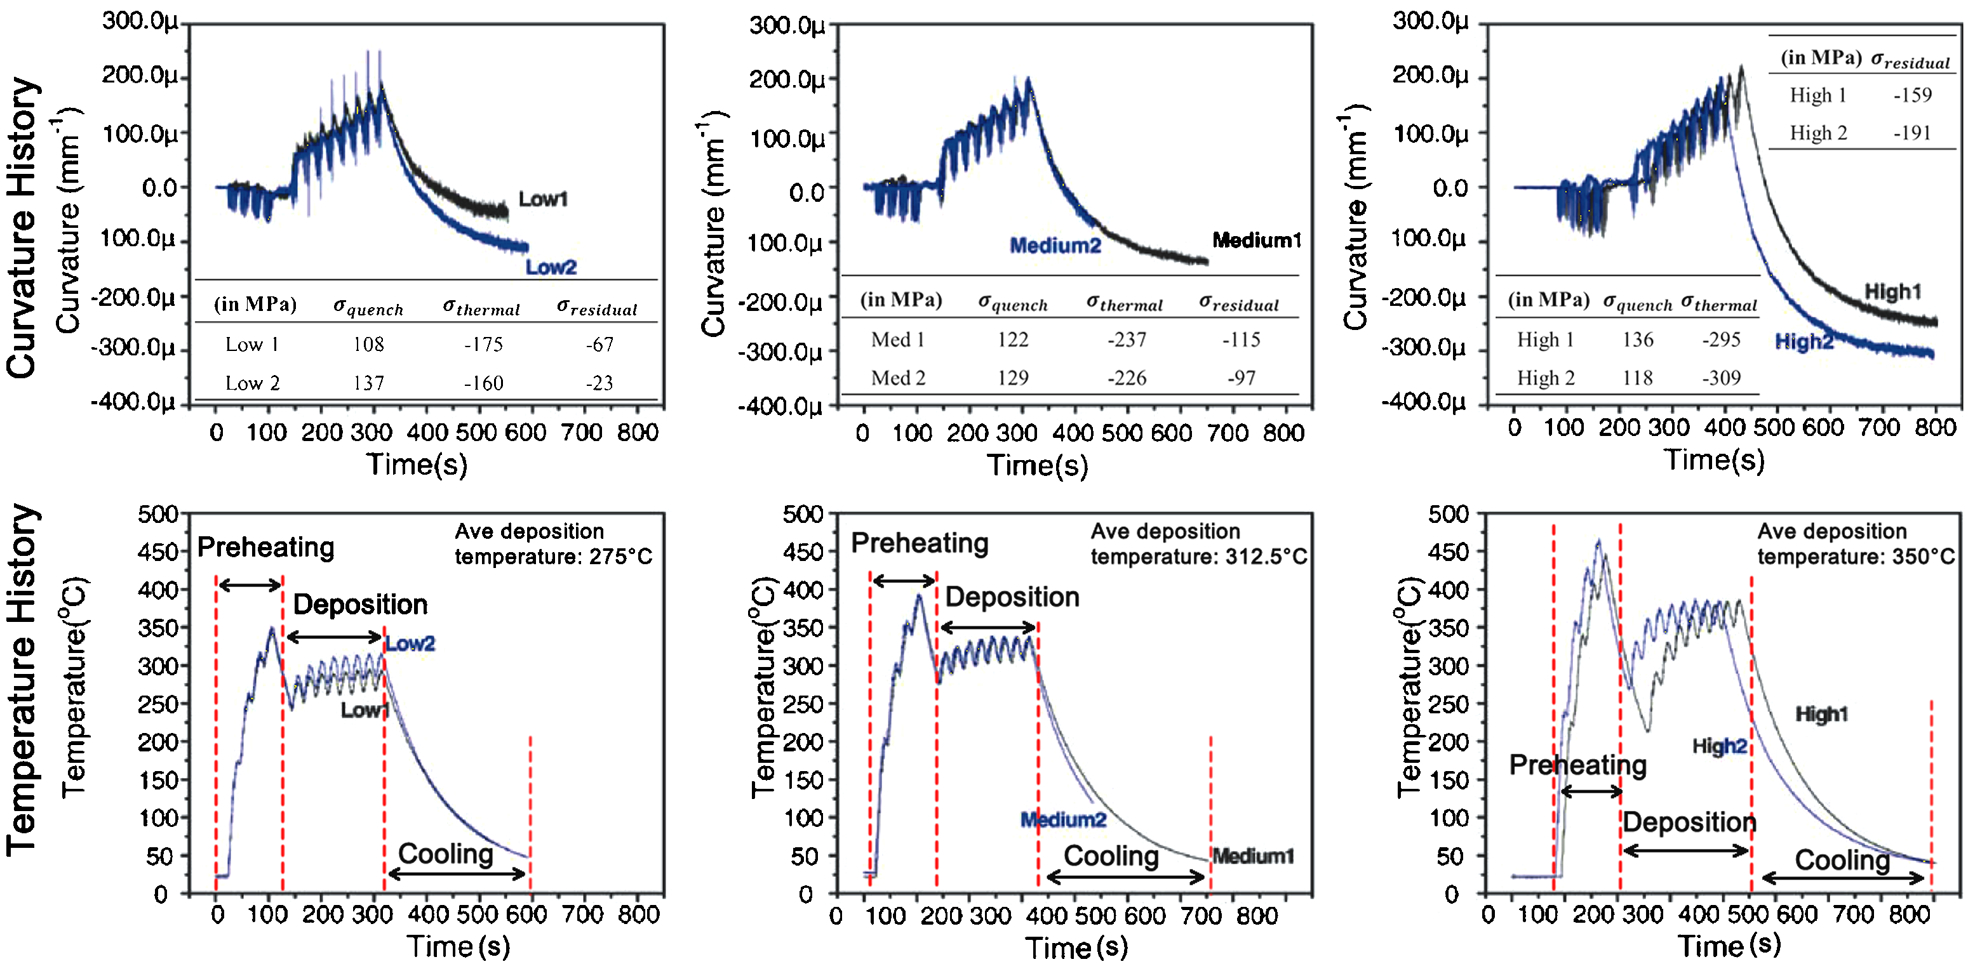
The hole drilling method that employs a strain gauge rosette is based on Mathar’s observation 200 that the shape of a circular hole drilled into a stressed structure will change. It is the most common practical technique for determining residual stresses in bulk materials. 201 Reference 202 details its execution. The hole drilling procedure, shown in Fig. 15a , involves two stages (i) removal of the stressed material by drilling a small hole into the surface of the body at the centre of a special strain gauge rosette, and (ii) measurement of the relaxation strain occurring around the hole location. It is possible to calculate the strain state by means of an analytical model. 197
However, since thermal spray coatings display non-uniform through-thickness residual stresses, it is recommended to measure the stress profile through the coating. Therefore, the technique can be modified to perform incremental hole drilling. This method involves drilling a series of small steps of about 20–40 μm in depth 203,204 that produce measurable strain relaxation. Analytical evaluation of the detected strain data using an ‘integral method’ is considered to be the most suitable 204,205 data analysis method. It considers simultaneously the contribution of the measured strain relaxation of the stresses at all depths and also provides a separate evaluation of the residual stresses with each depth increment.
An alternate method was proposed by Greving et al. 196,206 that involves the controlled removal of the coating via either electropolishing or wet polishing and monitoring the changes in strain on the substrate side (see Fig. 15b ). The method is based on the concept that the removed layer from the surface of a stressed plate or beam will release a force and moment acting on the remaining sample. The removed layer has to be insignificantly small so that (i) sufficient depth resolution is achieved, and (ii) the material removal process does not induce strain artefacts. Accordingly, the recorded strain data and thickness changes are used as inputs to calculate the residual stresses. 196
Although low energy XRD methods offer high spatial resolution, there is a 10–50 μm depth detection limitation owing to the effective penetration of the radiation source wavelength and coating material. 179 Thus, the strain measured on an as-sprayed coating relates to (i) a depth of no greater than its surface roughness, and (ii) is within a region subjected to substantial stress relaxation. 118 Methods that combine the residual stress measurements from coatings of varying thicknesses are not an accurate representation of the through-thickness stress profile.
Therefore, to allow the residual stress depth profile analysis of a single thermal spray coating sample, controlled removal of the coating layers using electropolishing for metals or cermets and wet polishing for ceramics has been combined with a reflective-based X-ray technique. 68,207 Transmission high energy X-rays also can be applied to cross-sectioned samples for residual stress measurements. 208 This technique allows diffraction from discrete volumes of coating material through the coating thickness and uses an area detector to capture the full Debye diffraction cone from a polycrystalline coating. 181
Other residual stress measurement methods that have been applied include Moiré interferometry with cutting relaxation, 198 probing surfaces with an indenter 209 and digital image correlation with focussed ion beam milling techniques. 198
The hardness of thermal spray coatings
Types of hardness test for thermal spray coatings
Indentation tests 210 have been used widely for thermal spray coatings to quantitatively measure their resistance to deformation under an applied load. Mechanical properties such as hardness, 211–213 elastic modulus, 164,214 fracture toughness, 109,215 and interfacial adhesion or cohesion strength 216,217 can be determined by performing variations of the indentation test method.
Reference 218 describes hardness test methods for most materials. Both of these indentation methods are commonly used for thermal spray coating characterisation. Essentially, the type of indenter (i.e., Knoop or Vickers) yields the associated hardness number. Specifically, for the indentation testing of advanced ceramics, there are five unique standards as shown in Table 10.
Test standards for the indentation microhardness test
Standard includes both Knoop and Vickers indentation tests.
1. ASTM C1326-08: ‘Standard test method for Knoop indentation hardness of advanced ceramics’.
2. CEN ENV 843-4: ‘Advanced technical ceramics – Monolithic ceramics – Mechanical properties at room temperature, Part 4: Vickers, Knoop and Rockwell superficial hardness tests’.
3. JIS R1610: ‘Test methods for hardness of fine ceramics’.
4. ISO 4516-2002: ‘Metallic and other inorganic coatings – Vickers and Knoop microhardness tests’.
5. ASTM C1327-08: ‘Standard test method for Vickers indentation hardness of advanced ceramics’.
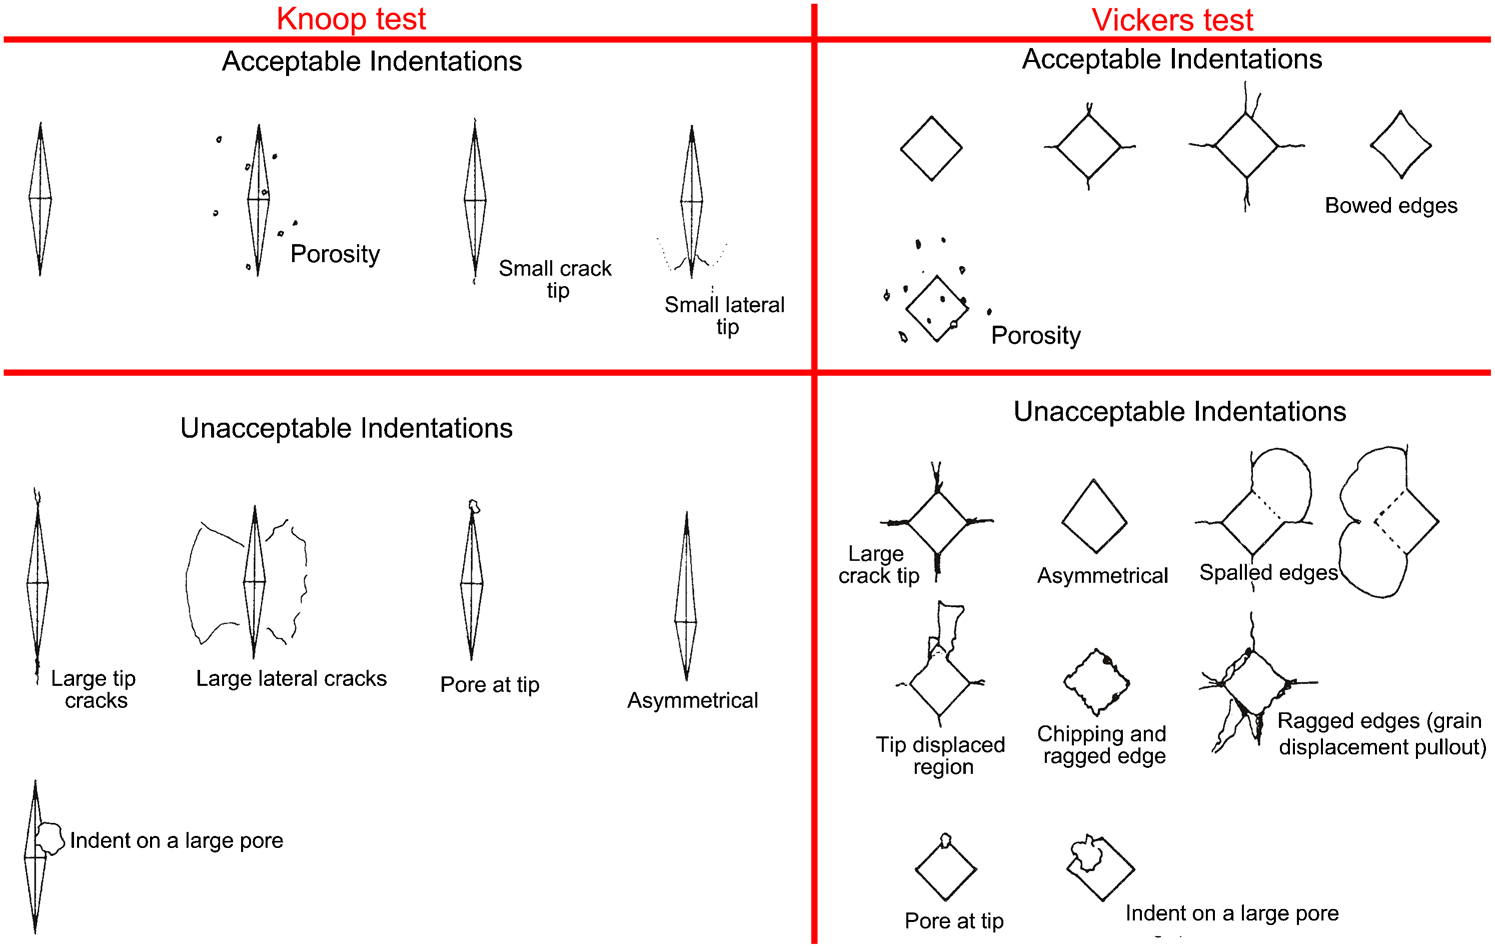
These standards highlight that ceramic materials have a tendency to develop cracks during testing as opposed to metal materials. Therefore, indentation at a small test load (typically less than 1000 gf) or microindentation hardness testing is recommended for ceramic materials. It is also necessary to allow sufficient spacing in between successive indents and implement a procedure to reject indents that develop excessive cracking. These details are covered within ASTM standards C1326 219 and C1327 220 and are also represented in Fig. 16.
Another reason to avoid macroindentation hardness tests, which use loads between 1 and 100 kg, on thermal spray coatings concerns the size of the indent imprint. Typical thermal spray coatings have thicknesses less than 1 mm; thus macroindentation hardness tests on the coating top surface cannot be applied because the depth ratio of the imprint to coating thickness must be at least*4 10. 219,220 Similarly, if the macroindentation hardness tests were performed on cross-sectioned coating samples, the imprint diagonal lengths will most likely exceed the dimension of the coating surface under examination. Under a load of 1 kg (i.e. 9·81 N) the Vickers indent diagonal length for materials of 300–800 HV is between 78 and 48 μm. The depth of imprints on cross-sectioned coatings should preferably not be greater than the splat geometry since the deformation response of the underlying layer cannot be resolved. On the other hand, microindentation hardness tests have the attribute of a small indent imprint; therefore specific phases or constituents and regions can be evaluated. Such information would be lost if a macroindentation test was performed.
Vickers and Knoop hardness tests
The Vickers indentation test uses a square-based, pyramidal-shaped diamond indenter with an included angle between opposite faces of 136°. Indentation is carried out at a predetermined load onto the surface of the polished coating. The Vickers hardness, HV in units of GPa, is determined from using the following relationship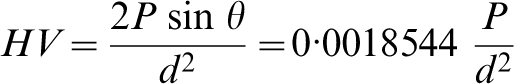
The SI unit of GPa is similar to that of pressure, tensile strength or elastic moduli and suggests that hardness may be correlated with the intrinsic material properties. 210,221 There is such a correlation between the hardness values and elastic modulus. 222,223 However, hardness is a more complex property than elasticity since it involves plastic deformation and brittle failure. 221 Therefore, interpretation of a hardness value without relating this number to the microstructure may lead to a poor understanding of structure–property relationships.
A Knoop indentation test involves using a calibrated machine to force a pointed rhombic-based, pyramidal-shaped diamond indenter with specified face angles, under a predetermined load into the coating surface. Figure 17 illustrates the geometrical dimensions of the Vickers and Knoop indenters and sketches their indention impressions. Unlike a Vickers hardness test, Knoop indentations only require the measurement of the long diagonal of the resulting impression.
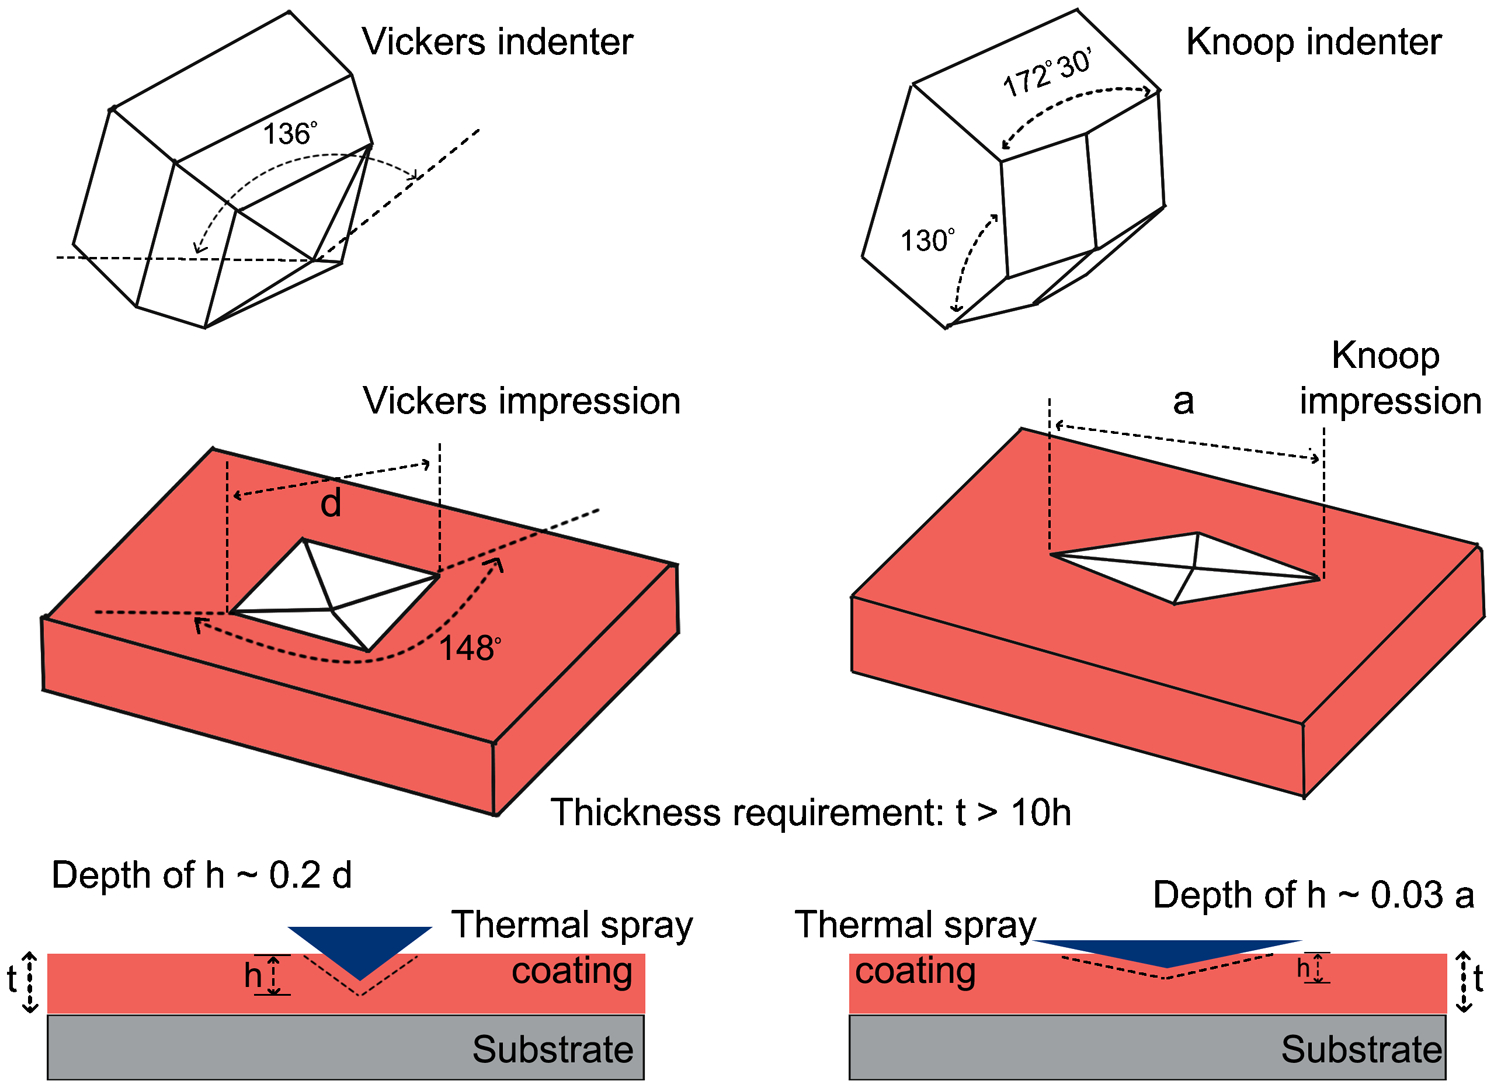
‘t’ is the coating thickness; ‘h’ is the penetration depth of the indentation; ‘d’ and ‘a’ are the diagonal impression lengths for the Vickers and Knoop microhardness tests, respectively
Another difference in comparison to the Vickers test concerns the calculation of Knoop hardness, which is the ratio of the applied test load to the projected area on the indented surface. The Knoop calculation assumes that the elastic recovery of the narrow diagonal is negligible. The mathematical relationship of Knoop hardness, in GPa, is given as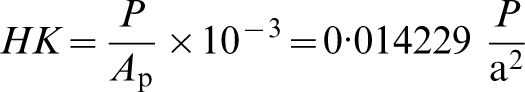
The diagonal lengths of a Vickers indent are approximately 2·8 times shorter than the major diagonal of a Knoop indent for the same specimen at a similar test load. The indentation depth of the Vickers indent is approximately 1·5 times more deep than the Knoop indent. 220
The deeper Vickers indents are, therefore, more likely to cause cracks in ceramics than Knoop indents. The cracks may influence the measured hardness by fundamentally altering the deformation process that contributed to the formation of the impression. Generally, the cracks impair the measurement of the diagonal length because of distortion at the indent tip and edges. On the other hand, the long slender tip edge of the Knoop indentation is more difficult to discern precisely; especially for thermal spray coatings that have revealed multiple phases.
The Vickers and Knoop hardness measurements exhibit dissimilar indenter geometries and, thus, different impressions on the coating surface. Thus, forming relationships between these hardness scales is not recommended. In other words, there is no numerical equivalency between the Knoop and Vickers hardness scales and empirical conversions between these scales have no basis in scientific rigour.
Microstructural relationships in hardness testing.
The hardness values should be independent of the test load since the impressions made by the indenter are geometrically similar. However, it has been reported 224,225 that lower test loads are more affected by localised microstructural variations than higher test loads. The ensuing hardness–load dependence was also found for microhardness testing of bulk ceramics and is known as the indentation size effect (aka ‘ISE’). 226 The ISE states that hardness will usually decrease with increasing indentation test load until it reaches a constant, 227 assuming that there are no substrate-induced effects. The phenomenon has been associated with factors such as the lamellar microstructure, surface energy and indenter shape. The ISE was more pronounced during hardness testing of thermal spray coatings due to the heterogeneous microstructure. The scatter experienced with the void systems, as well as the different phases of solidified splat layers, influenced the elastic response of the indent.
Therefore, the test load should be reported with the hardness value. The recommended choice of test load for both indentation methods should be sufficiently large to allow good indent observations but not cause excessive cracking at the surface. Typical microhardness test loads used for thermal spray coatings are 1 N (100 gf), 3 N (300 gf) and 5 N (500 gf). Lower test loads should not be used unless accompanied with suitable microstructural evaluation and the ISE should be taken into account during the reporting of such data.
The materialographic preparation before testing can influence the hardness results. In most cases, measurements were made with the test indent on the cross-section of the lamella structure. Thus, similar to porosity measurements by IA, the accuracy of the hardness test depended on the surface roughness that arises from the grinding and polishing procedures. An appropriate method of sample preparation for thermal spray coatings is described by Ref. 228.
Berndt and Leigh 105 have shown that the Knoop hardness in the plane of the coating surface was about 1·5 times higher than indents made perpendicular to the substrate; i.e., on the coating cross-section. This can be explained by the anisotropic architecture of thermal spray coatings on the two orthogonal planes of symmetry. Thus, as illustrated in Fig. 18, indentations carried out (i) parallel to the spray direction, and (ii) perpendicular to the spray direction, should yield different values due to the splat piling orientations. The distinct void network and the volume of material under indentation loading account for the relative differences in hardness values.
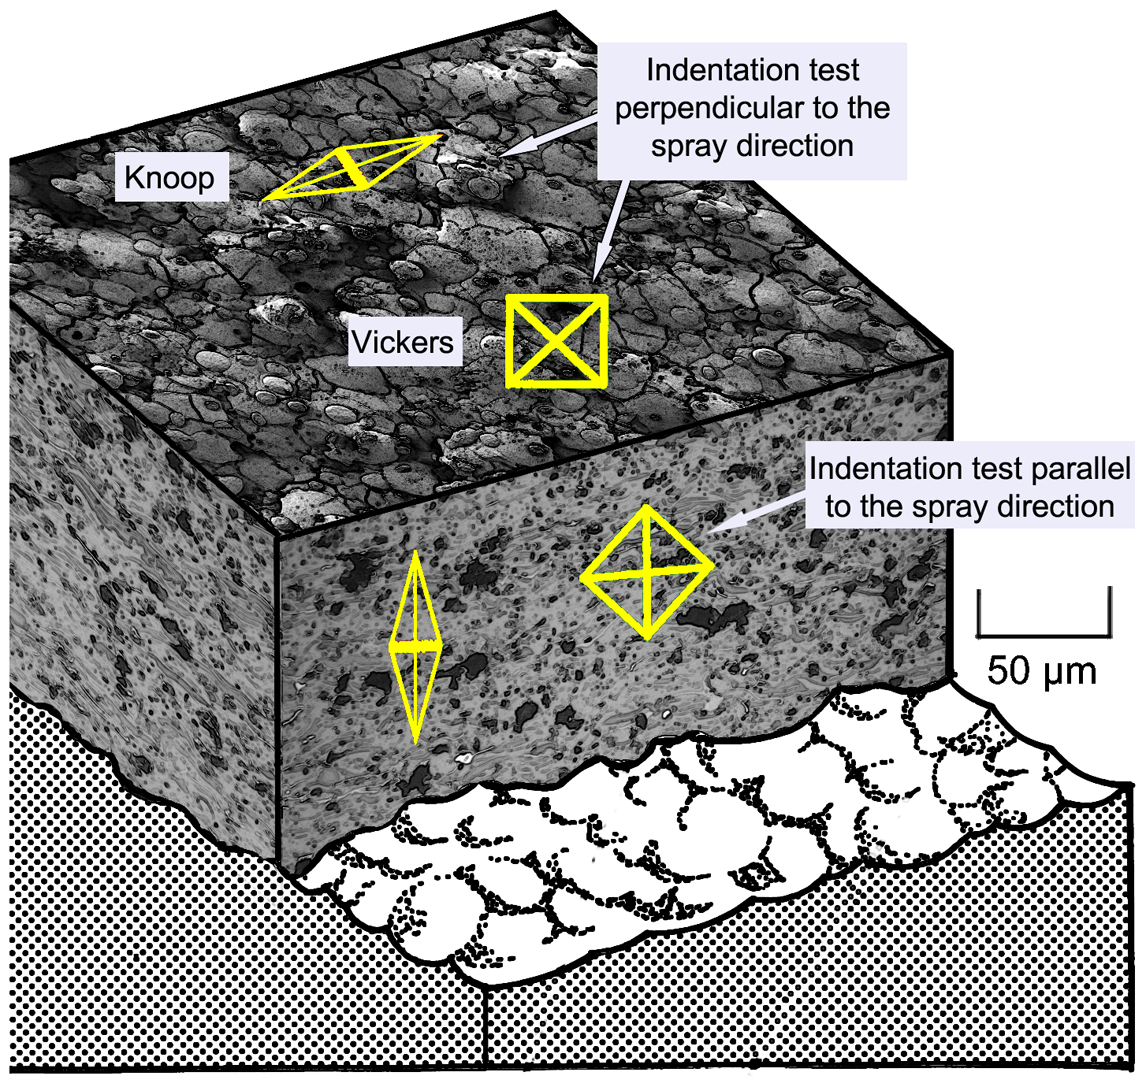
Indentation test perpendicular to spray direction (coating top section) and parallel to spray direction (cross-section)
The most common orientation for an indentation test is on the cross-section of the thermal spray coating. However, the literature makes little mention of the indenter orientation with respect to the thermal spray lamellar microstructure. Thus, the indenter alignment can exhibit two prime orientations where the pyramid axes are rotated by 90°. It can be appreciated that the indent orientation may influence the test results; for instance, the axis of the indenter can be aligned (i) along the lamellar layers, or (ii) across the lamellar layers. Therefore, under such testing conditions the coating cross-section might reflect anisotropic behaviour.
It was expected that there would be scatter in the hardness data for a thermal spray coating because the random distribution of the pore and crack network influences the indent hardness values. Subsequently, the reliability of the entire data depends on the number of indentations performed. Ten indentations are recommended by the ASTM standards for Vickers and Knoop hardness tests. However, the heterogeneous nature of thermal spray coatings indicates that more indents are necessary. The associated coefficient of variance; i.e., standard deviation divided by the mean, should also be reported with the calculated mean. 227 Berndt et al. 211 and Valente et al. 212 further suggested that the hardness data could be assessed by using statistical tools such as the Student’s test and Weibull distribution analysis. The data scatter can be reduced by performing tests on carefully selected regions that appear to have no void defects. However, it must be cautioned that preferentially choosing dense areas within the coating for indentation will bias the data to high values and is not recommended.
Another indent technique uses a spherical indenter 229 that is intended to reduce coating damage during indentation. The stress field under such a blunt Hertzian indenter is quite different from that generated under a sharp indenter. 230,231 Thus, comparisons of data generated by these two different test methods are not valid. A similar argument can be made concerning Rockwell hardness tests that employ a brale, 120° diamond cone, indenter.
Individual splats and lamellae can be characterised by using nanoindentation techniques that employ a 3-sided pyramid-shaped Berkovich tip. 232 Nanoindentation is highly sensitive to the material phases and structural defects within the splat and is, thus, defect sensitive. The nanoindentation technique has also measured the material properties of singular nano-sized splats in coatings. 233–235 In these tests, the nano-sized indents lie entirely within a single lamellar and it is expected that the indent depth is less than 1/7 of the lamellar thickness. Thus, these indent tests measure intrinsic material properties and represent the maximum value in coating characteristics. The influence of crack and pore networks that are micrometre-sized are not measurable by nanoindentation methods.
Bond strength of thermal spray coatings
The unique microstructure of thermal spray coatings contributes to several bonding mechanisms within the layers. The possible bonding mechanisms present in a typical thermal spray coating can be categorised into five major types: (i) mechanical keying, (ii) physical adhesion by dispersion forces, (iii) chemisorption and epitaxy, (iv) diffusion, and (v) chemical reaction. 236,237 The dominating bonding mechanisms vary with specific coatings and are sensitive to factors such as surface roughness; thermal stresses at the interface; and particle velocity and temperature before impingement. These aspects can be categorised with respect to process parameter controls. For instance, coating procedures such as parameters for grit blasting can influence the degree of mechanical keying, which will reflect on the coating adhesion strength.
It is difficult to measure accurately the magnitude of each type of interfacial bonding mechanism. Thus, laboratory tests have focussed on a holistic approach for measuring the bond strength that relates to the entire coating structure. Measuring the ‘adhesion bond strength’ of the coating not only addresses the interfacial problem of the lamellar character of a coating but also involves the integrity of the interfaces between the substrate and coating, residual stress, crack population, pore size, and pore distribution. Techniques suitable to study the adhesion bond strength of coatings have been presented. 217,237–239 Some of the quantitative methods used to measure the bond strength of coatings can be found in Table 11.
Methods to quantify thermal spray coating bond strength on the basis of the measurement principles
The most common method to measure coating adhesive bond strength follows the tensile adhesion test (TAT) method. 243 There are industrial and national standards that provide guidelines to performing TATs; e.g., described in Ref. 240. The TAT method is comprised of a thermal spray coated disk of a known diameter that is attached with epoxy to a complimentary uncoated plug. A tensile force is then applied to the coating assembly using a uniaxial tensile loading device. The ultimate stress at failure is known as the coating system’s minimum tensile adhesion or cohesion bond strength, depending on the interpretation of the failure locus as shown in Fig. 19. Attention should be taken in interpreting the results, especially for multi-component coatings, since the TAT value is a measure for failure at the weakest plane that may occur in a combination of locations.
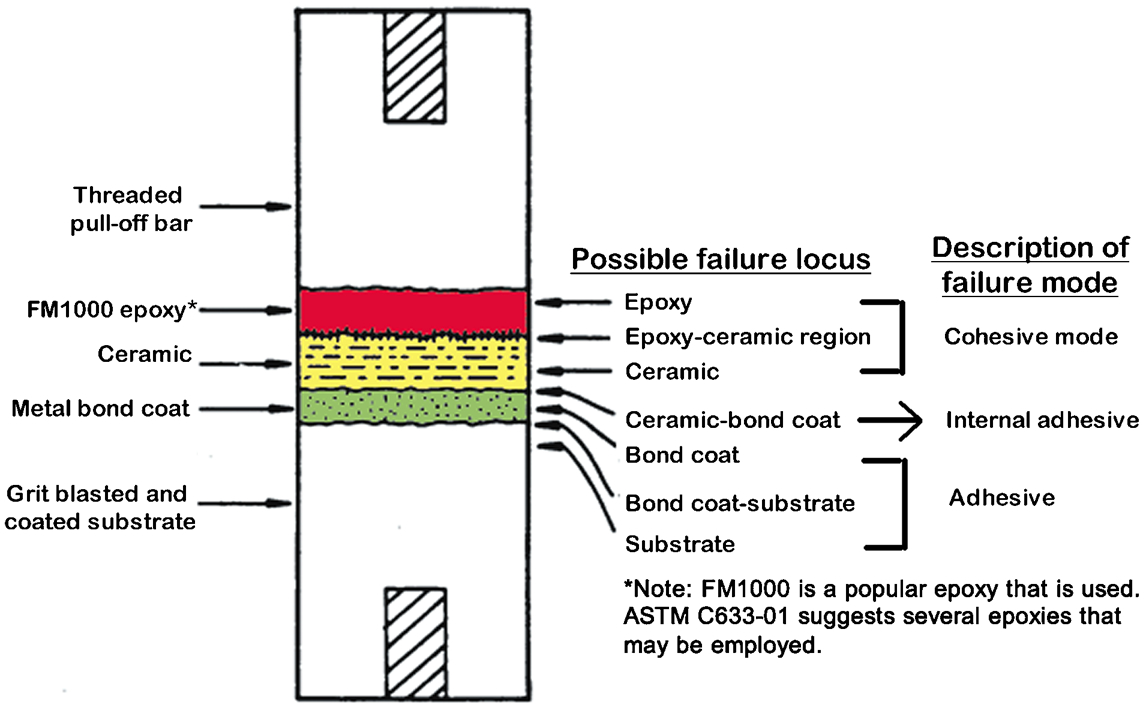
The coating system is not drawn to scale but exaggerated for clarity of potential coating failure modes
It is important to note that the description of the ‘failure mode’ is not to be confused with ‘failure mechanism’. The failure mode refers to the physical description of the failure location determined from Fig. 19. This description provides only limited insights into the fracture process; that is, how and where micro-cracks initiate, grow in size, coalesce with each other, and interact to form macro-cracks; causing eventual coating failure. Such understanding of the fracture process relates to the failure mechanism. Coating failure mechanism studies can be carried out using acoustic emission or ultrasound to qualitatively assess the thermal spray coating behaviour. 261–263
It is also pointed out that the tensile adhesion strength for a test is calculated by dividing the maximum load by the tested cross-sectional area. However, this may not always be a true reflection of the adhesion strength. In the case of partial failure, a region of a coating that did not detach or fail and may remain on the substrate after the test. The measurement of the effective failure area is, therefore, uncertain. Possible data normalisation could be achieved by either testing the remaining coating or accounting for the reduction in failure area in the calculation of adhesion strength. 264 The ASTM standard and similar standards from other organisations does not allow for such a normalisation procedure; nor has such a procedure been reported in the literature.
The TAT test results often display large variability in the failure stress and, thus, the minimum number of tests required to obtain reliable results is often questioned. 243 The ASTM standard recommends testing five sprayed samples and averaging the adhesion strength. This method may serve as an effective tool for industrial quality control but is insufficient for quantitative research in which the variability in strength is of interest. Thus, experiments must be conducted to a coefficient of variance of about 30% to determine a valid statistical representation of the failure bond strength for a specific coating. A low coefficient of variance is an indication of good repeatability within a data set.
The statistical analysis can be further extended by fitting the data set to an appropriate distribution function; i.e., either a Normal or Weibull distribution, to allow the study of failure probabilities and ascertain estimations for the coating strength. The Weibull distribution is an effective representation of brittle materials such as ceramic thermal spray coatings. 243 The underlying hypothesis of the Weibull distribution 265 is that failure of a structure initiates within the microstructure, which causes macroscopic crack growth. A material structure can be segregated to small representative elements or volumes. These elements will interact in the same way as the links of a chain. Therefore, cracking from one representative element will cause the whole structure to fail. The application of the Weibull model to thermal spray coatings is valid since the likelihood of failure would be caused by the initiation of micro-cracks and crack growth within the lamellae in an analogous fashion to the failure of a chain.
The TAT stress and strain properties of samples are not usually reported or used to distinguish the mechanical properties of different coatings. As stress and sample extension measurements are variables recorded during a test run, analysis of these measurements could be performed. Berndt et al. 244 demonstrated that the stress v. extension plot was useful in identifying coating failure modes. The stress and strain properties also related to (i) the mechanism(s) of lamellae sliding over each other, (ii) the coating porosity level, and (iii) the elastic modulus of the coating.
Tensile adhesion test procedures have shifted to using a heat activated, film adhesive instead of the traditional two part liquid mix that has the potential of excessive penetration into the coating. 266 In a round robin test conducted using liquid and film epoxies, it was found that liquid epoxies resulted in a higher tensile strength and greater scatter in data. 267 Other criteria pertinent to TAT methods include (i) a coated specimen area between 452 and 531 mm2 (i.e., about 1 inch in diameter) that was normalised with respect to the maximum failure force, and (ii) the tensile test machine crosshead rate of between 0·010 and 0·021 mm s−1 to simulate quasi static loading conditions.
The stud pull test, see Fig. 20a , proposed by Elmoursi et al. 246 is similar to the TAT described earlier. It can be applied to coatings deposited on any geometrically flat sample and employs a simple, portable pull-off tester. However, it also requires machining around the circumference of the bonded stud-coating boundary. The machining can be performed either using EDM or a slurry fed rotary-disc cutter. Both of these methods can introduce sectioning or thermal stresses; as well as being difficult machining processes for ceramic or cermet coatings.
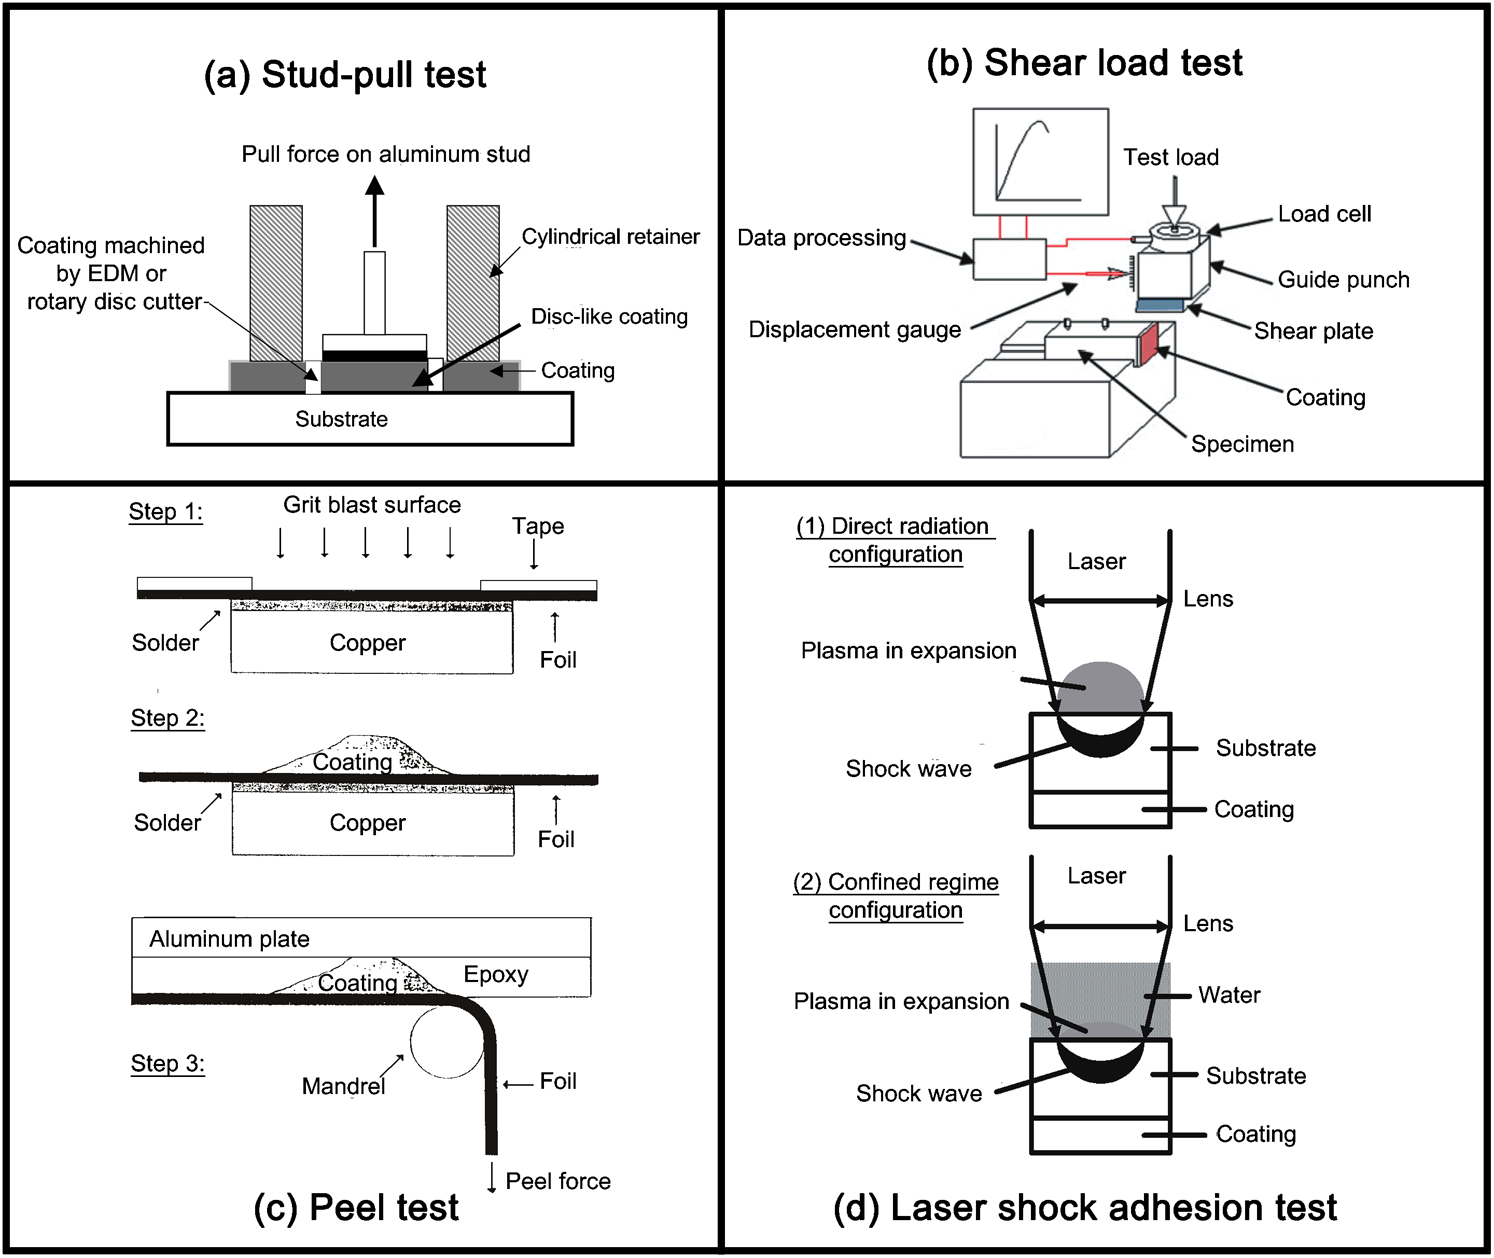
a stud-pull test, b shear load test, c peel test, and d laser shock adhesion test
Another method that does not require the use of an epoxy is the shear load test; Fig. 20b , which probes the coating’s resistance against shear stress and is claimed to be akin to loading conditions of coatings in practice. 248 The DIN EN 15340 247 standard describes the execution steps for testing. Three failure types can be determined, (i) cohesive, (ii) adhesive and (iii) a mixed adhesive/cohesive.
Other techniques to measure the bond strength of coatings include the peel test 249 (Fig. 20c ), a laser shock adhesion test 251 (Fig. 20d ), the pin and ring test, 239 the scratch test, 256 and the indentation test. 259
Stiffness of thermal spray coatings
The elastic moduli, E c, or coating stiffness of thermal spray coatings usually differ from the corresponding bulk material, especially for ceramic and composite coatings. 268,269 The coating elastic modulus can be viewed as an indication of the following intrinsic microstructural properties: 164,270,271 (i) inter-lamellar splat cohesion, (ii) porosity or the void and crack network, (iii) chemical phases and their proportions within a coating, and (iv) the residual stress state.
Elastic modulus measurements
The elastic modulus is traditionally evaluated from the slope of the initial linear portion of the stress–strain curve. Beyond the elastic limit, the sample undergoes plastic deformation, yielding and finally fracture. For bulk ceramic materials, the associated elastic limit, elastic modulus and fracture strength is a well-defined value.
However, for thermal spray ceramics or composite coatings, the elastic modulus is influenced by factors such as cohesion of the lamellae as well as the distribution of void and crack networks. The inhomogeneous architecture of a coating is likely to cause pseudo ductility because the lamellae may slide over each other. 268 In response to the external loading, the elastic energy dissipation will be governed by crack growth and fracture. Therefore, the determination of the precise elastic limit, as well as estimating the linear portion of the stress–strain curve can be a challenge. Consequently, there is a wide range of values for E c for similar coating compositions deposited by an identical thermal spray method. These values can differ significantly from the equivalent bulk material. 269,271
The stiffness result is sensitive to the test direction due to the anisotropic nature 164 of the coating. In other words, it is important to remember the relative orientation of mechanical testing since the elastic moduli of thermal spray coatings are different in a direction parallel to the coating surface compared to the perpendicular direction.
The E c measurement for thermal spray ceramics is difficult to execute because of the limited coating thickness and the brittle nature of the coating. There are different methods to measure the coating stiffness and most relate to the coating stiffness parallel to the substrate. Elastic modulus in thermal spray coatings can be categorised into destructive and non-destructive test methods, Table 12.
Compilation of coating stiffness measurement techniques
The two common techniques used by researchers to obtain elastic modulus values of thermal spray coatings are by the indentation 164 and flexural bend tests, 276 which are the first two methods presented in Table 12. These techniques are used due to the simple specimen preparation procedures as well as the ease of executing the experiments and calculations. Another notable test that provides in-situ measurement values is the cantilever beam test 117,190 that tracks the curvature profile of a thin substrate during the thermal spray process.
Indentation methods to measure modulus
The indentation test of thermal spray coatings undergoes the same procedure as a conventional indentation hardness test. The fundamental principle is based on the resistance of a solid material against the penetration of the indenter under load. An elastic–plastic field develops during the indentation process and the deformed coating is comprised of reversible, or elastic; and irreversible, or plastic, behaviour.
The Marshall et al.
223
method to calculate modulus assumes elastic recovery of the in-surface dimension of a Knoop indentation. Elastic modulus was hence determined by measuring the major and minor diagonals of the Knoop indent on the sample. In the fully loaded state, the ratio of the diagonal dimensions, a (major) and b (minor) of the Knoop contact area was defined by the indenter geometry, a/b = 7·11. Elastic recovery during the unloading cycle reduced the length of the diagonals and indentation depth. The reduction in length was evident for the minor diagonal, b′, while the major diagonal change, a′, was negligible. Therefore, on modelling the Knoop indent as an elliptical hole subjected to uniaxial stress, the relationship of the displacement can be summarised as follows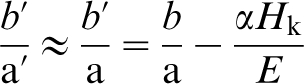
The elastic modulus, E, is derived by rearrangement of equation (7).
The alternative to the Marshall method is the Oliver and Phar method
222
that used depth sensing indentation measurements. In this method, the applied load P, and penetration depth, h
i, curve are recorded simultaneously for the complete loading and unloading cycle. Different sharp indenter tips (i.e., Vickers and Berkovich geometries) and spherical indenters can be used and the apparent elastic modulus of the indenter specimen system (also known as reduced modulus, E*) can be defined as

Rearranging for elastic modulus, E
The characteristic material properties of the indenter, E in and v in, can be obtained from the equipment manufacturer. The use of the Oliver and Pharr method 222 requires knowledge of Poisson’s ratio for the thermal spray coating. However, Poisson’s ratio values have not been determined widely for thermal spray materials and are often assumed to follow those of bulk dense materials that range between 0·20 and 0·30. Poisson’s ratio values for thermal spray materials are discussed further in ‘Poisson's ratio of thermal spray coatings’ section.
The size of the indent relates to the difference in measuring the elastic properties of the consolidated coating microstructure or the individual splats. Nano-sized indentations are most likely related to the local splat properties of the sprayed coating since the indents are sufficiently small to probe the individual splat. Local material phases and their elastic properties within a splat can be measured but the effects of micrometre-sized pores and cracks are not measured.
Thermal spray coatings are more appropriately measured with the use of micrometre-sized indents. Conventional microindentation will result in impressions that span across several splat layers, various void morphologies and the crack network. An appropriate indentation load must be selected that does not cause excessive cracking or localised densification of the coating. 277 The resulting micrometre-sized indent is, therefore, considered a more direct representation of the elastic and plastic mechanical responses of a thermal spray coating. It is cautioned that the interaction of indenter geometry with the microstructure under investigation must be considered when interpreting or comparing nanoindentation and microindentation results.
Bending test methods to measure modulus
The flexural test method can be used for either coated substrates or free standing coatings, in either the tension or compression modes. Producing free standing coatings can be arduous and the following discussion applies to flexural testing on a coating that has been sprayed onto a substrate.
The major difference between three-point and four-point flexural tests is the location of the bending moment. While three-point bending can be performed, the disadvantage is that there is a linear variation of the bending moment from a maximum at the loading point to zero at the two supports. This load pattern predetermines the failure location in the tested thermal spray coating; i.e., the failure locus is positioned under the loading nose.
The four-point bending method allows for uniform bending moment distribution between the two inner loading noses. In this case, the thermal spray coating fails at its weakest point within a large volume of the sample. In other words, four-point bending is able to measure the structural weaknesses within the coating loaded between the inner load noses and is a preferred test method for measuring thermal spray coating strength.
Nonetheless, the elastic modulus via the flexural method is determined from the measurement of applied force and sample deflection curves. There are mechanics of materials approaches that can be used for calculations. For three-point bending, the flexural elastic modulus of a beam under loading is related to the deflection w measured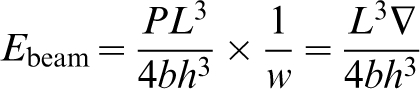

The formula for the flexural elastic modulus of a beam under four-point bending requires calculations that depend on the location of the loading span. There are 2 commonly adopted configurations, (i) the loading span is 1/3 of the support span (i.e., a = b), or (ii) the loading span is 1/2 of the support span (i.e., 2a = b). The deflection is related to two loads acting simultaneously and E
beam can be calculated by applying the principle of superposition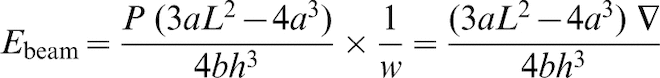
The calculation for the 1/3 support span configuration is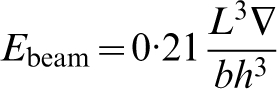
The calculation for the 1/2 support span configuration is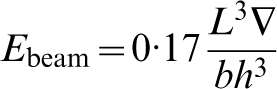
The coating modulus is deconvoluted from the beam modulus by applying the rule of mixtures between the thermal spray coating and substrate. The elastic modulus of the thermal spray coating can be calculated from the following equation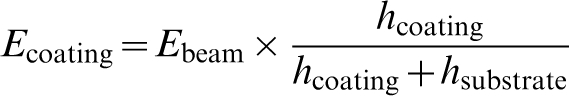
The use of equation (16) is valid for both modes of flexural bending and has provided estimates for the coating elastic modulus. 281
A second method is derived from a mathematical relation of the bending mechanics of a bi-material beam. For flexural testing, the entire coated specimen bending modulus, E
beam, is expressed by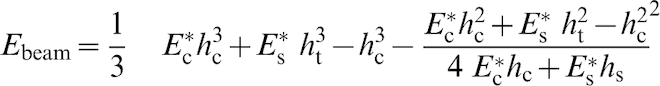
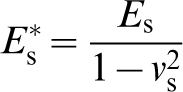
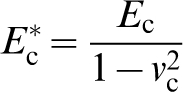
The elastic modulus of the substrate, E
s, can be predetermined by conducting a bending test on an uncoated calibration coupon. The apparent modulus 
The methods presented above are generally employed in cases for the flexural testing of a thermal spray coating–substrate system. Different variants of the test orientation 278,292 and calculation methods exist but are not covered here.
The elastic moduli of thermal spray coatings depend on the concentration, shape, continuity, and the spatial distribution of the different phases in a composite or multi-phase coating. Consider the simple case of a composite comprised of two elastically isotropic phases, wherein the applied load causes equal strains in each of the phases at all times. In the case of a two phase structure, the overall composite stress is the sum of the stresses carried by each phase. The composite modulus is the weighted average of the moduli of two constituents
280

The subscripts represent the elastic modulus of the particular phase and vol is the volume fraction of that phase. Equation (20) is applicable to thermal spray coatings in which multi phases often exist within a coating microstructure due to the rapid melting and quenching of splats. This physical effect accounts for the differences in elastic moduli of coatings with similar chemical composition but processed by distinct thermal spray parameters that could alter the proportion of metastable phases.
Reported literature elastic modulus values for thermal spray coatings are presented in Table 13. A comparison of these values reveals that although indentation methods were often employed, these tend to exhibit higher elastic modulus readings compared to other methods. This is probably attributed to indents that are most likely placed in dense regions of the coating to enable a well-defined deformation for measuring purposes. Subsequently, the coating stiffness values will appear high since the test is measuring a sample region where the void content is low. This example highlights the subjective nature of the indentation technique that may present large errors if applied inappropriately.
Compilation of elastic modulus values of thermal spray coatings
APS: atmospheric plasma spray; HVOF: high velocity oxygen fuel spray; CS: cold spray; FS: flame spray; TWA: twin wire arc.
In addition, thermal spray coatings also perform differently with respect to the load direction; coating stiffness in compression is usually higher than that measured in tension. 277 Under compressive stresses, the elastic closing of the pore and crack network tends to cause a gradual decrease of the microcrack density or increase in coating density. However, under tensile stresses, there is a coalescence of these microcracks; and such inelastic processes reduce the effective coating elastic modulus. 294
Models to calculate modulus
The methods to calculate the elastic modulus of the coating are derived, mostly, from the literature on dense sintered materials. Prior knowledge of structural features such as splat dimensions, degree of inter-lamellar bonding, porosity type and distribution are required for their application to thermal spray coatings.
For instance, porous materials can be considered as two phase structures, whereby the second phase is the void network; i.e. E = 0. The elastic modulus of this microstructure was found to conform to an empirical relationship such as
Appropriate models encompassing the effects of the orientation and shape of voids on the elastic value of thermal spray coatings have been discussed by Nakamura et al. 231 and Sevostianov et al. 108 These models were effective in describing the anisotropic character of thermal spray coatings. By adapting these models, Kroupa et al. 294 modelled coating properties as a function of (i) globular pores, (ii) inter-splat horizontal pores/cracks, and (iii) intra-splat vertical cracks.
For instance, within a representative volume element V of a thermal spray coating there are N randomly distributed spherical pores of radii R
k and the coating porosity P
s is given by
According to this model, cracks contribute to porosity P. The family of horizontal cracks and vertical cracks each have unique representative functions.
295
For a family of approximately N
3 circular and randomly distributed horizontal micro-cracks of radii r
3k their scalar crack density p
3 is
The p
3 function can be used to represent the crack network parallel to the substrate surface, which mimics imperfect bonding between splats along the interface. Similarly, for a family of approximately N
1 circular and randomly distributed vertical micro-cracks of radii r
1k the scalar crack density p
1 is
The microstructural characteristics of thermal spray coatings with respect to anisotropy of the elastic moduli in the in-plane E
ip and through thickness E
tt directions are expressed as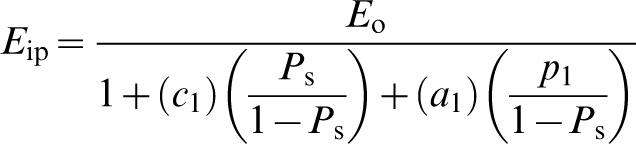
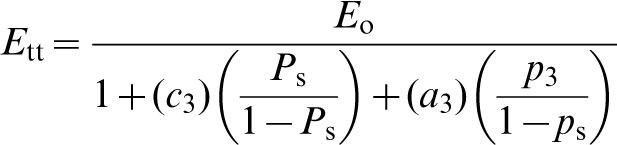
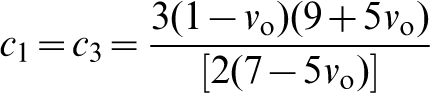
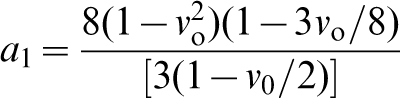
It can be deduced from these equations that coatings with the same porosity levels (P s) and scalar crack density values (i.e., p 1 = p 3) may exhibit anisotropic behaviour with respect to the two-dimensional elastic moduli, as shown in Fig. 21. The net effects of void size and shape dependencies are reflected in the ratios of its elastic moduli E ip/E 0 on p 1 and E tt/E 0 on p 3.
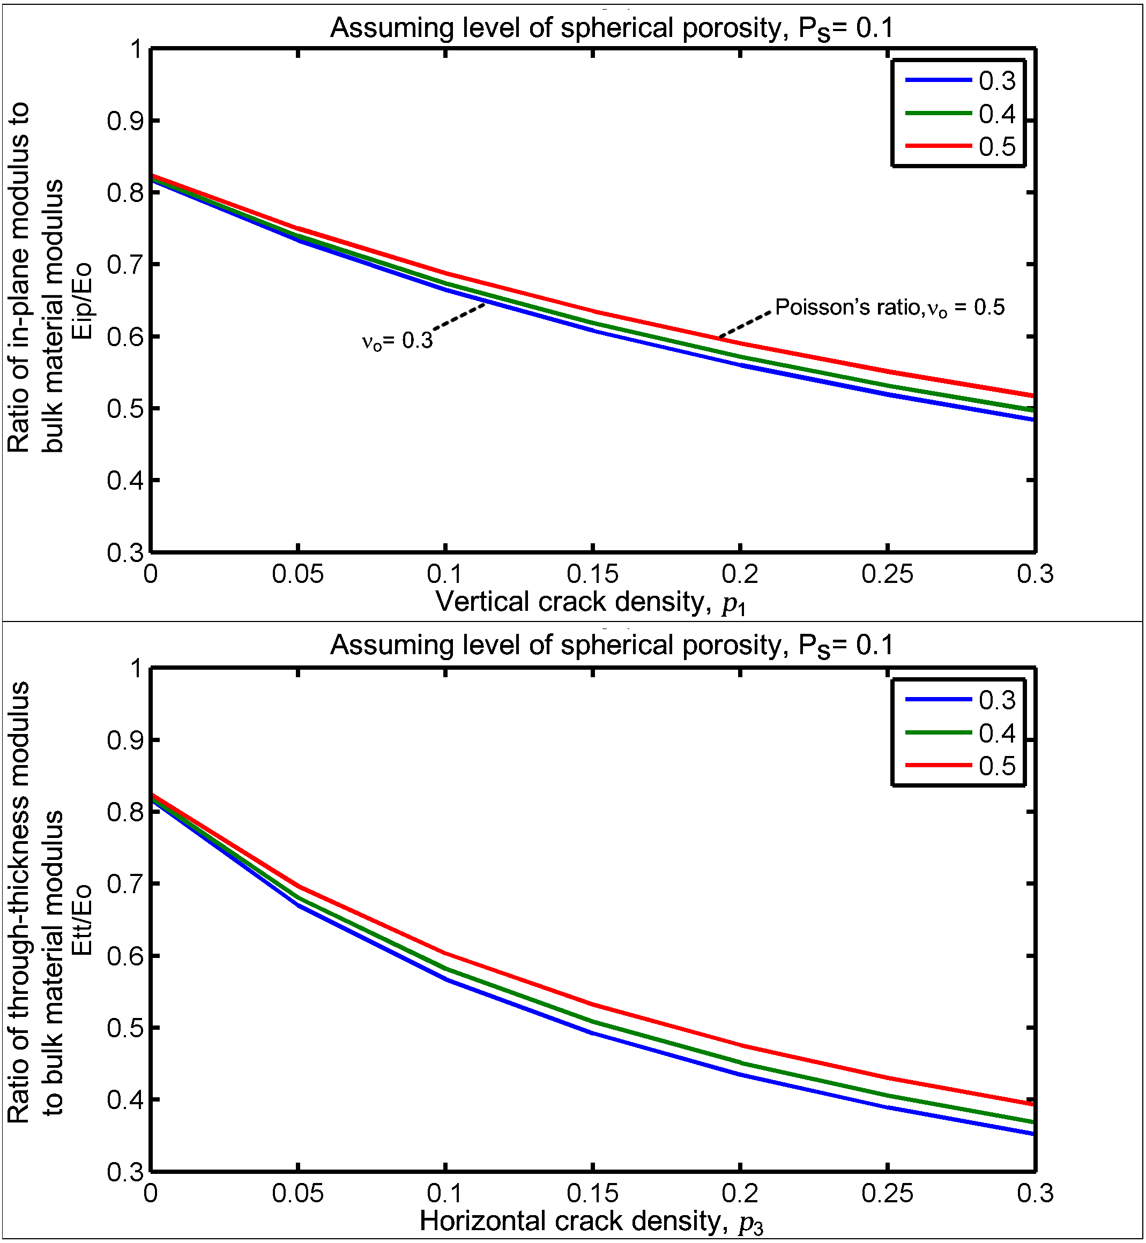
Graphic plots of equations (26) and (27) to show the ratio of coating modulus with respect to the intrinsic modulus. A constant volume of spherical pores of 0·1 is assumed. The levels of vertical and horizontal cracks are plotted on the x-axis. The variation in Poisson’s ratio is represented by each individual line
Another theoretical model of the relationship between the coating elastic modulus and structural parameters was proposed by Li et al. and McPherson et al. 271,296 It was assumed that when a load was applied perpendicular to the deposit plane, then the stress would be transferred from one lamella to the other through the bonded interface area. Under such loading conditions, lamellae would experience tension at the bonded interface area and bending at the non-bonded regions. Thus, neglecting the effects of vertical cracks, this analysis showed that the elastic modulus of an idealised thermal spray coating perpendicular to the coating plane consisted of two components. These being:
The localised elastic deformation at bonded regions between lamellae, which was directly proportional to the bonding ratio or fractional contact area between lamellae.
The bending of lamellae between bonded regions, which became significant for a bonding ratio of less than 40% and depended strongly on the ratio of the mean dimension of the individual contact regions to the mean lamellar thickness.
Using circular plate theory for an idealised microstructure consisting of the stacking of micrometre-sized lamellae; the Young’s modulus in the through thickness direction, E
tt, can be determined as
Where 2R is the diameter of the single splat, 2a is the size of the bonded region, δ is the mean lamellar thickness and α is the bonding ratio between lamellae. The term f(β) is a function of the interface bonding ratio. There are two components of elastic strain for the coating under tensile stress; one arising from localised elastic strain at regions of ‘true’ contact between lamellae and the other arising from elastic bending of the lamellae between the contact regions.
The modelling of micro-cracks as a distribution of flat hollow rotational ellipsoids as shown in Fig. 22 should not be interpreted as the actual micro-crack distribution. Physically, the inter-splat boundary structure exhibited regions of good bonding, surrounded by interconnected non-bonded regions of complex shapes. Similarly, ignoring micro-crack formation to achieve an idealised thermal spray microstructure is not experimentally possible. Nevertheless, the models developed can be considered as useful theoretical treatments, to explain the low values of Young’s moduli and elastic anisotropy of thermal spray deposits.
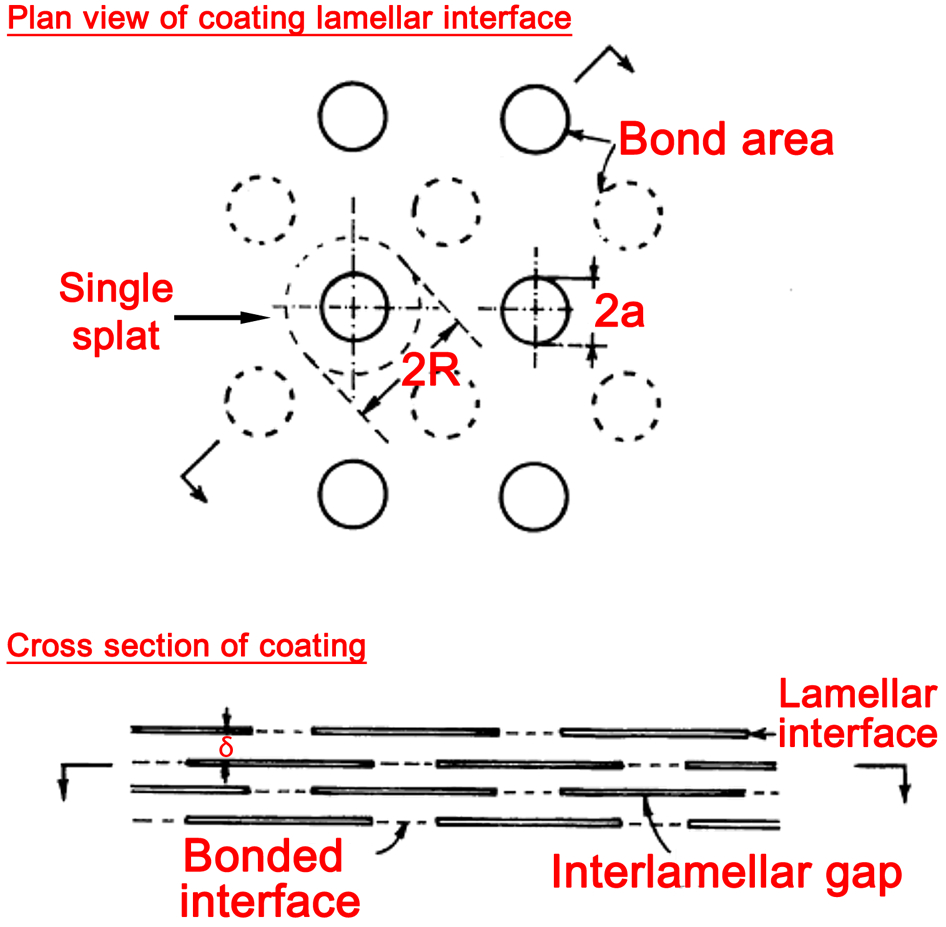
Theoretical model of the idealised microstructure in relation to Li’s model 271
Fracture toughness of thermal spray coatings
Fracture toughness measurements indicate the stress required to propagate a pre-existing flaw. Thermal spray coatings have pre-existing cracks and pores that can individually or collectively serve as crack initiation zones and stress concentrators. Fractographic analysis of thermal spray coatings 297 has found that the prime mechanisms of crack propagation are by intra-splat cracking and inter-splat de-cohesion. These were followed by interlinking of pores and cracks, splat sliding and pore compaction. Formation of secondary cracks and crack bifurcation led to a significant increase in fracture surface area. Therefore, the fracture toughness of a thermal spray coating is a measure of the residual strength of a microstructure under the influence of its void network. The importance of fracture toughness on the durability of APS YSZ coatings has been highlighted by Darolia et al. 131
The Griffith concept
The fracture mechanics approach for assessing thermal spray coatings is based on linear elastic fracture mechanics (LEFM) that was pioneered by Griffith. 298 The Griffith theory indicates that the fracture work per unit crack extension at the onset of unstable fracture is balanced by the strain energy release rate from the surrounding elastically strained material. In other words, the fracture zone absorbs a large amount of additional energy and this must be balanced by the energy required to create a new fracture surface. 237,299,300
In particular, the ‘strain energy release rate concept’ will be introduced to further clarify the quantity of energy released from a fracture. Two terms need to be defined:
The strain energy release rate, G, is the quantity of stored elastic strain energy released due to the extension of a crack advancing by a unit area.
The critical strain energy release rate, G c, is the component of work irreversibly absorbed in local plastic flow and cleavage to create a unit of fracture.
The condition for spontaneous fracture is reached when the strain energy release rate, G equals G
c. The mathematical relationship relating the strain energy release rate for the crack tip is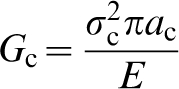
The problem can also be formulated in terms of the concept known as ‘stress intensity’, leading to the terms of (i) stress intensity factor, K, (i.e., K
I for plane stress) and (ii) critical stress intensity factor, K
c, (i.e., K
Ic). The quantities such as K
c and K
Ic are commonly referred to as the material fracture toughness. Linear-elastic fracture toughness of a material in plane stress or plane strain, K
Ic, is related to G
Ic and the material Poisson’s ratio, v
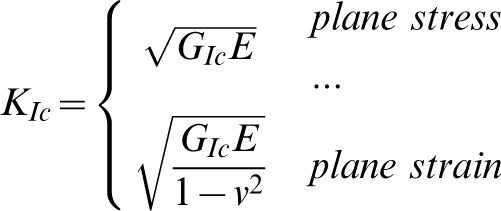
The equations (33) and (34) can be rewritten to describe the tensile stress that corresponds to initiating a crack of length a
c
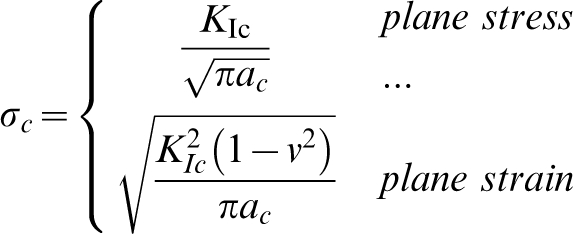
Application to thermal spray coatings
For thermal spray coatings, the σc from the above equation relates to the strength of the microstructure of the sprayed material under the influence of the pore and crack network. 268 It is shown in Fig. 23 that the initial crack a 0 grows to the critical crack length a c for coating failure. The coating elastic modulus, E, depends on the porosity and contact between the lamellae. Therefore, G Ic would also depend on these microstructural features because a crack can propagate between areas of weak contact within the splats. In other words, the fracture strength of a coating is related to its microstructure by E and G Ic. The largest pores or micro-cracks produced during spraying would be expected to act as fracture initiating defects 268 and, thus, influence strength through a c.
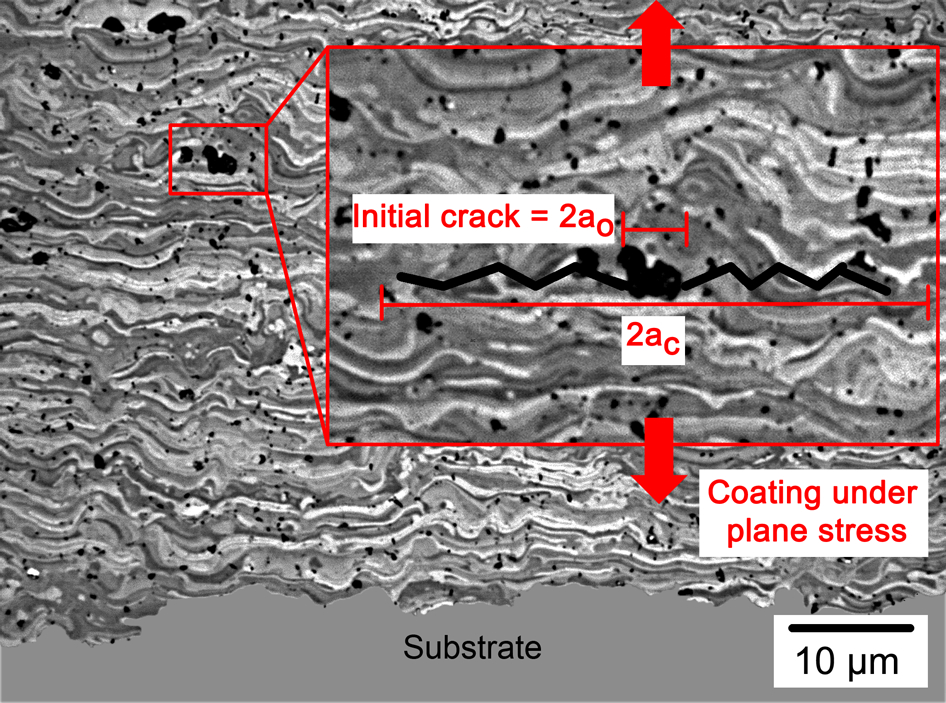
Illustration showing crack growing from an initial crack length to a critical crack length. An inter-splat boundary has been overlaid onto this image to indicate potential fracture initiation sites
The focus of discussion on fracture toughness has been on plane stress loading or fracture in ‘mode I’. The subscript ‘Ic’ denotes ‘mode I’ crack opening under a normal tensile stress perpendicular to the crack. Other modes of fracture, Fig 24a , include the shear (mode II) or the tearing (mode III). However, thermal spray ceramic coatings typically exhibit a much higher compressive strength than tensile strength; therefore, they do not fail in shear modes under loading normal to the coating surface. That is KIIc and KIIIc are much higher than K Ic. 299 For this reason, the testing of thermal spray coating fracture toughness has been limited mostly to ‘mode 1’ or determining K Ic or G Ic, 238 although ‘mode 2’ fracture studies have been performed. 301 The complex splat interactions also dictate the crack path. As depicted in Fig. 24b , the initial crack, a 0, can propagate through defects within the coating.
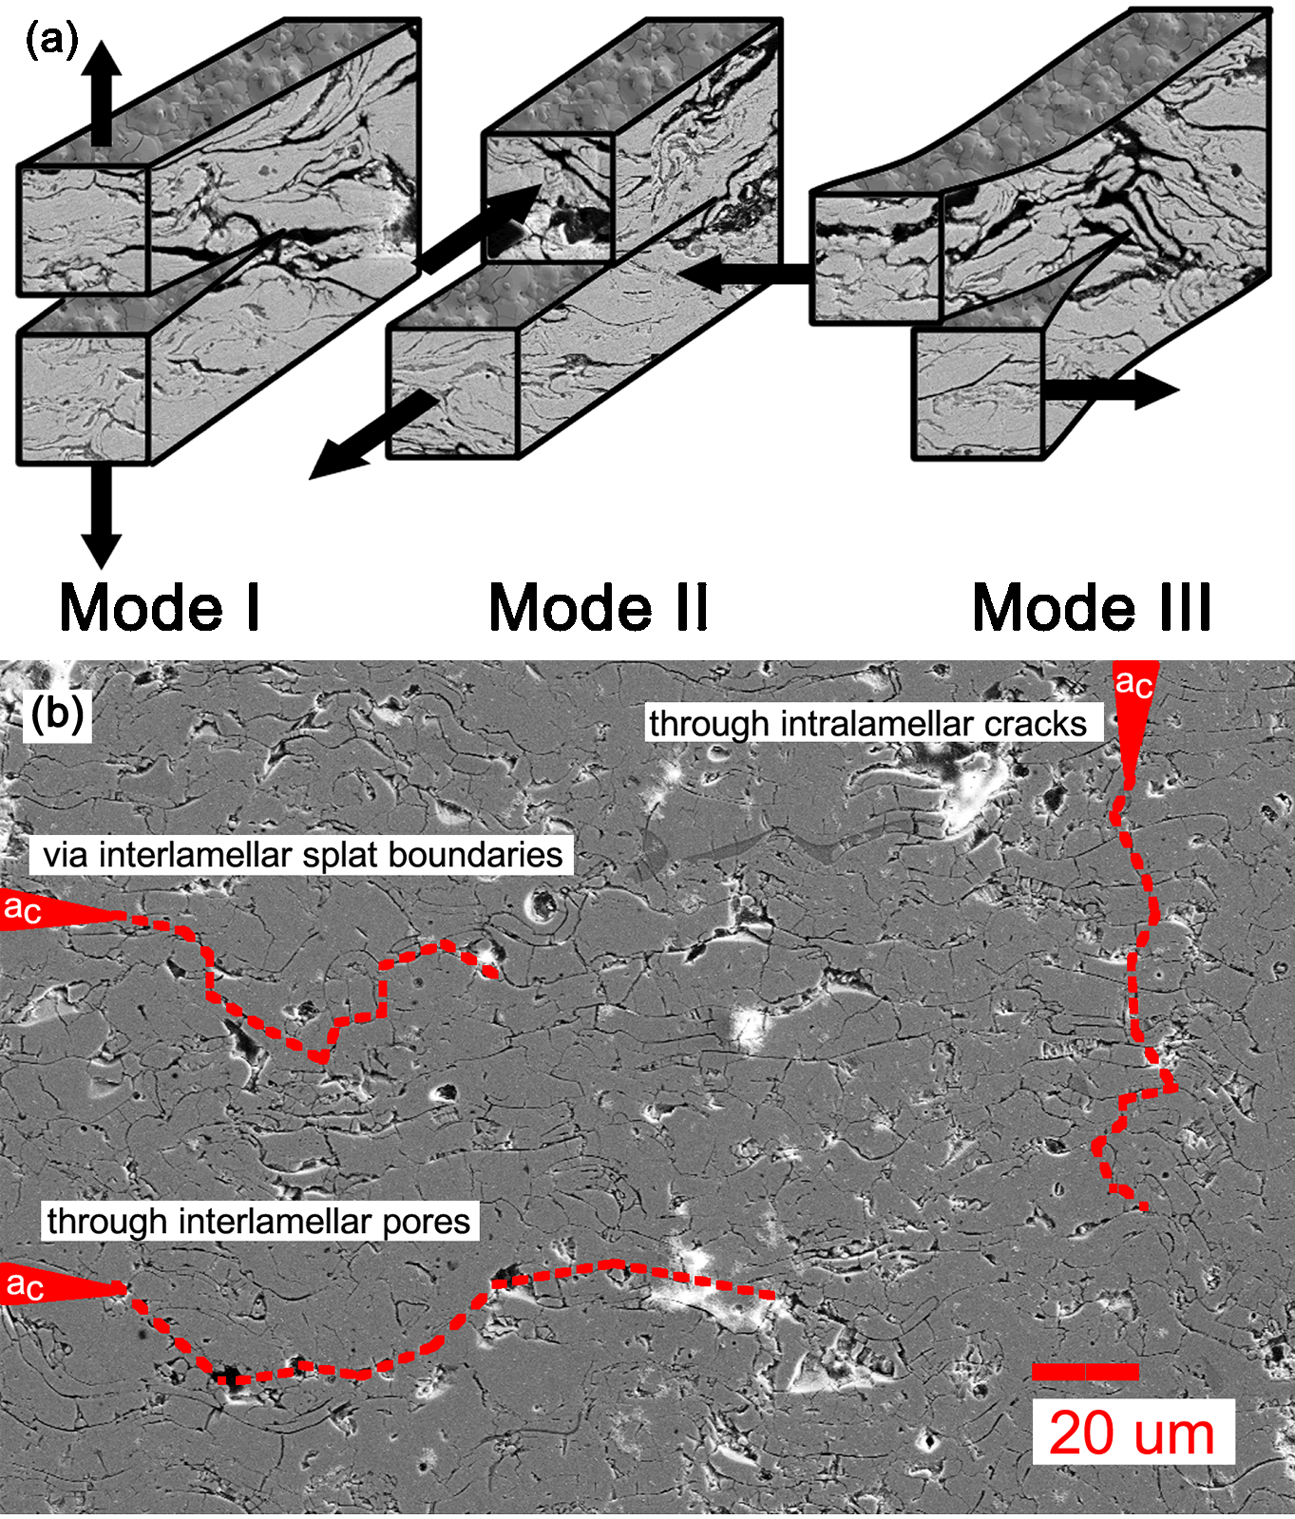
a Possible fracture modes for thermal spray coatings. b ‘a c’ represents the initiation cracks. Three potential cracking mechanisms are suggested
The methods to determine fracture toughness has been detailed by Lin and Berndt 237,238 and include (i) the double cantilever beam (DCB) test, (ii) the double torsion test, (iii) a flexural bending test, (iv) the scratch test, (v) the indentation test method, and (vi) the tensile test. Table 14 compiles several of these methods and identifies the related quantity of measure, KIc or G Ic.
Compilation of fracture toughness testing methods for thermal spray coating
The locality of measurement is determined by the fracture path of the specimen. By controlling the locus of fracture, it is possible to carry out fracture toughness tests for either the coating–substrate interface or within the coating structure itself. One example is the DCB test, in which carefully orientated grooved edges are machined during the specimen assembly. 237 The DCB testing of plasma sprayed alumina coatings measured values of G Ic = 10–15 J m−2 for adhesive and G Ic = 16–25 J m−2 for cohesive failures. 237 The preference for fracture at the coating–substrate interface during four-point bend methods implies that fracture toughness values reflect the microstructure’s interface strength. Modified four-point bend measurements on APS YSZ coatings have shown that the interfacial fracture toughness 304,306 is about G Ic = 17–50 J m−2 but can increase to about ∼120 J m−2 after accounting for sintering effects after high temperature exposure. 306 Similar values for DCB testing of APS YSZ coatings, G Ic = 20–80 J m−2, have been obtained by Heintze and McPherson. 309
The TAT data are a measure of coating fracture; hence it is possible to correlate the TAT results to the fracture toughness of thermal spray coatings. The TAT geometry can be considered as a bar with circumferential cracks; therefore, permitting a fracture mechanics interpretation of the adhesive/cohesive strength of the coating. Berndt
243
proposed that the tensile strength can be transformed into fracture toughness by the relationship
310
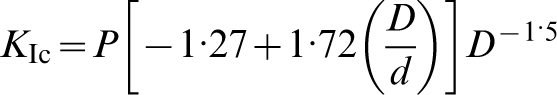
Indentation methods
Fracture toughness measurements for thermal spray coatings can be performed by the indentation method. However, it must be pointed out that the location of the indent determines the region of the microstructure that is measured. Importantly, the coating fracture toughness should not be confused with its interface fracture toughness. Thus, the interface fracture toughness refers to indentation along the coating–substrate interface. 216 On the other hand, an overload indentation test measures an average fracture toughness of the coating that is not localised to a specific microstructural feature.
Failure is most likely to occur along the interface between the bond coat and substrate interface for the majority of fracture toughness measuring techniques. If a particular feature of a coating microstructural volume is the artefact of interest, then crack propagation must be deliberately controlled to cause the specified fracture mode. For the DCB test, 311 a groove can be placed within the coating to promote cohesive failure. Similarly, Vickers indents 109 may be placed within the microstructural volume of the coating to obtain the fracture toughness of this specified element without the influence of the substrate.
The difference in interface fracture toughness and coating fracture toughness is highlighted in Fig. 25. The indentation fracture toughness of a thermal spray coating microstructure can be calculated by several methods. The methods of (i) Lawn et al.,
109,312
and (ii) Niihara et al.
307,313
are listed below:

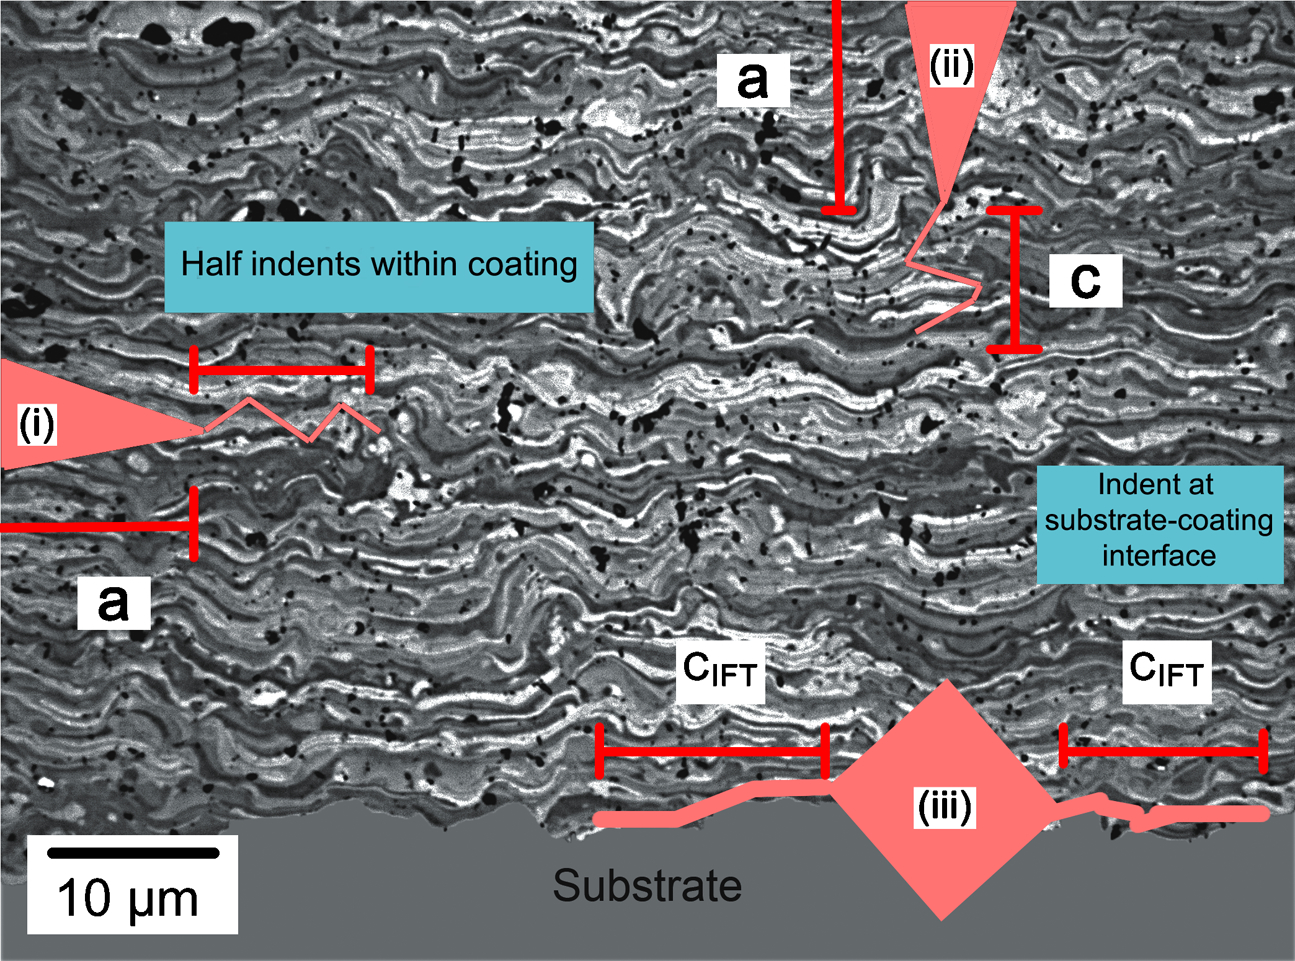
‘a’ refers to the diagonal length and ‘c’ is the total crack length; (i) Parallel cracks within the coating lamellae; (ii) perpendicular cracks within the coating lamellae; (iii) crack along the coating–substrate interface
Chicot and coworkers
216
have investigated the interface fracture toughness. They found that for a given coating and substrate couple, there exists a load that is independent of the coating thickness and which corresponds to the cracking ability of the interface. The Vickers indent was deliberately placed along the axis of the substrate–coating interface, inducing semi-circular shaped cracks localised along this interface. The measurement of the crack formation was proportional to the substrate–coating interface fracture toughness values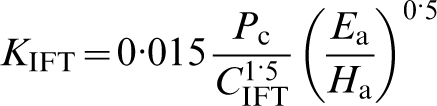
The cracking behaviour of a coating is influenced strongly by its anisotropic microstructure. Therefore, the orientation and placement of indents must be appropriately considered for the indentation fracture toughness testing of thermal spray coatings.
It was mentioned that the elastic modulus of thermal spray coatings was lower than that of the bulk material because of its porosity network and diminished contact area that results from splat overlays. Similarly, the effective fracture surface energy, (G c)eff, would be lower than that of the bulk material G c since a crack would pass from one region of good contact to another.
McPherson et al.
268
proposed a simple model to describe the effective strain energy release rate in a typical thermal spray microstructure. Since (G
c)eff was related to the bonding ratio between the neighbouring splats, fracture would not be expected to occur by propagation of a single crack in a coating. The mathematical relation is: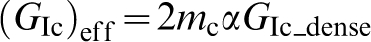
Poisson’s ratio of thermal spray coatings
Compression of material in one direction leads to expansion in the other two orthogonal directions. Conversely, tensile loading leads to contraction in the orthogonal directions. The ratio of the relative contraction/transverse strain under loading is known as Poisson’s ratio (v).
It has been noted that the evaluation of coating bond strength, crack growth rates, and coating stresses during in-service loading requires accurate values of the coating Poisson’s ratio. In addition, Poisson’s ratio of a thermal spray coating depends on its unique lamellar microstructure and, therefore, can vary greatly with spray parameters. The range of Poisson’s ratio that has been assumed for most thermal spray coatings lies between 0·20 and 0·30. 302,305 Measurements of Poisson’s ratio for thermal spray coatings are rarely conducted; thereby bringing these assumptions into question.
The lack of Poisson’s ratio data in the field of thermal spray arises because these coatings are thin and bonded to the substrate. Consequently, it is experimentally difficult to remove the coating and apply conventional uniaxial testing procedures. Substrate removal techniques such as physical sectioning, 283 and chemical etching or high temperature combustion 277 have been employed. Yet, it is quite likely that these post processing steps would damage the coating microstructure. Nonetheless, after the coatings were removed, the specimens were machined to the required specimen sizes and Poisson’s ratio determined; usually by a uniaxial compression or tension test. The compression method has been a preferred test mode since thermal spray coatings exhibit a low tensile strength. The stress–strain curve was fitted by a linear relation through the least-squares fit method, and the slope of the fitted line was equal to the elastic modulus. Correspondingly, the slope of the fitted line with the curve of transverse strain and longitudinal strain was the measured Poisson’s ratio. The measurements of transverse and longitudinal strain were accomplished with strain gauges mounted on the coating. 283
The reported Poisson’s ratio associated with ‘coating-only’ experiments for plasma spray YSZ ceramic coatings range from v = 0·04 (as sprayed) to 0·2 (annealed at 1316°C for 500 h). 277 Plasma sprayed nickel (45 wt-%) chromium coatings averaged a Poisson’s ratio of around v = 0·15. 283 These reported values suggest that the commonly used estimate of v = 0·20–0·30 was inaccurate to describe the influence of spray parameters and post-treatment processes on the Poisson’s ratio thermal spray coatings.
Another method to determine in-situ values of thin films with substrates employed a cantilever beam test that was instrumented with strain gauges. 287 The test consisted of a beam that was clamped at one end and weights applied to the other end. Strain gauges were pre-placed on the coating and substrate surfaces. Readings were taken as the weights were applied. The elastic modulus and Poisson’s ratio of the coating were calculated from the strain gauge data, the dimensions of the specimen, the mechanical properties of the substrate, and the applied bending moment. The analysis method used the equations of equilibrium for bending moments and forces at the gauged section. The Poisson’s ratio for HVOF sprayed tungsten carbide coatings 287 was about 0·33, while for plasma spray YSZ coatings 287 it was around 0·181. However, this method has not been universally adopted by researchers.
There has been little experimental work to understand the unique transversely isotropic microstructure on Poisson’s ratio measurements. The measured Poisson’s ratios relate specifically to the test orientation in the prior discussion. That is, uniaxial compression or tension loading was applied on the plane section of the coating while the coating cross-sections were measured for transverse and longitudinal strain. The above test orientation would be appropriate for the majority of thermal spray applications. However, if the test orientation was altered then the strain measurements would likely be dissimilar; thereby implying that the Poisson’s ratio is an anisotropic material property.
Reporting statistical concepts for thermal spray coating testing
Robust calibration and well-planned experiments have allowed high accuracy in the measurement of the mechanical properties of thermal spray coatings. Yet, data variability within the experimental results gathered from the mechanical tests used to assess thermal spray coatings is not uncommon. The following section examines the importance of using statistical methods to analyse data variability.
The numerical average and coefficient of variation
A customary practice to account for variability is to present the data as a statistical mean (μ) along with the standard deviation (σ) of the mean. This statistical treatment accounted for the random error, which was related to the uncertainty due to small errors in the assayed values as well as specimen batch-to-batch variability; i.e., the random uncertainty in the experimental process.
Accordingly, the ratio of standard deviation to the arithmetic mean is used to indicate whether the measurement was repeatable; commonly expressed as the coefficient of variation (COV). In probability theory and statistics the COV represents the normalised measure of dispersion of a probability distribution. Distributions with a low COV demonstrate data with low variance. For example, the COV for the TAT data of a typical thermal spray coating, manufactured by a flame or plasma spray process, is 0·23–0·31. 243,314 For microhardness data, the COV of plasma sprayed coatings can range from 0·05 to 0·27 211,212,314 while coatings produced via D-gun® and HVOF have a COV ranging from 0·11 to 0·18. 212,227 Also, as the sample size increases, the COV value decreases.
There is a concern when the COV is large with a sample size greater than 20. Such a data set indicates fluctuations within the microstructure. In fact, it is not possible to obtain a low COV for coatings that exhibit multiple phase compositions randomly distributed throughout the microstructure. The representation of this possible data variability is illustrated in Fig. 26. Random uncertainty was not the root cause for data scatter in this case study. Instead, the expected COV will be high because the data is bimodal. The points were skewed into two separate regions of A and B, which might specify instances such as differences in porosity or phase composition. Moreover, the arithmetic mean of the data set did not reflect this segmentation of data points. Bimodal coating properties have been reported by various authors. 212,315–317
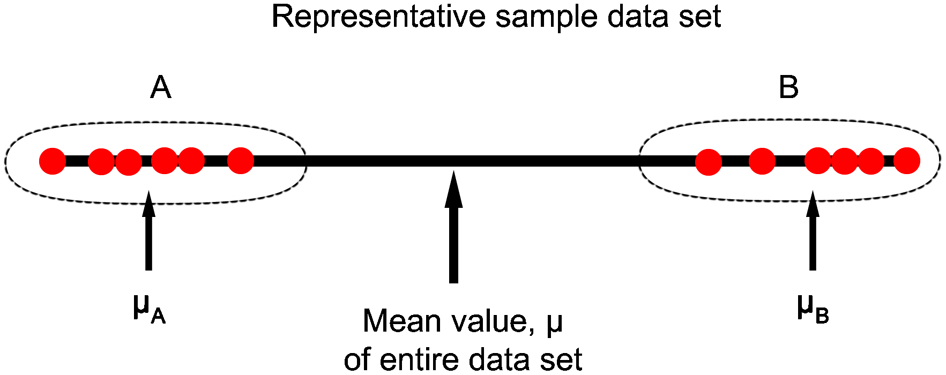
Hypothetical experiment with possible data scattering
Nonetheless, the concept of a singular mean value to describe material properties is deeply entrenched in science and engineering and is necessary for modelling exercises. The relevance of the reported arithmetic mean only becomes statistically significant if there is a method to identify data variability caused by the intrinsic coating microstructure or random uncertainties. Since data scatter could be indicative of anisotropic and heterogeneous behaviour in coating microstructure, it is essential to interpret such information with respect to micrographs that illustrate the porosity and phase composition. That is, a standard statistical presentation of measured values might be misinterpreted, especially when the COV was high.
Probabilistic aspect of ceramic thermal spray coating properties
The study of thermal spray ceramics has been approached statistically and follows the concept of statistical distributions originating from data analysis of brittle fracture in ceramic components. 318 With regard to fracture experiments on ceramic specimens, it indicates that the size of the specimens influences the probability of failure. Similarly, the probabilistic aspect of analysing the mechanical properties of thermal spray coatings can be adopted. The approach was applicable to thermal spray ceramic coatings because fracture also generally initiated from small flaws that are discontinuities in the microstructure. For simplicity, the flaws can be assumed to be small cracks that are distributed in the surface or volume. Thus, strength depends on the size of the largest defect in a specimen, which varies among coatings.
The strength-size effect cannot be explained in a deterministic way using the model of a single crack in an elastic body. Instead, interpretation requires understanding the behaviour of cracks distributed throughout a material. Consequently, it was assumed that many flaws, which behave like cracks, are stochastically distributed in a ceramic material. It was further assumed that cracks do not interact; that is, their separation was large enough for their stress fields not to overlap. This assumption is essential for the following argument and is equivalent to the weakest link hypothesis: i.e., failure of a specimen was triggered by the weakest volume element or by the largest flaw.
A single number cannot describe the strength of a thermal spray ceramic coating adequately. A strength distribution function is necessary and a large number of specimens are required to characterise mechanical properties. By assessing coating mechanical strength data to a known statistical distribution, such as Weibull or Normal distributions, the coating has a certain probability of failure or survival. Researchers have proposed and applied the Weibull theory to the mechanical behaviour of thermal spray coatings. 212,227,311,315
In Weibull theory, the size effect on the nominal strength arises from the fact that large structures have a greater probability of revealing a material element of a critically small strength. The principles of this statistical size effect were proposed by Prof. Wallodi Weibull. 265 He concluded that the tail distribution of low strength values in a large data set, i.e. those data that have a low probability, cannot be represented by any of the previously known distributions. The underlying hypothesis is based on the inception that macroscopic crack growth in one small element of the structure causes failure. Therefore, small representative volumes of the material in the structure interact in the same way as the links of a chain, that is, in a series coupling.
According to Weibull theory, the cumulative probability, Pi
, that a sample will yield at a particular random property value x
i is given by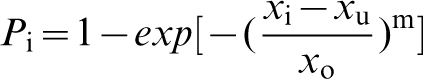
The equation may be presented in the following linear form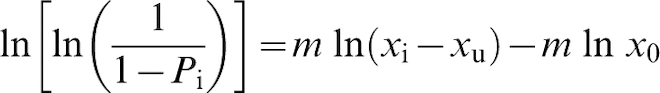
Consequently, two-parameter or three-parameter formulations are available for the Weibull distribution. The three-factor formulation requires knowledge of the threshold parameter. This can be calculated by linear regression of the data set to determine the offset value that provides the best coefficient of determination. 227 However, the two-parameter Weibull formulation usually leads to a more conservative estimate for the component probability of failure and the mathematical treatment is less complex. The two-parameter Weibull formulation is adopted in this work and the calculation method is shown below.
The threshold parameter is set to zero (i.e., x
u
= 0) in the two-parameter Weibull method. To construct the plot, the data is ranked and the value that represents the 63·2% probability is assumed to be x
o. The two-factor Weibull fit is graphed by plotting 
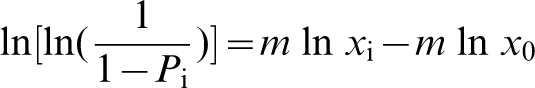
The Weibull modulus (m) can be used to approximate other distributions. For instance, if m = 3·6, then the Weibull distribution approximates the normal distribution. 265 It has been argued that the assumption of setting the threshold value to zero and employing two-parameter Weibull formulation might result in an inaccurate determination of the Weibull modulus. 227 However, the use of Weibull statistics is often constrained to quantitative assessment of data variability and its relation to the microstructure. The Weibull modulus becomes a measure of the distribution of flaws and, hence, describes the variability in mechanical properties of ceramic materials. If the measurements show little variation, then the calculated Weibull modulus will be high and it may be concluded that the physical flaws are distributed uniformly throughout the material. If the measurements show high variation, the calculated Weibull modulus will be low. This result reveals that flaws are clustered inconsistently and the measured data will be generally variable. Accordingly, the reported confidence interval should be calculated from the Weibull distribution parameters instead of the standard t-distribution.
The use of the Weibull distribution over the Gaussian distribution in microhardness testing for thermal spray coatings has been shown to provide detailed information concerning the variability within coating system. 211 The coating microhardness data was highly skewed or broadly distributed and the Weibull distribution has the merit of being a simple way to describe the data. In addition, Lima et al. 315 showed that YSZ coatings of the same composition could exhibit similar values of microhardness (i.e., average and standard deviation) but significantly different Weibull modulus values. The bimodal Weibull distribution found in the microhardness data of the nanostructured YSZ coating suggests the presence of two distinct constituents within the microstructure.
Further work 212,319 also showed that the Weibull moduli of different thermal spray coatings tend to increase with indentation load. This effect arises when a low indentation load is used since there is an increased likelihood of sampling ‘low defect’ regions; whereas using a large indentation load relates to achieving a representative test volume. In other words, as the volume under scrutiny increases, the scatter in the measurement reduces and is reflected in the higher Weibull modulus; although the mean value will be lower. Therefore, it is also relevant to note that the Weibull values of hardness of two or more coatings should be compared only if the coatings were indented at the same load.
Apart from microhardness data, Weibull theory has been applied to other types of mechanical test results such as (i) porosity where m = 2·6–6·2, 320 (ii) tensile adhesion strength where m = 2·4–5·9, 314,321 (iii) elastic modulus where m = 2·3–12·6, 164,273 and (iv) fracture toughness where m = 0·5–0·8. 109
A useful application of the Weibull distribution on thermal spray data is to construct reliability charts that allow prediction of the coating properties at a chosen level of significance, Fig. 27. In this specific exemplar, the YSZ coating adhesion strength, at a 0·5 level of significance, should be approximately 8·55 MPa.
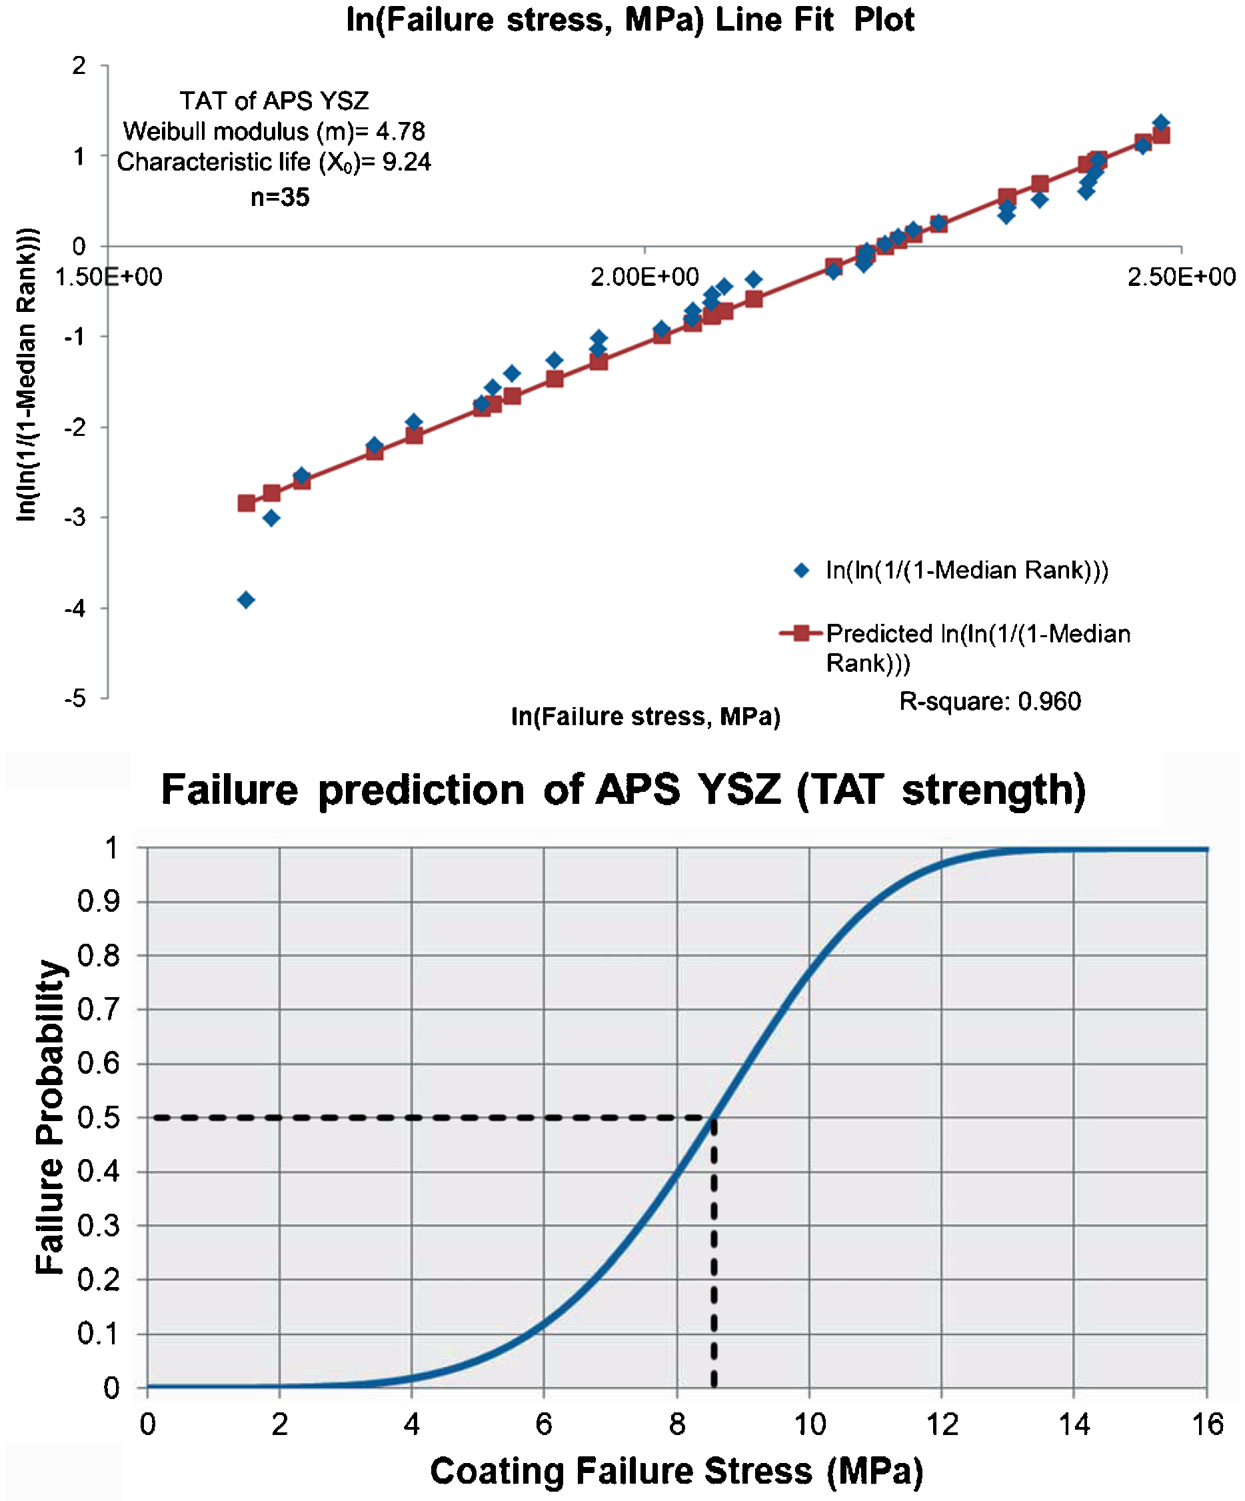
Coating reliability chart based on Weibull analysis of tensile adhesion strength data of plasma sprayed YSZ coatings. 314 An example for 0·5 level of significance is indicated to show a coating failure stress of 8·55 MPa
Other important statistical analysis tools for thermal spray data relate to the ability to compare and identify competing data sets that have similar average values. 212 If there are only two unique data sets, a Student’s t test can be used to assess the statistical significance. 211 If more than two means are compared, then the analysis of variance method (ANOVA) should be employed to account for the variance between observations. 227
Conclusions
The relationships among the topics covered in this review are summarised in Fig. 28. Thermal spray coatings and their mechanical properties are influenced by the fundamental factors of (i) jet temperature, (ii) particle velocity, and (iii) characteristics of the feedstock.
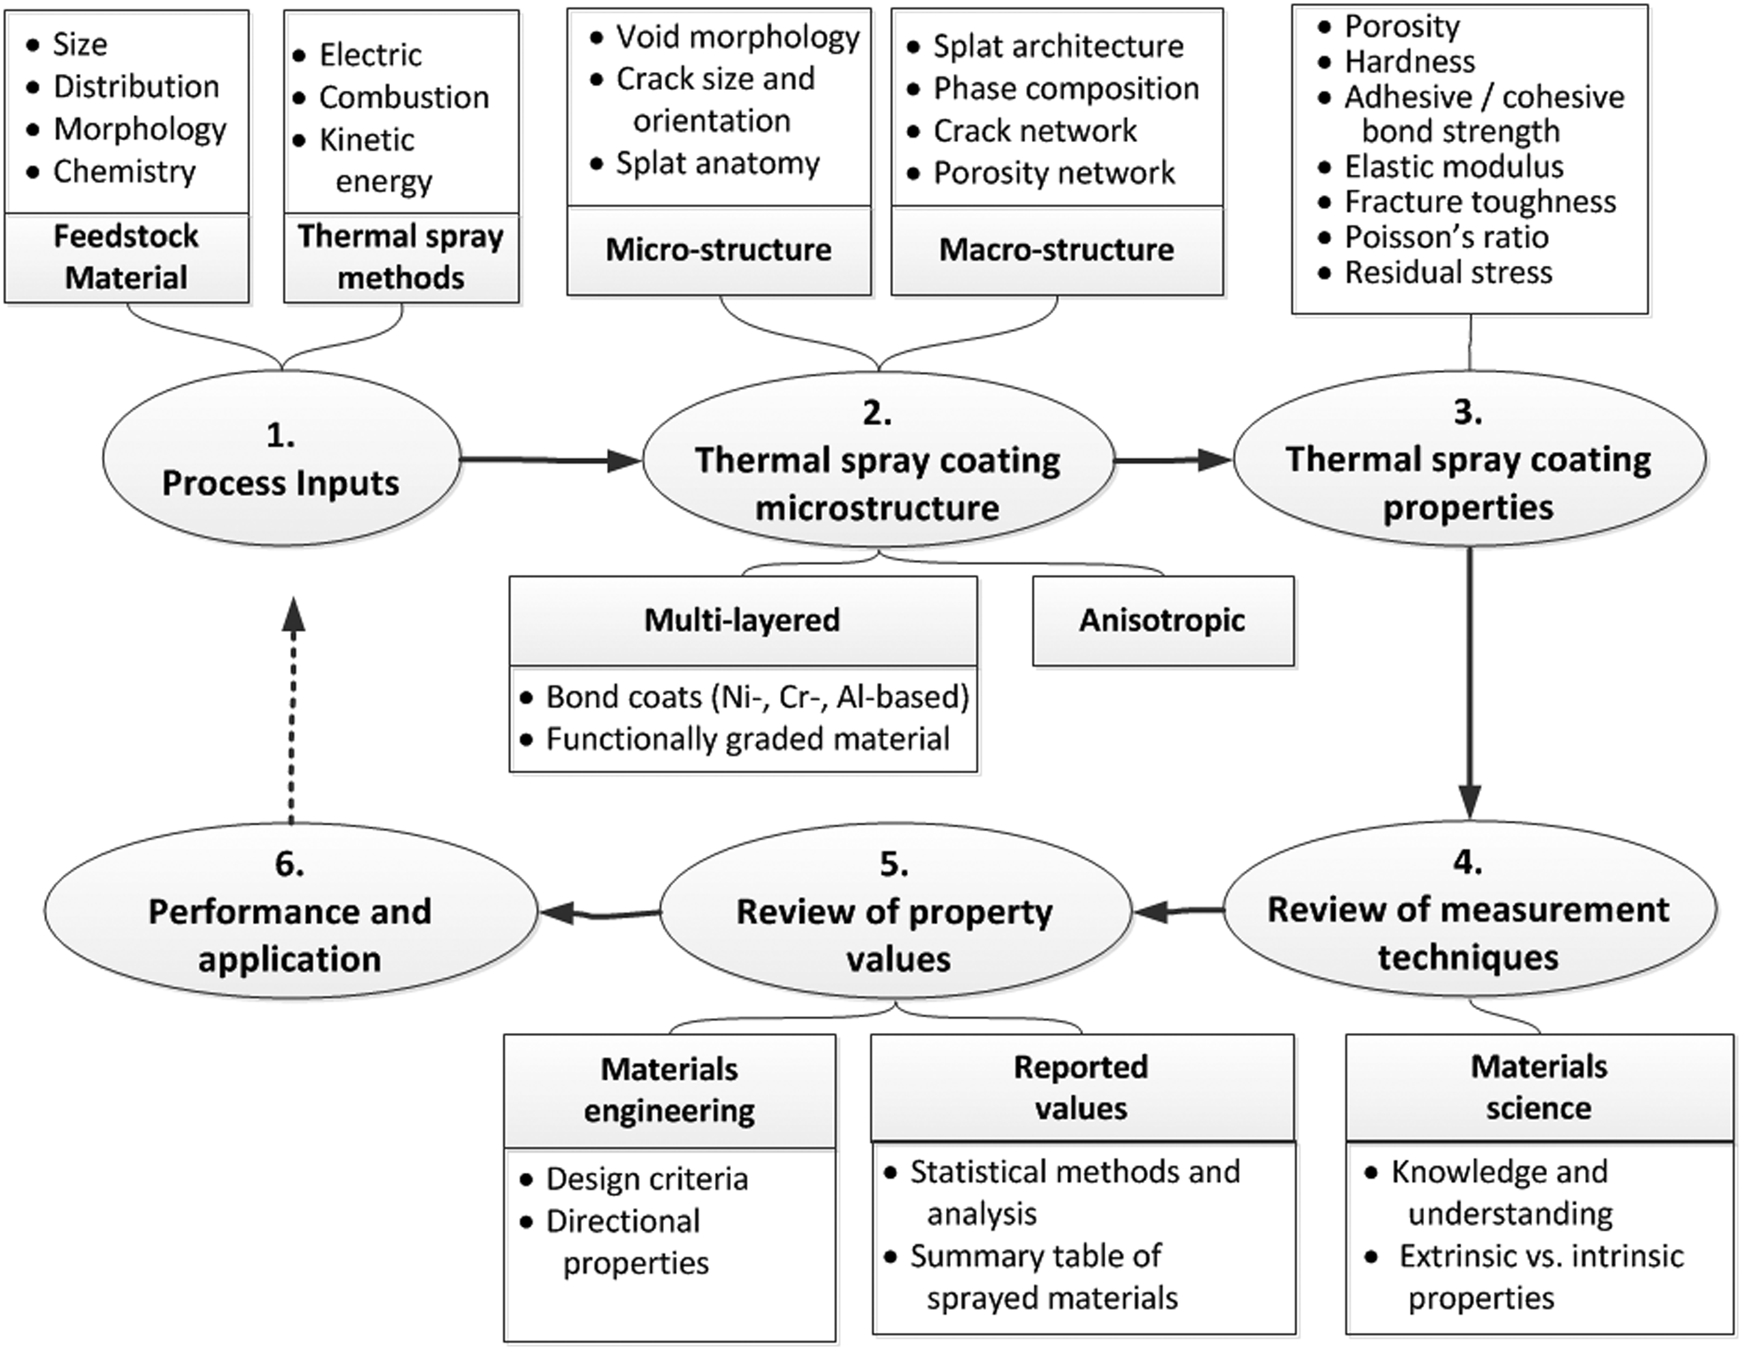
The mutual relationship between thermal spray process inputs, the anisotropic microstructure and mechanical properties
In the selection of powdered feedstock, the starting chemistry is only one of the many criteria. The particle size distribution, flow, bulk density, morphology, and grain size must also be considered. These feedstock characteristics are differentiated by the manufacturing method and have been categorised into charts in this review.
The retrospective review of thermal spray methods suggests that there is a trend of innovation to increase the jet temperature and/or particle velocity. Nonetheless, thermal spray methods can be classified into three broad families: (i) the use of combustion heat sources, (ii) the use of electrical energy, and (iii) the use of gas decompression. Each method has its own merits; but it is common that the spray parameters influence the temperature–velocity distribution of the particles.
Thermal spray coatings are identified by a lamellar microstructure formed from the rapid solidification of impinging molten droplets and cohesion among splats. This structure gives rise to the anisotropic mechanical behaviour of coatings produced via different thermal spray methods since a distinctive splat structure and associated void system is created. This anisotropic characteristic must be noted when applying measurement techniques on the thermal spray coating.
A focussed critique is presented on the respective measurement techniques after critically reviewing the literature. The measurement techniques compiled included (i) porosity, (ii) residual stresses (iii) hardness, (iv) adhesion, (v) elastic modulus, (vi) fracture toughness, and (vii) the Poisson’s ratio of thermal spray coatings.
The measurement of porosity levels in thermal spray coatings have advanced in the past two decades with the adoption of neutron beam, X-ray source and ultrasound-based methods. These traditional methods have been lent from the field of characterising bulk materials. Nonetheless, traditional IA still remains popular but must be applied in accordance to recommended standards, such as ASTM E2109-01. 145
Concurrently, advanced neutron beam, X-ray and laser beam sources have been employed to study the residual stresses in thermal spray coatings. These non-destructive testing techniques often require specific coating dimensions as well as complex mathematical models to resolve the measured results. Adoption of these advanced characterisation techniques for the thermal spray job shop is a steep learning curve. Nevertheless, the understanding of quenching, peening and thermal contraction stresses introduced or built-up during the coating process is critical; especially for a thermal spray coating that bears load. Differentiating between the stress components that contribute to a coating’s overall residual stress can be achieved by using the in-situ curvature monitoring or equivalent methods.
It was found that there is an emerging demand for standardisation within the field of hardness and bond strength testing of thermal spray coatings. An increasing number of national and international test standards for characterisation of thermal spray coatings are available or under development. In particular, the microhardness testing of thermal spray coatings is widely used as a quality control tool in the industry. However, due to the anisotropic architecture of the coating, an indenter’s alignment (i) along the lamellar layers, or (ii) across the lamellar layers can lead to different microhardness results.
In the area of coating bond strength testing, while the standard TAT method and the similar method of stud pull test remain popular, numerous test methods are now available to evaluate the coating bond strength without the use of an epoxy. Methods like the shear load test, the pin and ring test, the scratch test and the laser shock adhesion test remove the ambiguity of epoxy penetration into a porous coating. However, some of these test methods require complex equipment setup as well as empirical modelling relationships to calculate the coating adhesion bond strength. Again, these could be barriers for adoption by the typical coating job shop.
Important properties of thermal spray coatings such as the elastic modulus, fracture toughness and Poisson’s ratio are required by design engineers and researchers to evaluate the integrity of the entire structure or system. It can be difficult to measure such stress–strain relationships in thermal spray coatings due to the inhomogeneous microstructure of the coating and the influence of the void and crack networks. Nonetheless, indentation and bending methods modified from the measurement of bulk material properties have been applied effectively.
The lack of an overall framework for the presentation of mechanical properties highlights a misconception: that is, researchers have focussed on the properties and performance of specific coatings or processes rather than relationships among the entire family of thermal spray coatings. Thus, although there is a vast amount of literature documenting the development of coating materials or processes, the thermal spray field lacks a systematic method that integrates materials chemistry, processing, structure, property and performance. A materials genomic approach, which systematically correlates different properties among all thermal spray processes, has addressed this critical need. 322
Footnotes
Acknowledgement
This work has been supported under a Swinburne University Postgraduate Research Award. The authors acknowledge the support and encouragement of Messieurs Andrew Moore and Brian Dempster.
Dedication: This body of work is dedicated to Mr Richard Moore, a practitioner of thermal spray, who passed away suddenly on 30 June 2013. May he rest in peace.
Absolute particle sizes are presented from the smallest to the largest particle size. However, relative sizes, such as mesh values, are presented in the reverse order; i.e., from the largest to the smallest particle size. As well, a common abbreviation for ‘mesh’ is ‘#’.
The expansion of the acronym ‘HOSP’ is ambiguous in the literature’. For example, ‘hot oven spherical particles’, ‘hollow oxide spherical particles’, and ‘homogeneous special particles’ have been reported. The indicated reference from the patent literature unambiguously indicates that the correct expansion is ‘hollow spherical particles’.
The ‘deposition efficiency’ is determined from spray experiments on a flat or round test coupon that is most likely to be unrepresentative of the practical job. The ‘spray efficiency’, however, relates to the engineering component that is likely to have a complex, 3-D geometry. Thus, the spray efficiency is always less than the deposition efficiency.
The discussion refers to the imprint diagonal to height ratio of 5 for the Vickers microhardness test and 30 for Knoop microhardness test. This should not be confused with the requirements for a macroindentation test. As well, the acronyms of ‘VPN’ and ‘HV’ are used to describe the hardness value determined by a Vickers hardness test.