
Abstract
Frictional sliding plays a fundamental role in the mechanics of ice, on scales small and large. Whether across opposing faces of microcracks within laboratory specimens, across strike-slip like features within the sea ice cover on the Arctic Ocean, or across faults within the crust of icy satellites of the Outer Solar System, sliding of ice upon itself is central to the process of brittle compressive failure. In that regard, ice is similar to rock and to other crystalline materials. This review addresses the role of sliding in brittle compressive failure and then focuses on the nature of friction per se. Both static friction and low-velocity (<0.1ms-1) kinetic friction are described at temperatures from near the equilibrium melting point to as low as -175°C. The corresponding coefficients of friction are discussed in terms of the interaction and deformation of asperities that protrude from opposing surfaces. The coefficients appear to be governed largely by asperity creep at lower velocities and by creep plus localised melting at higher velocities. At still higher velocities (beyond the scope of this review), friction of warm ice is governed by hydrodynamic effects. The review closes with comments on the compressive strength of ice, on the deformation of the arctic sea ice cover and on the tectonic evolution of Saturn's Enceladus.
Introduction
Ice is a rather abundant and multifaceted material. It constitutes a large fraction of the crust of Jupiter's Europa, of Saturn's Enceladus and of Pluto, and on Earth, in the form of ice sheets and glaciers, serves as a reservoir for more than 98% of terrestrial fresh water. Within the Arctic, the sea ice cover acts as a solar reflector and as a barrier to the transfer of heat and moisture from the ocean to the atmosphere and, as such, affects both local and global climate. From the engineering perspective, ice and icing challenge the operation of ships engaged in polar marine transportation and the safety of offshore structures employed in the exploration and harvesting of oil and gas from beneath ice-infested waters. It is a major factor as well in loads experienced by piers, docks and lighthouses situated in cold regions and in the stability of aircraft and the integrity of power lines subjected to freezing rain. As a defence system, walls of ice have been used as barriers to the spreading of contaminants during the drilling of oil shale and, at the time of writing, are being built to prevent the escape of radioactive water from the site of the Fukushima nuclear power plant. On a smaller scale, micrometresized composite walls of ice and porous ceramics can be created through the process of freeze casting of water-particulate slurries and may serve as templates for biomedical devices. As an aid to transportation, ice roads once served as the medium for sliding heavy stones to the Forbidden City; today, they allow heavy vehicles to supply northern communities during winter. Ice serves also as a medium for recreation, through skating, skiing, curling and other activities, and as an agent for cooling both drinks and food. From the scientific perspective, particularly, the mechanical behaviour of crystalline materials to which this review relates, ice in its transparency and relatively coarse microstructure may be viewed as a model material for directly observing with the unaided eye cracks and other deformation features that lead to brittle failure. And on a more human level, ice is occasionally the stuff poetry, music and art.
In this paper, we review critically one aspect of its character; namely, the process of sliding slowly upon itself. As will become apparent, self-sliding is a basic step in brittle compressive failure, which in turn is fundamental to limiting the build-up of environmental loads on vertically sided engineered structures when sheets of floating ice are pushed by wind against their sides. Sliding of ice against ice plays a major role as well in the building of pressure ridges and in the break-up of the winter sea ice cover on the Arctic Ocean. On the extra-terrestrial scale, sliding participates in the tectonic evolution of Enceladus and of other icy satellites and through frictional heating may account for episodic plumes of water vapour mixed with ice that are emitted through faults within Encaladus’ crust.
The paper is organised as follows: Section 2 offers a short account of the relationship between friction and brittle compressive fracture; Section 3 presents the salient characteristic of both static and kinetic friction; Section 4 discusses physical mechanisms and presents new interpretations of the coefficients of friction; Section 5 describes some implications re. ice mechanics; and Section 6 offers a short conclusion. In focusing on friction, the paper expands upon a short treatment of the subject that is given in a recent book. 1
Relationship between friction and fracture: lessons from ice
It is perhaps not obvious that friction and fracture are related. Friction is a measure of resistance to relative movement across an interface, while fracture is the separation into two or more pieces of a body under load. Yet, when cognisance is taken of fracture mechanisms – specifically, of brittle compressive failure – the relationship becomes apparent.
Modern theory holds
2–9
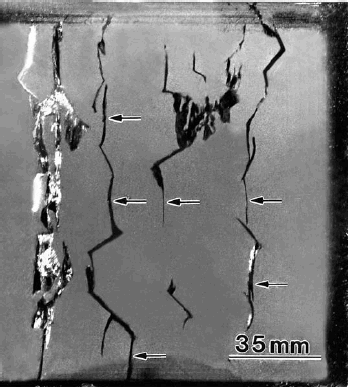
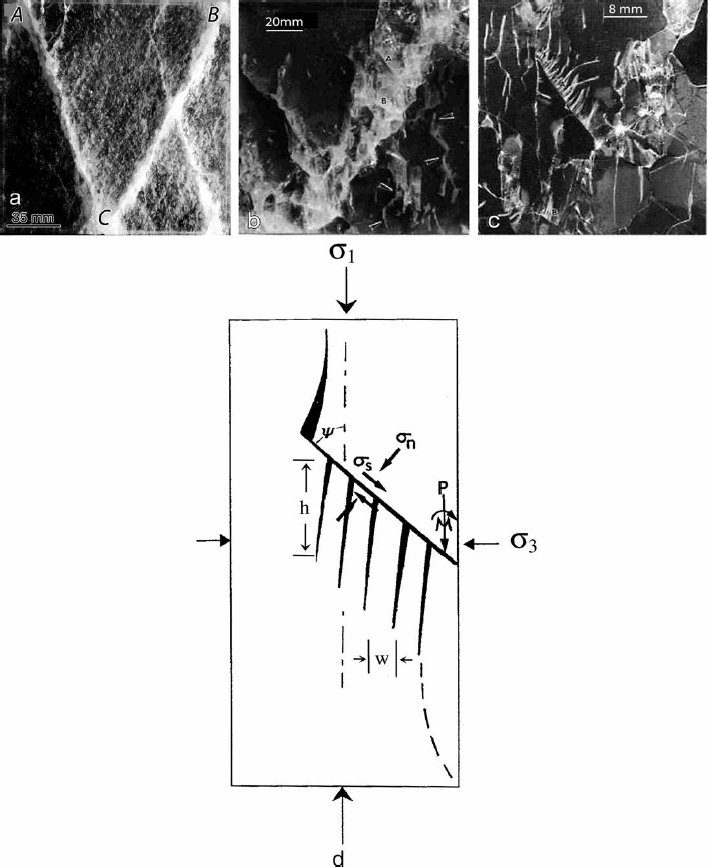
that brittle failure under compression is a multi-step process. As load is applied, cracks initiate and then propagate, interacting in the end to form a set of macroscopic faults across which post-terminal deformation becomes localised. A key step is crack sliding. Under the applied stress, opposing faces of inclined primary or parent cracks (that either pre-exist or are nucleated during loading) come into contact and then become displaced with respect to each other once the shear stress acting on the plane of the crack exceeds frictional resistance. The displacement generates tension at the crack tips and this leads to the initiation of secondary cracks that form out-of-plane extensions along the direction of loading. The extensions are termed wing cracks, Fig. 1. Displacement across the primary crack increases as the load rises, opening the wing-crack mouth and increasing the attendant mode-I stress intensity factor to the point that the wings grow, albeit in a macroscopically stable manner as opposed to the unstable manner of crack growth under an applied tensile load. The energy for wing-crack growth is derived from external work on the body. Wing cracks eventually interact with each other and with free surfaces, culminating in a series of splits that lead to terminal failure, Fig. 2. Under uniaxial loading, wing-crack length l relative to the half-length c of the primary, sliding crack is governed by the coefficient of kinetic friction μk and by the plane strain fracture toughness K
Ic and (for inelastic deformation in two dimensions) is given by the relationship
6
a Photograph of a wing crack in columnar-grained, freshwater ice. The wing crack is centred in the image and is shown in 3D; parts of other cracks are also shown. The wing crack was introd°Ced by loading ice uniaxially across the columns (i.e., along the vertical direction of the image) at -10°C at a strain rate of 10-3 s-1. The long axes of the columnar grains run more or less in and out of the field of view, but are inclined slightly with respect to the normal to show the 3D character of the crack. The wings are oriented sub-parallel to the direction of loading and stem from a through thickness primary crack that is inclined by about 45° to the loading direction. The length of the primary crack is governed by the ˜10 mm diameter of the columnar-shaped grains. The ice possessed the S2 growth texture (Appendix 1), which had the effect of constraining inelastic deformation the plane perpendicular to the long axis of the grains. b Schematic sketch in 2D of the formation of a wing crack. Wings initiate within the tensile T field (i) at the tips of an inclined, parent crack and then lengthen (ii) owing to sliding across the parent. Under the far-field applied compressive stress σ sliding is effected by the difference between the shear stress τ resolved onto the plane of the primary crack and the frictional resistance across that plane which is given by the prod°Ct of the normal stress across the primary crack σn and the coefficient of kinetic friction μk
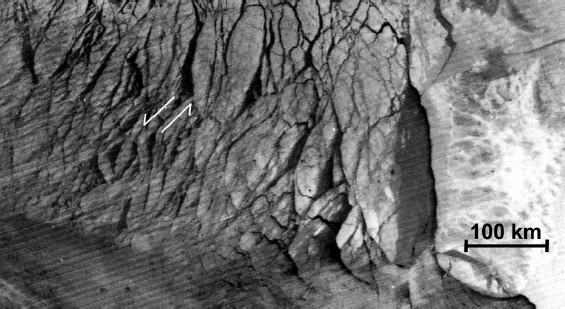
Photograph of a series of wing cracks in 2D (arrowed) in ice of the kind described in Fig. 1 and loaded as described there. (The long axis of the columnar-shaped grains is perpendicular to the image). Upon lengthening the wings interacted to form axial splits along the direction of loading (vertical in image) Photograph of cracks within the first-year ice cover on the Beaufort Sea. Banks Island is shown near the right-hand side under the scale mark. Note the wing-like character of the triangular-shaped features stemming up and down from the opposite tips of what appear to be inclined, primary cracks. Arrows indicate the shear stress on one possible primary crack. The photograph was obtained on 11 February 1983 from a satellite using infrared sensors of 0.6 km resolution. The image was obtained from file transparencies provided through the U.S. Air Force Defense Meteorological Satellite Program. The transparencies are archived at NOAA and at the University of Colorado, CIRES/National Snow and Ice Data Center (from Ref. 12)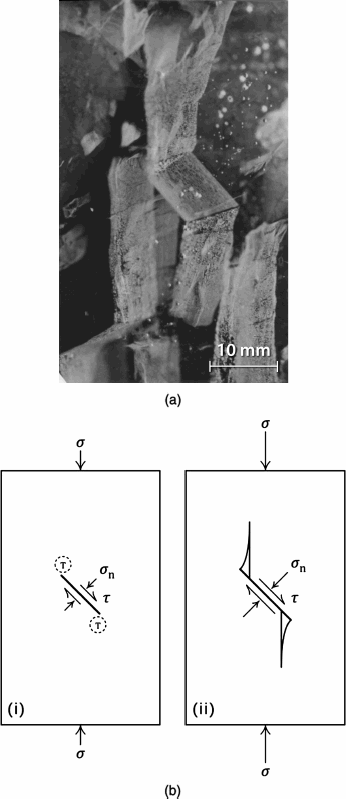
In permitting wing cracks to be seen, ice played a significant role in qualifying the frictional sliding mechanism. Earlier work revealed out-of plane-extensions of the kind that had been predicted, 2–4,6,14,15 but was based upon the study of crack-like slots that had been machined into brittle materials. What ice allowed for the first time was the observation via high-speed photography of natural cracks at play. There was no concern that the wings were artefacts of specimen preparation, as there was for rock, 16 for owing to the optical transparency and the relatively large grain size (1–10 mm) of ice, there was no need for post-test sectioning of the material. 10,11 Wing cracks were visible to the unaided eye.
Sliding also occurs under moderate confinement, but failure occurs through a somewhat different although related mechanism. Secondary cracks still form, not simply as pairs of wings but (owing to non-uniform sliding) as closely spaced sets on the side of the primary, sliding crack.
17
The secondary cracks create sets of microplates, fixed on one end and free on the other, Fig. 4. Frictional drag across the free end causes the plates to bend and then break in a domino-like manner, analogous to the failure of teeth in a comb under a sliding thumb. The ‘comb crack’ mechanism (as indicated schematically in Fig. 12.15 of Ref. 1) accounts for the formation of frictional or Coulombic shear faults, an example of which is shown in Fig. 4
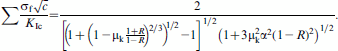
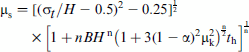
a. An analysis based upon mixed mode-I and mode-II loading that includes frictional resistance from both the free end and the sides of the microplates leads to a relationship for the applied stress that is required to break the first microplate in the set, taken as the failure stress σf. It is given non-dimensionally by the equation
8
a Photograph of conjugate sets of Coulombic shear faults that were generated within columnar-grained freshwater ice of the kind described in Fig. 1. The ice was proportionally loaded biaxially across the columns along the loading path
Another instance where friction and fracture are related is the transition from brittle to ductile behaviour. At root, the transition marks a balance in the micro-mechanical competition at crack tips between two processes:
18
the intensification of internal stress through crack sliding and the relaxation of internal stress through creep. A physical model has been developed
8,18
that incorporates the resistance to creep, to crack propagation and to frictional sliding and, when expressed in terms of a critical strain rate (ε̇)tc, is given by the relationship (for confined, compressive loading)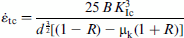
Friction also plays a major role in another transition; namely, from frictional or Coulombic (C) faulting to non-frictional or plastic (P) faulting.
19–21
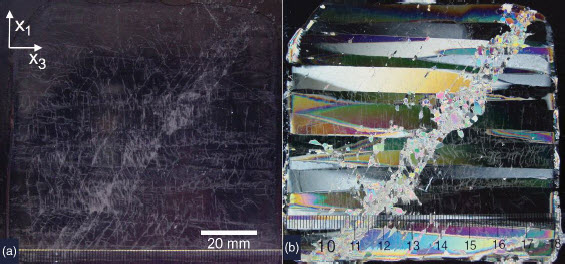
This transition is governed by adiabatic heating and sets in when ice is rapidly loaded under a relatively high degree of triaxial confinement; i.e., when the hydrostatic component of the stress state becomes sufficiently great to suppress sliding while the non-zero deviatoric component activates dislocation slip. P-faulting is not strictly a mode of brittle failure, in that crack growth and interaction are not involved, although it manifests brittle-like character in that load-bearing ability is suddenly reduced through the localisation of inelastic deformation within one or more narrow bands – oriented in this case close to planes of the greatest applied shear stress. Figure 5 shows an example. The important point from the perspective of this paper is that the critical level of confinement R
c needed to suppress sliding and to activate the CRP transition is governed solely by the coefficient of kinetic friction
19,20
Photograph showing a plastic fault within columnar-grained freshwater ice of the kind described in Fig. 1. (Scale: the finer divisions are in mm). The ice was proportionally loaded triaxially along the loading path σ1:σ1:σ3 = 1.0:0.5:0.2 at -10°C at a strain rate of ε̇1=6×10⁻³ where the two more compressive stresses σ1 and σ2 were applied across the columns and the least compressive stress σ3 was applied along the columns. The fault is inclined by about 45° to the long axis of the grains. a thin-section (˜ 1 mm) viewed under natural light where, owing to absence of significant damage, the fault is only faintly visible;
The greater the coefficient of friction, the lower is the critical confinement. Interestingly, there is now evidence that a similar transition may occur within rock that forms Earth's crust. 22
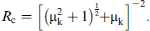
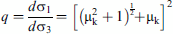
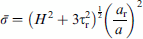
The importance of friction in brittle compressive failure is reflected as well in the large effect of confinement on compressive strength. For instance, when the confining stress is only 10% of the applied stress, the compressive strength of ice (taken as the most compressive applied stress at failure) increases by ˜100%; and when the confining stress is 20% of the applied stress, the strength increases by ˜400% or more, Fig. 6 (for review see Ref. 1). Where friction is not important, the hydrostatic component of the stress tensor plays no role in failure, as is the case in ductile metals where either the Tresca, the von Mises or the Hill criterion limits yielding: in that case, the strength in the two cases just noted would have increased not by ˜100 and ˜400%, but by about 10 and 20%, respectively. The sensitivity q to confinement (i.e., the slope of the rising branch of the brittle compressive failure envelope where strength is limited by Coulombic faulting, Fig. 6) is given by q = R
c
-1 and thus by the relationship
23
Brittle compressive failure envelope for columnargrained, freshwater ice of the kind described in Fig. 1. The column diameter is 2–3 mm. The ice was proportionally loaded biaxially across the columns along the loading paths 0⩽σ2/σ1⩽1 at -10°C at a strain rate of ε̇i=4×10⁻³. Failure along the rising branch of the envelope occurs via Coulombic faulting; along the descending branch failure occurs via across-column spalling out of the loading plane (from Ref. 1)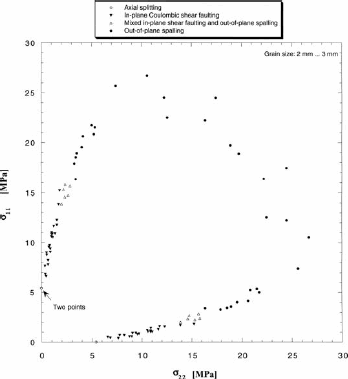
The models described above are independent of spatial scale. Although verified through experiments in the laboratory, the question is: how well do they work on the engineering and geophysical scales? Evidence in the form of ‘look alike’ fracture patterns and information contained therein on failure stress, 1,12,13,24–26 albeit limited, points in the direction of scale-indepen-dence. Moreover, failure envelopes generated from measurements made on both the large (field) and the small (laboratory) scale indicate that the coefficient of friction itself is essentially scale-independent. 27 This point follows from the fact that 27 the friction-controlled slope of the envelope (equation (5)) that bounds in situ measurements of the stress state within the sea ice cover on the Arctic Ocean 28 is closely similar to the slope of the low-confinement branch of the brittle compressive failure envelope generated in the laboratory from measurements made on specimens of first-year sea ice harvested from the winter ice cover. 23 The failure stresses within the sea ice cover, however, are lower than failure stresses measured in the laboratory, by about three orders of magnitude, because the size of the stress concentrators (e.g., thermal cracks) can be as much as six orders of magnitude greater.
Friction of ice: observations
We turn now to friction per se of ice sliding upon itself. In the instances described above and in the examples discussed in Section 5: Implications for ice mechanics, sliding occurs relatively slowly (V s<0.1 m s−1). We limit the review, therefore, to sliding at rela-tively low velocities. We limit the review further to the friction of the low-pressure form of water ice; namely ice Ih described in Appendix 1.
Static friction
Static friction is greater than kinetic friction. This difference first became clear for ice through early experiments by Bowden and Hughes.
29
They noted that when surfaces of relatively warm ice were allowed to stand in contact for a few minutes, the shear force to initiate motion was much greater than the force to sustain movement. Bowden and Hughes did not quantify the effect, although they reported that it was less significant in colder ice. More recently, Lishman et al.
30
found from a series of slide-hold-slide (SHS) experiments on salt-water ice, using the double-shear method, Fig. 7, that static friction increased with the logarithm of holding time under a load applied normal to the interface, being greater, for instance, by about a factor of 2 after holding for 10
3
s at −10°C under a normal stress of 50 kPa. Schulson and Fortt
31,32
confirmed this behaviour. Schematic sketch of a double-shear device. The forces
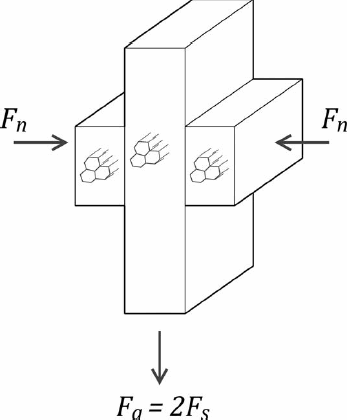
Figure 8 illustrates the effect of hold time. The curves shown were generated during SHS experiments
31,32
that were performed in the laboratory at −10°C using a double-shear device attached to a uniaxial loading system. The experiments were performed on both freshwater, granular ice of no crystallographic texture and columnar-grained, first-year sea ice of salinity ≈5 ppt that possessed the S2 growth texture (Appendix 1). The long axes of the columnar grains of the sea ice were oriented as they would be in a natural cover undergoing the kind of strike-slip-like deformation described by Marko and Thomson
33
and by Schulson;
13
i.e., perpendicular to both the direction of normal load and the direction of sliding. Immediately before sliding, the surfaces of both materials had been freshly prepared by milling, to a roughness of Ra<1 μm. The SHS curves of Fig. 8 are presented in terms of the ratio of the global shear stress to the global normal stress τ/∼n acting on the interface (i.e., the ratio of one-half of the measured axial force Fa to the applied normal force Fn, Fig. 7, where each force was divided by the apparent area of contact and the factor of 2 arises because sliding in a double-shear device is resisted at two interfaces) versus actuator displacement, at actuator velocities from 10−6 to 10−4 m s−1. The normal stress was constant at σn = 60 kPa and the holding time ranged from 1 to 10
4
s. The inserts show the response after holding 100 s. Upon holding under normal load, the shear stress for both kinds of ice first increases and then reaches a maximum τmax, followed by a rapid descent to a ‘steady-state’ level. The descent begins once sliding resumes (at an initial velocity greater than that applied by the actuator of the loading system) and is complete within a sliding distance of the order of tens of micrometres once the rate of sliding reaches the actuator velocity. The coefficient of static friction μs is defined by the ratio Plots of frictional shear resistance τ divided by normal stress σn versus displacement from slide-hold-slide tests at -10°C on first-year sea ice
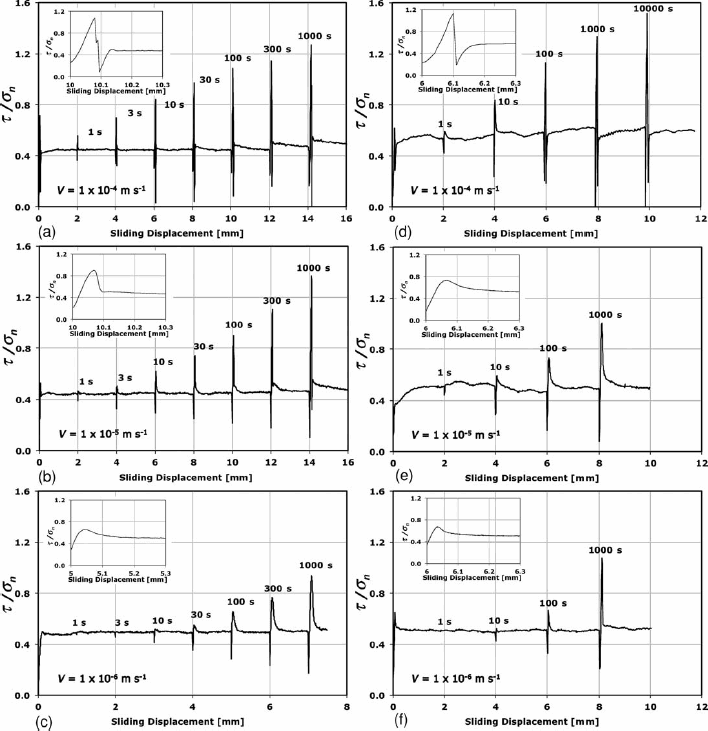

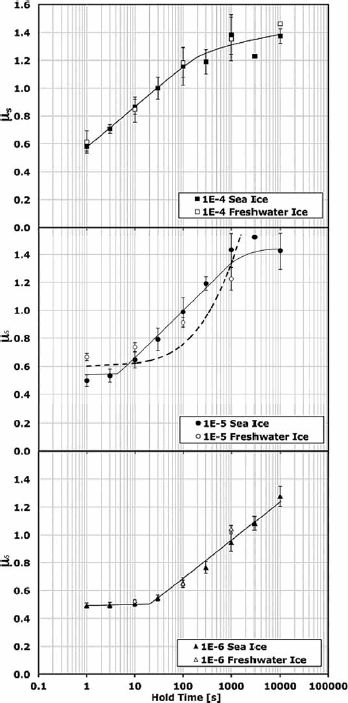
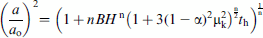
Figure 9 quantifies this behaviour. No effect is detected until holding time exceeds a threshold period t
t that decreases with increasing velocity, from t
t ∼30 s at V
s = 10−6 m s−1 to ∼3 s at V
s = 10−5 m s−1 to ∼0.3 s at V
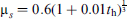
s = 10−4 m s−1. Once the threshold is exceeded, the coefficient of friction μs increases with the logarithm of holding time t
h for t
t⩽t
h<t
u (where t
u denotes an upper limit of ∼103–104 s) and may be described by the relationship Plots of the coefficient of static friction μs = τp/σn versus log10 hold time, constr°Cted from the data shown in Fig. 8 plus more of the same kind, where τp denotes the peak shear stress upon re-initiation of sliding. Averages and standard deviations are shown. The dashed curve on the middle plot was calculated from equations (36) and (37) (from Ref. 32)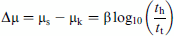
In addition to the log time relationship, static strengthening may be described reasonably well by the power law
Temperature exerts an effect. 31 Upon cooling from −10 to −75°C, the strengthening coefficient falls by about a factor of 3, to β= 0.1; and upon cooling to −100 and to −175°C, the coefficient falls still further to below 0.03, the limit of detectability 31 in the experiments cited.
Sea ice cannot be distinguished from granular, fresh-water ice 32 on the basis of static strengthening, at least at temperatures of −10 and −30°C. This suggests either that the difference in microstructure compensates for hidden effects of salinity and texture or, more likely based upon observations noted below, that microstructure is not a major factor in static strengthening.
The behaviour just described was observed in the laboratory from a study of relatively small (cm-sized) specimens, again raising the question: is size a factor here? Consider two other SHS studies, both performed on meter-sized blocks of ice. Lishman et al. 30,34 performed tests in an ice basin on saline ice (7 ppt salinity) at −10°C held under normal stress of σn = 10 kPa for periods up to 103 s, after sliding at V s = 8×10⁻³ m s−1 and then resuming sliding at that velocity. They obtained the value β = 0.48, albeit accompanied by a larger degree of scatter than noted above. The other study was performed on the sea ice cover in Svalbard. There, Sukhoruhov and Loset 35 held blocks of first-year sea ice under a normal stress of σn = 4.2±0.6 kPa at temperatures from −18 to −7°C for periods from 5 to ∼103 s, sliding intermittently at V s = 4×10⁻² m s−1. They found for both dry and wet (i.e., fully submerged) interfaces the lower value β = 0.19, again accompanied by a relatively large degree of scatter. Given that larger specimens led to both a greater and a lesser β-value from that obtained with smaller specimens, it seems likely that the differences are related more to experimental scatter than to size per se.
So far, the behaviour that has been described was observed in the absence of fragmented ice or rubble placed at the interface. Scourfield et al. 36 have now reported results from a first series of experiments on the effect of ice rubble on static friction, undertaken on sea ice in the Barents Sea during March 2014 when air temperature was −7 to −10°C. The double-shear approach was adopted and the experiments were performed by pulling a block of floating ice through a channel of open water three metres in length. Rubble in the form of ice broken from a sheet ∼30 cm in thickness filled the gap between the sides of the channel and the block. The hold time was varied from 1 s to 16 h. Again, the resistive force increased with hold time. However, unlike the observations described above (made in the absence of rubble) where the coefficient of static friction increased linearly with the logarithm of hold time, these experiments revealed non-linear behaviour with two distinct regimes, before and after a hold time of ∼ 3 h . Scourfield et al. 36 suggest that consolidation of the rubble sets in around this time, leading to fracture of the consolidated material and to greater friction. A number of factors probably affects the behaviour – rubble size, shape and distribution, normal load, air temperature and the rate at which the shear load is applied following the hold period; the importance of each remains to be established.
Static strengthening/aging is not limited to holding ice against itself, nor to ice. It has been observed when ice is pressed against both PMMA and steel at temperatures from −13.5 to −3.5°C. 37 In those cases, the value of the strengthening coefficient appears to be lower (i.e., β∼0.1 (our estimate) versus β = 0.30). When in contact with rubber 38 at −5°C, ice displays the same effect, again exhibiting a strengthening coefficient of β∼0.3. The effect is found also in cold metals, 39 in paper, 40 in glassy polymers 41 and in rock. 42–44 In those cases, β is even lower than in warm ice, by about an order of magnitude. In other words, ice is not unique.
To what degree does a statically strengthened interface develop cohesive strength? Bonding is expected, particularly within warmer ice, although confirmatory pull-apart tests remain to be performed.
Kinetic friction
Stick-slip
Once static friction has been overcome sliding commences. At that point the frictional resistance decreases (except at temperatures sufficiently low to prevent static strengthening) and tends towards a level that generally oscillates about a mean, in some cases by as much as ∼50% but more commonly by <10%. The exception appears to be sliding at velocities high enough to allow frictional heating to melt the entire interface (more below). The character of the oscillation is a function of both the material system and the stiffness of the loading device and is a manifestation of a dynamic instability termed stick-slip. Accordingly, slip is followed by a quasi-stationary period of no macroscopic displacement during which the shear force increases to a level sufficiently high to reactivate slip. Although not explored systematically, stick-slip in ice has been observed in a variety of scenarios: in the laboratory as either warm or cold ice (−10 to −175°C) slides slowly over itself (5×10⁻⁸−10−3 m s−1) over either a smooth or a rough interface; 31,45–50 in an ice basin as multi-meter slabs of saline ice are pushed past a floating ice sheet; 30,51 in the field as either wet or dry meter-sized blocks of sea ice are pulled over parent ice sheets; 35,52 and on the Arctic Ocean as floes of sea ice either push into a developing ridge 53 or ride over themselves to create rafts, 54–56 leading to icequakes. Stick-slip is observed also when warm ice slides against steel and against PMMA. 37 Presumably, stick-slip is accompanied by microseismicity, although this point remains to be proved. Perhaps this behaviour is a reflection in part of the spatiotemporal or intermittent character of slip that we propose below (Velocity weakening section).
Where some attention to stick-slip has been given, it has been noted that the behaviour depends somewhat upon sliding velocity and temperature, becoming more pronounced at the higher end of the low-velocity regime under review. For example, from experiments in the laboratory Kennedy et al. 47 reported stick-slip at −3°C at velocities as low as V s = −10−5 s−1 m s−1 and at −10°C at V ⩾5×10⁻⁵ m s−1; and Maeno et al. 57 reported that stick-slip tended to higher sliding velocities (over the range 10−5–10−3 m s−1) as temperature decreased from −1 to −27°C. As will become apparent from the section Dependence of μk upon velocity (5×10⁻⁸ to 10−1 m s−1) those conditions fall within the regime where the coefficient o f k inetic f riction d ecreases w ith increasing velocity. Stick-slip within that regime can be understood in terms of an imbalance of forces that sets in when the decrease in frictional resistance per unit of displacement exceeds the stiffness of the loading system. The force imbalance causes the slider to accelerate, leading to unstable sliding. Pritchard et al. 52 offer a quantitative model, developed upon pulling blocks of sea ice across the surface of a parent ice cover using a 4.8 mm diameter steel cable – similar to a model presented by Persson 58 for metals and to one by Scholz 59 for rock.
Less well understood is the rather unusual occurrence of stick-slip within the velocity–temperature domain where the coefficient of friction increases with increasing velocity (section on Dependence of μk upon velocity (5× 10⁻⁸ to 10−1 m s−1). Perhaps in warmer ice (−50 to −10°C), dynamic cohesion may be at play as bonds form and then break in a repetitive manner during sliding. But in cold ice at −175°C, something else must be going on, possibly 31 a pressure-induced phase transformation from lower density Ice-I to higher density Ice-II accompanied by an 8% retraction of asperities in contact and by a momentary reduction in friction. We return to this possibility in the section on Velocity-strengthening section.
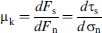
Definition of the coefficient of kinetic friction
Early work established that the mean shear resistance F
s is proportional to the normal load F
n applied across the interface.
29,60
The coefficient is termed the coefficient of kinetic friction, denoted μk, and may be defined either by the ratio of forces and hence of stresses
Concerning the τ–σn relationship, under low normal stresses σn<2 MPa – i.e., under normal stresses low enough (defined elsewhere
31
) to avoid brittle failure – the shear resistance increases linearly with normal stress within experimental scatter.
29,31,45,57
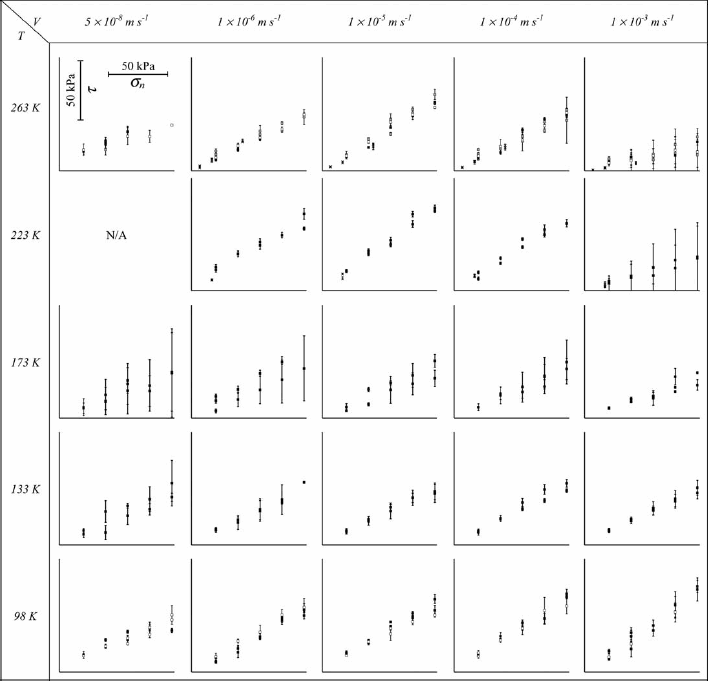
This is evident from measurements made (using a double-shear device) over relatively large ranges of velocity (∼10−8–10−2 m s−1) and temperature (−196 to −3°C) upon sliding across both smooth surfaces created by either milling or microtoming and rough surfaces (defined below) created by shear faulting. Figure 10 shows examples from experiments at −175°C (98 K), −140°C (133 K), −100°C (173 K), −50°C (223 K) and at −10°C (263 K). In other words, over the ranges of experimental conditions noted above, ice obeys Coulomb's friction law: Shear stress τ(kPa) versus normal stress σn (kPa) versus temperature (−175°C (98 K) to -10°C (263 K)) and sliding velocity (5×10⁻⁸-1×10⁻³ m s-1) for granular, freshwater ice of 1-mm grain size (solid squares) and of 8-mm grain size (open squares). Grain size exhibits no systematic effect. Note the overall linear character of the τ-σn relationship (from Ref. 31)
Dependence of μ k upon velocity (5×10⁻⁸ to 10−1 m s−1)
Figure 11 shows the coefficient of kinetic friction for fresh-water ice sliding slowly over itself across smooth surfaces (roughness R
a−1
(O[μm]) at velocities from 5×10⁻⁸ to 1×10⁻³ m s−1 at temperatures from −175 (98 K) to −10°C (263 K)).
31
Under those conditions, stick-slip was observed to a greater or lesser degree under all conditions (see Fig. 3 of Ref. 31). The data were obtained upon sliding a distance of 2 mm using a double-shear device and were obtained from the derivative (equation (10)). (Experiments
31
in which the sliding distance ranged from almost nothing to 20 mm showed that ‘steady state’ had been attained after sliding ∼1 mm.) To discern significant effects, the experimental data from which Fig. 11 was constructed had first been subjected to statistical analysis
31
by calculating p-values, rejecting null hypotheses for p<0.05. Such analysis showed that minor trends apparent in the raw data, such as a slight increase in the coefficient of friction followed by a small decrease followed again by an increase (e.g., as shown in Fig. 6
a of Ref. 31, for sliding at the low temperatures of −140 and −100°C) have no statistical significance. Graphs of the coefficient of kinetic friction versus sliding velocity at temperatures from -175 to -10°C, derived from the kind of data shown in Fig. 10 and after the data were subjected to statistical analysis to isolate significant effects. The bar through each point denotes the standard deviation (from Ref. 31)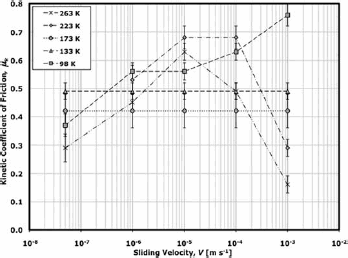
The friction coefficient does depend upon velocity both at higher temperatures (T⩾−50°C) and at the lowest temperature explored (−175°C). At higher temperatures, the coefficient exhibits dual behaviour;
31,47
namely, positive dependence at lower velocities (V
s⩽10−5 m s−1), termed velocity-strengthening, where over the range noted above the coefficient increases by about a factor of 2; and negative dependence at higher velocities, termed velocity-weakening, where the coefficient decreases by a factor of 4 or even more
47
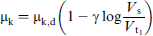
when the upper limit is raised to 5×10⁻² m s−1. At the lowest temperature (−175°C), the coefficient increases with increasing velocity over the whole range explored, by about a factor of 2. Velocity-strengthening can be described by the power-law
Dual behaviour is not limited to freshwater ice sliding across a smooth (Ra∼1 μm) interface, nor is it limited to ice on ice or even to ice. Strengthening and weakening are evident upon sliding across smooth surfaces in saline ice 47 and upon sliding across natural Coulombic shear faults, of roughness three orders of magnitude greater (R a∼1 mm), 45 in both freshwater ice and first-year sea ice, Fig. 12. Dual behaviour also characterises ice/glass and ice/granite 66 as well as halite, 67,68 quartz, 69,70 serpentine 71,72 and granite 73 when sliding slowly over themselves.
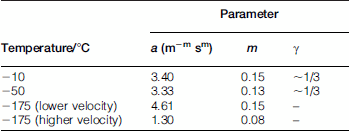
Experimentally derived values 31 for the constants in equations (12) and (13) (for velocity expressed in units of m −1)
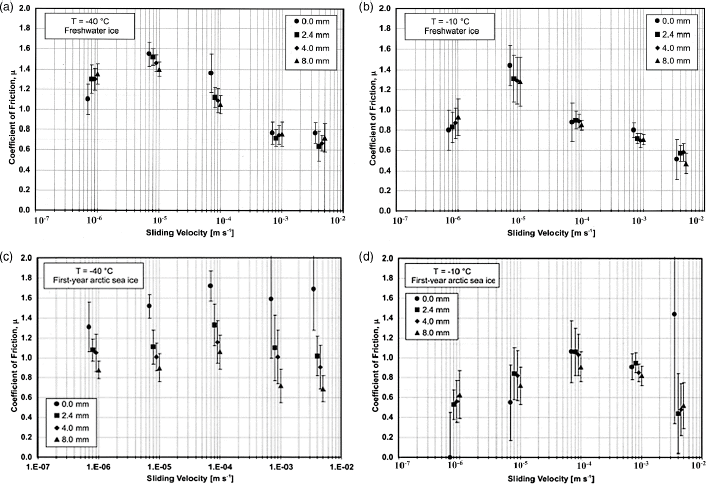
Graphs illustrating the effect of sliding velocity and displacement on the coefficient of kinetic friction across Coulombic shear faults within
Returning briefly to the definition of the coefficient of kinetic friction (equations (9) and (10)), it is important to note that when the parameter is defined in terms of the direct ratio of shear force to normal force via equation (9), thereby incorporating cohesion or the sticking together of opposing surfaces, velocity strengthening is not evident when warm ice slides very slowly upon itself. Maeno et al. 57 and Maeno and Ara-kawa 49 and Kennedy et al. 47 used that definition when sliding over ice at −10°C over the range of velocity from 10−7 to 10−1 m s−1 and did not report strengthening at the lower velocities. Instead, they observed weakening over the entire range. However, upon sliding ice slowly at the lower temperature of −40°C, where less cohesion is expected, Kennedy et al. 47 observed both strengthening and weakening in both freshwater ice and saline ice.
Turning to field experiments in the Arctic and to measurements made there using meter-sized blocks of sea ice sliding over a natural cover, behaviour has been reported that at first glance might appear to be different. Upon sliding blocks across natural (i.e. unprepared) surfaces at velocities within the range 5×10⁻³ to 1×10⁻¹ m s−1 (i.e., at velocities over the higher end of the ‘low-velocity’ range), Pritchard et al. 52 and later Sukhorukov and Loset 35 found that within experimental scatter velocity appeared to display no systematic effect on sliding resistance. Over the range of velocity noted and for ice temperature between about −2 to −6°C and air temperature between about −2 and −12°C, the coefficient of kinetic friction for snow-free interfaces was measured 35 to be μk = 0.45±0.05, independent of whether bottom ice slid across top ice or top across top. This compares with the lower values μk = 0.1 at 5×10⁻³ m s−1 and μk = 0.04 at 5×10⁻² m s−1 for saline ice at −10°C sliding over itself in the laboratory. 47 However, once the sliding surfaces had been run in by sliding blocks multiple times across the same path, the coefficient of kinetic friction, as observed in the laboratory, decreased with increasing velocity and tended towards the value 35 μk = 0.05–0.1 at 4×10⁻² m s−1, scaling as V s −1/2. The running in may have had two effects: it probably allowed the opposing surfaces to better fit together by reducing natural topo-graphy 35 and it may have reduced the roughness of the interface. In other words, allowing for the small differ-ences in temperature of the field and the lab experiments indicate that the coefficients derived from smooth surfaces, whether on relatively small or large specimens, are essentially the same within experimental scatter, implying, as already noted from the scale-independent slope of the brittle compressive failure envelope (section Relationship between friction and fracture: lessons from ice), that size appears not to be a factor here.
The field tests revealed another point. Interfaces submerged in sea water offered no significant difference from dry interfaces in sliding resistance. 35 That point, when combined with the absence of a detectable effect of submergence on static strengthening noted above, means that the fundamental physical processes underlying static and kinetic friction are essentially insensitive to the presence of external water under insignificant fluid pressure. Those processes for slow sliding, as discussed below (section on Physical mechanisms), involve the interaction and deformation of asperities whose points of contact appear not to be wetted by external water.
A note on cohesion is worth mentioning. When Coulombic shear faults were introduced into relatively warm (−10°C), columnar-grained specimens of both freshwater ice and saline ice through proportional, biaxial loading, for the purpose of subsequent sliding experiments, it was found 45 upon removing the ice from the loading system that the faulted specimens did not come apart. Prior to unloading, the faults had slid a few millimetres in about one second; i.e., at a velocity of ∼10−3–10−2 m s−1. The faults, in other words, possessed cohesive strength. We return to this observation in the section Coefficient of kinetic friction.
Rate-state friction
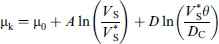
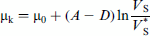
To expand further upon the effect of sliding velocity, consider the results of experiments in which the sliding velocity was changed ‘instantaneously’.30,34,74 In rock mechanics, experiments of that kind are viewed within the context of rate-state friction, described by the phenomenological relationship75,76


Parametric values for equation (17) obtained by sliding freshly formed Coulombic shear faults in freshwater ice across themselves at -10°
C
74
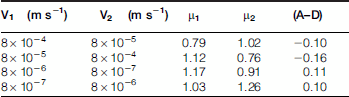
Interestingly, values of (A–D) for ice are greater than values derived for rock. For instance, for Westerly
granite the values differ by about a factor from 4 to 80 within the velocity-strengthening regime and by a factor from 30 to 160 within the velocity-weakening regime. 77 This difference, we suggest, reflects a difference in the strain-rate sensitivity m′ of the flow stress σ∝ε̇m′ of the two materials: for ice1 m′ ∼ 0.3 at −10°C (homologous temperature of T h = 0.96); for granite 78 m∼0.01 at room temperature (T h∼0.3).
In a related study on columnar-grained saline ice of ∼10 ppt salinity and 930 kg m−3 density, Lishman et al. 79 found, upon resuming sliding at a higher rate after holding under load for a period of time, that the friction coefficient at −10°C decreased from the static strengthening level and reached a steady-state level not after sliding a ‘critical distance’ as exhibited by rock 76 but after sliding a distance that increased with increasing slip rate. This, they suggested, indicates that saline ice conforms more to the concept of a critical slip time than to a critical slip distance and that effects of memory persist for about 10 seconds. The meaning of this ob-servation remains to be clarified.
Dependence of μk upon temperature (−10 to −175°C)
In addition to velocity, temperature affects the coefficient of kinetic friction. The effect, however, is less systematic (Fig. 11). Statistical analysis, 31 again based upon p-values, revealed significant variation at the highest velocities, but not at the lowest. For instance, at V s = 10−3 m s−1 μk increases monotonically with decreasing temperature and brackets the complete range of values measured from smooth surfaces (μk = 0.15– 0.76). At the lower velocities of V s = 10−4 and 10−5 m s−1, μk first increases as temperature decreases from −10 to −50°C and then decreases as temperature decreases further to −100°C; as temperature decreases still further to −175°C, μk increases again. And at the lowest velocity of 5×10⁻⁸ m s−1, μk increases upon decreasing temperature from −10 to −140°C, but then decreases upon lowering temperature to −175°C. Temperature in other words, has a rather complex effect.
Dependence of μk upon roughness: natural versus prepared surfaces
The other factor that affects the coefficient of kinetic friction is roughness. Resistance to sliding across natural Coulombic faults, for instance, is greater by about a factor of 2 or more than upon sliding across freshly prepared, smooth surfaces.31,45 This point is evident upon comparing Figs. 11 and 12. The expenditure of additional energy is attributed to ploughing and to displacement of fragments of ice that become embedded in the fault.20,45,80 Snow on ice – although creating a somewhat loosely granular interface – raises sliding resistance in a similar way,29,52 increasing for instance the coefficient from μk ∼0.5 to ∼0.7 for sea ice sliding at velocities between 10 and 40 m s−1 across relatively warm natural covers. 52
Concerning the functional relationship, laboratory tests31 on sub-meter sized specimens in which the roughness ranged over three orders of magnitude (0.4 μm ⩽R a⩽1300 μm) showed that at −10°C at V s = 10−4 m s−1 under a global normal stress of ⩽2 MPa the coefficient of friction scales as μk ∝ R a 0.08. In other words, large though a factor of 2 or more is when comparing machined versus faulted surfaces, the exponent of 0.08 indicates that the coefficient of friction is relatively insensitive to roughness.
At first glance that result may seem surprising. Yet when cognisance is taken of the behaviour of other materials sliding upon themselves, particularly ductile metals, ice fits a general picture. In such cases, the coefficient of kinetic friction is governed less by roughness per se and more by plastic deformation at the level of surface asperities (dis-cussed in section on Physical mechanism) and thus by the real area of contact 81 (quantified in Static strengthening/ageing section). The real contact area is essentially independent of roughness as long as the near-surface material can deform plastically. 81 Under the experimental conditions where the roughness of ice was explored, the material did deform plastically (more below).
Less important factors
Microstructure
There is little evidence to suggest that the microstructure of ice is an important factor. Over the experimental ranges of velocity and temperature noted above, neither grain size (1–8 mm), grain shape (equiaxed versus columnar), crystallographic texture (randomly oriented versus aligned c-axes) nor low-level salinity (∼5 ppt) exhibits a statistically measureable effect on the resistance to slow sliding across smooth interfaces.31,47,82 Snow, too, although more resistive 29 to sliding than is ice, shows negligible dependence on grain size. 83 This implies that the physical processes underlying friction are relatively insensitive to the microstructure of the parent material, unlike the processes that govern certain bulk mechanical properties.
An exception appears to be hard, second phases. Golding et al. 84 found from experiments on the two-phase ice I-magnesium sulphate (MgSO4ċ11H2O) eutectic system, of ∼0.4–0.5 volume fraction hydrated sulphate, that the composite, when sliding slowly upon itself at the low temperature of −175°C, has a coefficient of kinetic friction (derived as the derivative, from equation (10)) that is greater by about a factor of 1.4 than the coefficient for single-phase ice Ih. Also, at −175°C the composite exhibits little velocity dependence. 84 At −10°C, on the other hand, the ice-sul-phate composite exhibits velocity-weakening over the entire range explored (5×10⁻⁸ to 1×10⁻³ m s−1). 84 Differences like these, and possibly others – including effects yet to be measured of embedded quartz and other particles – may play a role in the friction of extraterrestrial icy bodies.
Slip distance
As already noted, once the distance of sliding exceeds ∼1 mm on smooth interfaces of freshwater ice, the mean sliding resistance becomes essentially constant (although stick-slip persists), at least up to a distance of 20 mm. This point was established from experiments that were performed under two relatively extreme conditions: 31 −175°C/1×10−6 m s−1 and −10°C/1×10−4 m s−1. In comparison, there is some evidence, albeit mixed, of slip weakening upon sliding up to 8 mm across Coulombic shear faults 45 in both freshwater ice and first-year sea ice at −40 and −10°C over a range at velocities from 8×10⁻⁷ to 4×10⁻³ m s−1, Fig. 12. This is probably another indication of an effect already noted; namely, that running in of rougher interfaces eases sliding resistance.
Normal stress parallel to sliding direction
In modelling the failure of the arctic sea-ice cover, Schreyer et al.
85
questioned whether, in addition to traction on the plane of material failure (i.e., in addition to the normal and shear components of the stress tensor mentioned above) the normal component of stress that is oriented parallel to the sliding plane affects sliding resistance. Such a state of stress could develop, for instance, within a floating sheet of sea ice loaded under biaxial compression, where the sliding plane is oriented perpendicular to the surface and inclined to the directions of principal stresses, as sketched in Fig. 13. In that figure the normal stress of interest is denoted σ′11. In principle, this component could act to restrict either the formation or the propagation of cracks that develop during sliding (discussed in the section on Microcracking and recrys-tallisation). A first series of experiments,
86
however, detected no effect.
86
In that work component σ′11 was varied from 0.20 to 1.83 MPa using a biaxial loading system operated under biaxial compression, by orienting a smooth sliding plane at two different angles with respect to the directions of principal stresses. The experiments were performed at −10°C on columnar grained, freshwater S2 ice sliding against itself across smooth surfaces at a velocity of 8×10⁻⁴ m s−1; i.e., at a velocity within the velocity-weakening regime. The results revealed no significant effect of σ′11 on the slope dσ′21/dσ′22 of the curve of shear stress versus normal stress acting across the sliding interface. It was concluded that under the conditions of those experiments, the normal stress acting in a direction parallel to the direction of sliding does not significantly affect sliding resistance. This conclusion, of course, is limited, and whether it applies under conditions where different mechanisms govern kinetic friction (section on Co-efficient of kinetic friction), for example at velocities within the regime of velocity-strengthening, is not known. Schematic sketch of the stress state acting on a sliding plane (dotted line) that is inclined by angle θ with respect to the directions of principal stresses σ1 and σ2 that act on an element of ice that contains the sliding plane. Stress components σ′11, σ′22, σ′21 denote, respectively, the normal stress acting in the direction of sliding, the normal stress acting across the sliding plane, and the shear stress acting on the sliding plane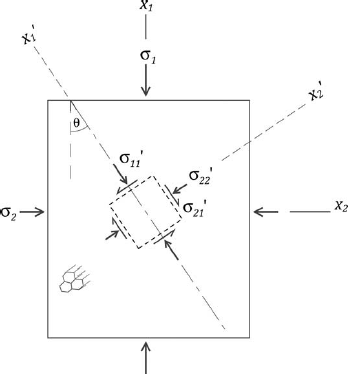
Reversal of sliding direction
The coefficient of kinetic friction appears to be insensitive to a change in sliding direction. 31 This point was established from an experiment in which, for freshwater granular ice of 1 mm grain size sliding against itself under a normal stress of 60 kPa at either −175°C/10−6 m s−1 or −10°C/10−4 m s−1, the direction was instantaneously reversed after sliding 2 mm while maintaining the sliding speed. Steady state set in immediately once the frictional force (of opposite sign) reached the pre-reversal level.
Microcracking and recrystallisation
Microstructural changes accompany sliding. From visual inspection and from observations using optical microscopy, Kennedy et al. 47 reported that within the regime of velocity-weakening the surface of freshwater, granular ice changed from relatively clear to rather opaque upon sliding at -10°C at velocities from 10-5 to 10-3 ms -1, accompanied by fine fragmentation (i.e., powdered ice) and by cracking to depths of about one grain diameter. Similarly, Montagnat and Schulson 82 reported surface cracks, oriented normal to the direction of sliding and spaced by ˜0.5 mm, that developed to a depth <0.6 mm in fresh-water, columnar ice when sliding at velocities of 10-5 to 10-3 ms -1; i.e., at velocities within the upper-end and lower-end, respectively, of the velocity-strengthening and velocity-weakening regimes. Presumably, similar microstructural changes occur within sea ice, although, as noted in a recent study on the role of damage on elastic behavior, 87 are more difficult to detect because of the opacity of the material.
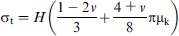
Microcracks presumably initiate from stress concentrators and then propagate under the action of tensile stresses, generated by tangential surface tractions that develop during sliding, when the attendant mode-I stress intensity factor K
I reaches the critical level K
Ic. The tensile stress σt reaches a maximum behind interacting asperities (defined in the section on Physical mechanism) and is given by the relationship
88

In addition to cracking, rubbed surfaces recrystallise. Barnes et al. 66 noted a zone of recrystallisation extending to a depth of ˜0.2 mm after slowly sliding a single crystal of warm ice across granite. Similarly, Montagnat and Schulson 82 observed boundaries of new grains of ˜ 300 μm diameter on the surfaces of freshwater ice rubbed at -10°C after sliding across itself at -10-5m s-1. Some of the boundaries were intersected by cracks, implying that recrystallisation had occurred dynamically. The ‘driving force’ for the transformation is probably strain energy in the form of crystal dislocations that develop within the near-surface regions where, during sliding, the combination of surface tractions and contact forces generate sufficient deviatoric stress to activate plastic flow.
Taken together, these observations imply that inelastic deformation during sliding at low velocities extends beneath the surface. Part of the work of friction, in other words, is expended through inelastic deformation within a narrow zone bordering both sides of the sliding interface.
Physical mechanisms
To understand the salient characteristics of the slow sliding of ice upon itself, namely static strengthening/aging of the coefficient of static friction and both velocity-strengthening and velocity-weakening of the coefficient of kinetic friction, it is important to appreciate that the real area of contact is considerably smaller than the nominal or apparent area.89,90 Contact occurs not globally across the entire interface, but locally at asperities that protrude from opposing surfaces, as sketched in Fig. 14. It is these local sites that constitute the real area of contact. The interaction of asperities is then a major contributor to both static and kinetic friction, including near-surface inelastic deformation. As will become apparent, other processes may also contribute, including melting over the higher-end of the low-velocity range. Schematic sketch of the mechanical interaction of asperities of average diameter 2
Static strengthening/aging
To account for the increasing coefficient of static friction upon holding under load under pseudo-stationary conditions, we invoke creep of asperities in contact. The analysis below is based upon one by Schulson and Fortt 32 who, for simplicity, assumed a fixed number of contacts of circular cross-section and a single initial asperity size. In reality, the number of contacts probably increases with both time of holding and normal load. Although details differ, in invoking asperity creep the analysis is similar to ones developed to account for the same effect in metals, 91 polymers35-41 and rock. 44
Consider first the average asperity size and how this parameter can be derived from experimental observations. Asperities interact for a period of time t
i where that time is the sum of the average time taken for contacts to slip past each other t
s plus the time of holding under stress t
h; i.e.,
The slip time is related to the sliding velocity


We are not aware of this threshold-based analysis being developed and applied for other materials, although we expect it to have applicability beyond ice. An example is granite. In a paper by Marone, 43 Fig. 1 of that work shows δμ-logt h plots that extrapolate to δμ = 0 at threshold times of ˜0.3 s and ˜3 s for sliding at velocities of 10 and 1 μm s-1, respectively. From equation (24), the average asperity diameter in granite is derived to be 2a o˜3 μm.
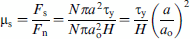
Returning to ice, to estimate the real area of contact and the areal density of contact points, Schulson and Fortt
32
assumed that the normal stress supported by each contact equals the hardness H of the ice, in keeping with modern theory.89,90 Accordingly, the total normal load F
n supported by N contacts is given by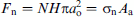


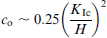
This mean spacing (400 μm) is interesting. It is similar to the average diameter of d = 300 μm of the dynamically recrystallised grains that were observed 82 following the slow sliding of ice upon itself at -10°C. It is similar, too, to the average size of the recrystallised grains that formed upon sliding a single crystal of warm ice across granite (evident from the photograph in Fig. 12 of Barnes et al. 66 ). Perhaps the boundaries of new grains sublime to the extent that the grains develop a dome-like cap of radius r such that the contact diameter 2a o is set by Hertzian mechanics, in which case (as can be shown from the elastic deformation of two spheres in contact) ao˜Hr/4E where E denotes Young's modulus. Noting that r>d and taking H = 20 MPa and E = 10 GPa, this interpretation implies that 2a o Hd/2E> 10-3 times; 400 mu;m > 0.4 μm. In other words, the minimum size of 0.4 μm is not inconsistent with the size (2a o˜30 μm) derived above from the threshold time.
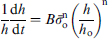
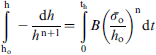
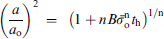
To obtain the coefficient of static friction, the contact area of each asperity and the shear strength of the contact must be estimated. Consider first the contact area. As mentioned already, we imagine that asperities creep under load, shortening and broadening in the process and increasing the area of contact, thereby increasing the shear resistance to sliding. From conservation of volume, the relative rate at which the contact area increases 

Next, consider the shear strength τy of the contact. That is the property that governs the coefficient of static friction. As the actuator is reactivated following the period of holding and traction is once again applied to the interface, tensile stress builds up within the contact zone. The tensile stress is limited by the tensile strength σT of the ice, which in turn limits the shear strength. Over the range of strain rate that was likely to develop at the relatively low actuator velocities (from10-6 to 10-4 m s -1) explored by Schulson and Fortt,
32
tensile strength exhibits essentially rate-independence.
1,93–96
The shear strength is expected to display the same character. Then, under the multiaxial stress state created by surface traction and normal loads, the shear strength of the contact is given by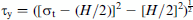
We note that in incorporating tensile strength and creep resistance, the model might appear to distinguish between saltwater ice and freshwater ice, for saline ice creeps more rapidly97,98 and is weaker in tension. 99 However, that appearance is deceptive. The difference noted in mechanical properties relates to the behaviour of material in bulk form. In the form of asperities, little or no difference is expected, because brine pockets, i.e., the microstructural feature that accounts for the difference in bulk behavior, are probably absent owing to their size and spacing being greater than the average diameter of asperities.
Returning to the model, equation (36) can be evaluated at -10°C where parametric values are available: n = 3 and
Implicit in the foregoing discussion is some level of cohesion or sticking together of opposing surfaces. Otherwise, surface traction could not develop during post-hold sliding. Bonding could develop during holding in several ways – through sintering via vapour transport, as discussed by Blackford; 100 through the assistance of a liquid-like layer on the surface of warm ice (reviewed by Dash 101 ) given the observation 102 of sub-second bonding between needles of ice when brought together under a normal load of 1 N at temperatures above ˜-23°C; or perhaps through the freezing of patches of melt-water that might form from thermal flashes at points of contact that for an instant during the sliding stage before holding experience velocities higher than average (more below). Whatever its origin, cohesion should be included in a more complete description of static friction.
Coefficient of kinetic friction
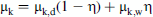
We turn now to the resistance to maintain sliding once the frictional force has fallen to a pseudo-steady-state level. As the opposing surfaces slide over each other, surface traction develops as the asperities interact, augmented perhaps by dynamic cohesion in warmer ice when sliding at lower velocities. The surface traction, in concert with the normal load and other contact forces, activate inelastic deformation within the near-surface regions, evident from the microstructural changes described in the section on Microcracking and recrystallisation. This irreversible deformation is a major contributor to the kinetic friction of ice sliding at low velocities.
Velocity-strengthening
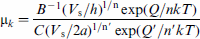
The rising part of the curve of the coefficient of kinetic friction versus velocity (Figs. 11 and 12) for warmer ice can be understood largely in terms of creep deformation, as first suggested by Barnes et al.
66
Accordingly, upon taking the coefficient of kinetic friction to be defined by the ratio of the shear stress τc to maintain a given creep rate σ̄ to the normal stress supported by the asperities, and upon taking again the normal stress to be limited by the hardness of the ice, which is also a rate-dependent property,
66
we write


Could the under-prediction be a reflection o f defor-mation being concentrated in a thinner zone? Although not easily justified, s hould h = 0.05 m m i nstead of 0.1 mm, theory and measurement (within experimental scatter) would come into agreement. Alternatively, could the under-prediction indicate a contribution to kinetic friction from the creation of new surface through a mechanism envisaged by Makkonen 103 (more below)? These questions remain open.
Concerning the sliding of colder ice, we imagine that asperities continue to interact and that near-surface regions continue to deform inelastically under the combined influence of surface traction and normal loads. Within the creep-based model, the influence of temperature is embodied in the apparent activation energies whose values have been reported 66 to be Q ˜0.81ev atom (78 kJ mol-1) and Q′˜0.75 ev atom-1 (72 kJ mol-1) for temperatures between about -10 and -50°C. Then, using again the values n = 3.0 and n′=4.4, the model predicts that upon lowering temperature from -10 to -50°C, for instance, the friction coefficient is expected to increase by a factor of ˜2.2. Experiment, on the other hand, shows that over this range of temperature the coefficient increases by a smaller factor of ˜1.3 (section on Rate-state friction). Although the predicted trend is similar to the one observed, the magnitude of the effect is considerably lower than predicted. A possible explanation for this difference, albeit speculative, is that creep deformation during sliding is characterised by activation energies lower than quoted above for which some evidence is the value Q= 0.41 ev atom-1 derived by Durham et al. 104 from low-temperature creep tests. In the same sense, should the shear strength and the hardness of ice become even more athermal in character and correspondingly less dependent upon rate of loading as temperature falls still further, it would become increasingly difficult to detect experimentally an effect of velocity on the coefficient of friction, thereby accounting possibly for the apparent absence of velocity dependence in measurements made at -100 and at -140°C (Fig. 11). At those low temperatures (of -100 and at -140°C), the primary contributor to friction might not be rate-dependent plastic deformation at all, but fracture, in keeping with the observation that both the measured coefficient of friction (Fig. 11) and the expected tough-ness of ice (albeit, based not upon measurement but upon an extrapolation from measurements at higher temperatures, reviewed in Ref. 1, Chapter 9) are about 30% higher at -140°C than at -100°C. The reality is that until low-temperature creep parameters are available, it is not possible to more fully access quantitatively the role of creep deformation on low-temperature sliding.
Why does velocity-strengthening reappear in still colder ice (at -175°C), from μk = 0.3 at 5×10⁻⁸ m s-1 to μk = 0.8 at 1×10⁻³ m s-1 (Fig. 11)? In addition to fracture, another mechanism probably becomes active. One possibility already mentioned (section on Stickslip) 31 is a pressure-induced phase transformation at points of contact, from ice I to ice II. The ˜25% volume re-duction accompanying that transformation could activate a temporary pulling away of contact, momentarily lowering sliding resistance. Once contact is lost and local pressure reduced, conditions would favour the reverse transformation, possibly at a rate lower than the forward transformation. 31 It is important to note that the kinetics of the IRII transformation are relatively sluggish, 105 at least within bodies larger than an asperity. As a result, this pull-away mechanism would be favoured at lower velocities, in keeping with the lower coefficient of friction at the lower end of the velocity range. At the higher end of the range, pull-away would be less favourable owing to the kinetic limitation and so the friction coefficient would be expected to be higher, as observed. Under those conditions friction might once again be limited by fracture, in keeping with the increase of factor of about 1.4 in both the coefficient of friction and the expected toughness (again, from extrapolation) relative to the values at -140°C.
Velocity-weakening
Returning to warmer ice and to the observation of velocity-weakening, frictional heating-cum-melting is at root here. The reason is that heat created through the work of friction at higher speeds has less time to be conducted away from the interface. 47,65,66,106–109 The potential exists, therefore, of raising the temperature of contacts to the point of melting and of providing the necessary heat of fusion to bring about the transformation. Frictional heat also softens asperities and lowers the creep strength of the near-surface deformation zone, but those effects, based upon equation (41) and using the warm-ice values 66 Q and Q′ = 1.3 and 1.5 ev atom-1 (120 and 145 kJ mol-1), respectively, and n = 3.0 and n′ = 4.2, reduce the coefficient of friction by only ˜13% and not by the factor of 4 or more that characterises the velocity-weakening regime. Similarly, softening of asperities through dynamic recry-stallisation (section on Microcracking and recrystallisation) is expected to have too small an effect.
In mind here is not global melting of the kind detected during high-speed sliding (>1 m s −1) of warm (-5°C) ice that acti-vates a second regime of velocity-strengthening.
65
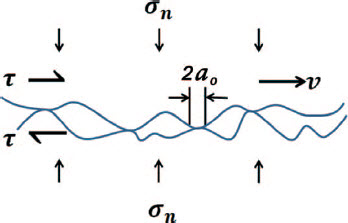
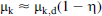
That regime relates to hydrodynamic effects and not to thermally activated deformation. At the lower velocities con-sidered in this paper, melting of the whole interface (i.e., of the whole of the real area of contact) is ruled out because calculation shows that frictional work is too small both to raise its temperature to the melting point and to provide the necessary heat of fusion, even when pressure melting is taken into account (Appendix 2). Instead, localised heating-cum-melting probably occurs at certain contacts, producing in the process thin patches of water that serve to lubricate the interface. We hypothesise that over the velocity-weakening regime wet contacts increase in both number and size to the point that all contacts become covered in a thin layer of water. We imagine that melting begins locally at velocity Vt1
and is complete at velocity Vt2
as sketched in Fig. 15. At velocities greater than Vt2
, the character of friction changes once again to velocity-strengthening, but via hydrodynamics as noted above.
65
In other words, we attribute the reduction in the low-speed friction from its maximum (at -10°C of μk ˜0.5 at Vs ˜10−5 ms−1) to its minimum (at -10°C of μk˜0.02 at Vs
˜ 10−1m s−1) to a gradual transition from dry to wet sliding. During the transition the coefficient of kinetic friction may be described by a function of the form Sketch of the coefficient of kinetic friction of ice on ice versus sliding velocity showing three regimes of behaviour: dry sliding at low speeds (governed by asperity creep); wet sliding at high speeds (governed by hydro-dynamic effects); and at intermediate velocities a combination of dry and wet sliding where, through frictional heating, an increasing fraction of the real contact area melts as velocity increases, beginning with the smallest contacts at
What is the evidence of localised melting? Marmo et al. 110 using low-temperature scanning electron microscopy, reported refrozen water on the surface of ice that had rubbed against steel at -3.4°C at 0.02 m s−1. Under those conditions, the coefficients of kinetic friction of ice on steel and of ice on ice have similar values, μk = 0.1−0.05 (for steel66,110 for ice 47 ). Given that steel has greater thermal conductivity than ice and thus a greater propensity to conduct frictional heat away from a sliding interface, even more melt water is expected when ice slides upon itself. Of greater relevance to the ice-on-ice material system is the observation (section on Dependence of μk upon velocity (5×10⁻⁸ to 10−1 m s −1) that upon rapidly sliding (at 10−3 to 10−1 m s −1) short distance following their formation at -10°C, shear faults possessed cohesion. The bonding probably developed as sliding-induced melt-water froze upon unloading. Further evidence of localised melting are the tiny, globular shaped features that appeared on the surface of Coulombic shear faults upon sliding at 8×10⁻⁴ m s −1 at -10 C. 50 We take those features to be frozen water.
To model this mechanism, we imagine that sliding on the scale of the asperities exhibits spatiotemporal character – analogous, perhaps, to the intermittent character of slip within crystals of ice through the action of dislocation avalanches.111,112 Accordingly, we imagine that certain asperities momentarily slip at a local velocity Vl that is greater by a factor f than the average applied velocity Vs, and that in slipping sufficient heat is generated to cause local melting. To prevent freezing, the time needed for the asperities to slip past each other ts must be less than the time needed tc to conduct the heat of fusion into the surrounding ice. The slip time scales with asperity diameter and inversely with velocity and the conduction time scales inversely with the temperature difference DT between the surface (at the equilibrium melting point) and the sub-surface. So the larger the asperity and the colder the ice, the faster must the ice slide to prevent the water layer from freezing.
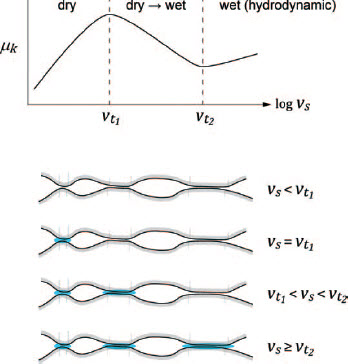
To find a relationship between DT, asperity diameter 2a and the applied velocity Vt1
at which weakening is first detected, we imagine a thin layer of water at the melting point, of thickness d; its heat content is πa2δLvwhere Lv denotes the latent heat of fusion per unit volume. That heat is conducted in time tc across an interface of area πa
2 and down a thermal gradient ΔT/Δz on either side of the interface; 


It is not easy to assess this analysis. Neither the factor f by which the local velocity is increased over the average velocity nor the layer thickness δ is known and only an average value of asperity size is available from the analysis of static strengthening given in the section on Static strengthening/aging. However, in the interests of a rough assessment, we take δ˜1 µm, based upon Colbeck's analysis
113
of snow friction, and we assume that f ˜ 100 (as might be the case for an avalanche-like de-pinning of asperities) With those assumptions and upon taking the values 2a˜30 µm (from the section on Static strengthening/aging), L v = 320 MJ m−3 ,k = 2.1 W m−1 K−1, ρ = 917 kg m−3 and Cp = 1.9 ×10
3
J kg−1 K−1 , equation (46) yields the estimate that Vt1
= 4×10⁻³ m s−1 for ice initially at −10°C for which ΔT=10. This estimate is greater than the observed transition velocity of ,1025 m s 21 noted from Fig. 11. However, asperities almost certainly range in size. In that case the first transition velocity Vt1 should be taken to indicate the velocity not at which contacts of average size melt, but the velocity at which the smallest ones melt. Correspondingly, the second transition velocity Vt2 should be taken to indicate the velocity a t w hich th e lar gest contacts melt, at wh ich point the entire contact area is wet. To obtai n estimate s o f these two limits, we substitute in to equat ion (46 ) the values Vt1
= 10−5 m s−1, Vt2
= 10−1 m s−1, f = 100 and ΔT = 10, and from the calcu latio ns shown in Fig. 16 obtain the results 2amin˜0.1 μm and 2amax˜1 mm. We caution against placing too fine a point on these limits. given their sensitivity to the factor f. Graph of first transition velocity
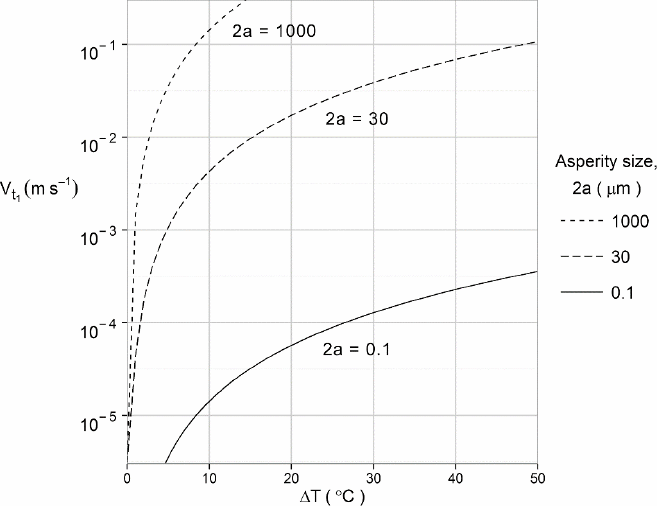
The model just described implies that the onset of velocity-weakening in sea ice is expected to be about an order of magnitude greater than in freshwater ice. The reason is that sea ice has greater heat capacity (i.e., Cp ˜30×10−3 J kg−1 K−1 at −10°C for sea ice of ˜5 ppt salinity 114,115 versus 1.9×10³ J kg−1 K−1; the values of density, thermal conductivity and latent heat of fusion are similar to those of freshwater ice). The experimental results shown in Fig. 12 for sliding across Coulombic shear faults support this view: although the coefficient of kinetic friction is higher than for sliding across ‘smooth’ surfaces, for the reason mentioned in the section on Dependence of μk upon roughness: natural versus prepared surfaces, velocity-weakening upon sliding across the faults at -10°C appears to begin at ˜10−4 m s −1 in sea ice, but at ˜10−5 m s −1 in freshwater ice. The heat capacity of colder sea ice is about the same as that of freshwater ice, 115 owing to the freezing of brine, implying that the effect just mentioned would not be expected at 2408C. The data shown in Fig. 12 are more scattered for sea ice, making a comparison for the colder ice less definitive.
If rapid heating through localised bursts in sliding continues to generate a thin layer of water on certain contacts as temperature decreases, then the model dictates that the velocity at which weakening begins is expected to increase with decreasing temperature. A drop from -10°C to -50°C, for instance, is expected to lead to an increase of about a factor of (50/10)2 = 25. The experimental results shown in Fig. 11 for sliding across a relatively smooth interface indicate that over this same range of temperature, the velocity at which the coefficient of friction reaches a maximum does increase, but by the smaller factor of ˜10. Results shown in Fig. 12 for sliding across Coulombic shear faults, on the other hand, indicate that over the range from -10°C to -40°C temperature exerts little detectable effect on the velocity at maximum friction. These observations do not necessarily invalidate the model, because in addition to scatter in the data neither set of experiments was performed at increments of sliding velocity small enough to allow a highly accurate and precise measure of transition velocity V t1 .0
To some extent, the localised melting mechanism described above is conceptually similar to the asperity retraction mechanism that we proposed to account for both velocity-strengthening and stick-slip of cold ice.Both mechanisms invoke a phase transformation accompanied by a volume reduction. The difference is that the ice I→II transformation involves both nucleation and growth and these stages are thermally dependent and hence kinetically limited. That is why, as already mentioned, the I→II process is thought to be of lesser relevance at higher sliding speeds where less time is available, leading to less frictional weakening and hence to macroscopically stable slip. Melting, in comparison, does not suffer from a barrier to nucleation and growth and so is not kinetically limited (barring the kinetics of heat transfer): higher speeds enhance the transformation, leading to more frictional weakening and to macroscopically unstable slip. Although developed to account for the friction of ice, the ideas involving phase transformations of one kind or another may have relevance to rock and other materials which, as already noted, also exhibit both velocity-strengthening and velocity-weakening.
Other explanations of kinetic friction
Maeno and Arakawa49 offer another interpretation of kinetic friction. Like the one just described, their model is based upon the thermally activated deformation of asperities, but includes sintering and hence cohesion. As already suggested, when combined with their definition of friction in terms of the stress ratio (equation (9), the presence of cohesive strength (as in Coulomb's law, equation (11))) suppresses velocity-strengthening. In other words, the model fails to capture a key characteristic of frictional sliding of warmer ice.
Hatton et al. 92 offer another interpretation, also based upon the deformation and localised melting of asperities in contact. Their model includes both ductile and brittle behaviour and incorporates a principle of maximum displacement for deformation normal to asperities and of minimum stress for failure under shear. Of particular note is the more realistic geometry of asperities – of size distributions, peak height distributions and radii of curvature. The model dictates that shear resistance to sliding exhibits both velocity-strengthening and velocity-weakening, showing a peak (in our words) at Vt ˜;10−2 m s−1 for sliding (presumably of freshwater ice) under a normal stress of σn = 114 kPa at -5°C. Hatton's model 92 thus captures the qualitative character of sliding. The problem is that it predicts peak resistance at a velocity around three orders of magnitude higher than observed (Fig. 11) and that it dictates zero shear resistance at sliding velocities lower than about 4×10⁻³ m s−1. Although experiment shows that the resistance tends towards a very low value as velocity becomes very low, at 4×10⁻³ m s−1 the coefficient at 210uC is relatively high and has the value μk *0.5–0.6.
Oksanen and Keinonen 65 present a different interpretation of velocity weakening, albeit of weakening over higher velocities from 0.5 to 3.0 m s−1. Over that range, the coefficient of kinetic friction scales as μk ∝V−1/2 and has the value, for instance, of ˜0.02 at -15°C at 0.1 m s−1. This behaviour is explained not in terms of the deformation of asperities at all, but in terms of thermal processes where the work of friction is equated to the sum of the heat conducted away from the sliding interface plus the energy expended in melting a thin layer of ice. The thin layer of water is assumed to be self-balanced in the sense that ‘increasing frictional heat would melt more water and if the water thickness increases the reduction in frictional heat would cause a temperature drop at the contact below the melting point of water (sic) and the heat produced by friction is equal to the heat conducted into the two solids’. 65 While Oksanen and Keinonen's model accounts well quantitatively for their observations and for those of Evans et al.116 that were obtained under similar conditions, this explanation cannot account for the velocity-weakening apparent in Fig. 11, for under the lower-velocity conditions under which the data in that figure were obtained, V−1/2 = 2 functionality would imply a friction coefficient of ˜ 3 at a velocity of 10−4 m s−1 at -15°C compared with the measured value of ˜ 0.5 (albeit at -10°C). (The difference of 5u could not account for this discrepancy, given the relatively small effect of temperature implied by the data in Fig. 11.) Perhaps there are two regimes of velocity-weakening of warm ice, one that operates over lower velocities and results from a combination of inelastic deformation and localised melting and another that operates over higher velocities and results from thermal processes alone.
Makkonen 103 and Makkonen and Tikanmaki 117 offer a completely different interpretation of kinetic friction, one based upon thermodynamics. Their idea is that the resistance to dry sliding is governed not by the shear strength of interacting asperities, but by surface energy. The theory is based on the view that kinetic friction is related to work spent in producing new surface at steps or ledges at the nanoscale. A key point is that the energy of the surface that simultaneously disappears is transferred as heat to the environment, because the thermodynamics at the contacts that are formed is unable to do mechanical work in the direction of slip. 103 For sliding under conditions where frictional heat is insufficient to melt a thin layer at the interface, i.e., dry sliding, the thermodynamic model expresses the coefficient of friction as μk = γ/Hλ, where γ denotes the surface energy of ice, H, hardness and λ, a nanoscale contact length. Although data for λ are not available, it is assumed 103,117 that this parameter is equal to the size of the smallest cluster of H2O molecules that is stable in the solid state which, based upon calculations by Pradzynski et al., 118 is of the order of λ = 2 nm. Taking this value and taking from Table 1 and Fig. 2 of Makkonen and Tikan-maki117 the values γ = 73 mJ−2 and H = 60 MPa (where 60 MPa corresponds to the hardness for an indentation time of ˜10−4 s 66 , which is about the amount of contact time t = λ/Vc to be expected for sliding at ˜ 10−5 ms −1 The problem is that the thermodynamic model does not account for velocity-strengthening. The only parameter in the model that exhibits rate depen-dence is hardness 66 and that dependence leads to a re-duction in the coefficient of kinetic friction during dry sliding and not to an increase with increasing velocity. An increase of two orders of magnitude in sliding vel-ocity, for instance, leads (from equation (40)) to an increase of about a factor of 2 in hardness and, thus, to an expected reduction in the friction coefficient of a dry interface by about the same factor. The thermodynamic model alone, therefore, cannot account for a major characteristic of frictional sliding. However, as noted in the section on Velocity-strengthening, the creation of new surface could contribute to the kinetic coefficient of friction during dry sliding, but at a lower level than estimated above.
Implications for ice mechanics
Brittle compressive strength
Returning to the role of friction in the brittle compres-sive failure of ice, it is interesting to note that, just as the coefficient of friction falls from a maximum to a mini-mum value over about four orders of magnitude of applied velocity, the brittle compressive strength falls from a maximum to a minimum over about four orders of magnitude of strain rate (for review of strain-rate softening of ice, see Ref. 1, Chapter 11). We think this correlation is not fortuitous. As discussed in the section on Relationship between friction and fracture: lessons from ice, frictional sliding underlies brittle failure and in the mechanistic-based relationships described there the unconfined compressive strength scales as σc ∝1/ (1−μk) for μk<1. This means that a reduction in the coefficient, from a maximum of μk = 0.6 to a minimum of μk˜0.02 at −10°C, is expected to lead to a reduction in strength by a factor of ˜2.5. This expectation is in good agreement with experiment, 18 which shows that the compressive strength, although scattered, falls by about the same factor within the strain-rate weakening regime from ˜10−4 to ˜1 s−1 at −10°C.
The other correlation between friction and fracture pertains to high-rate sliding and deformation. As noted above, at sliding velocities above about 0.1 m s21, the coefficient of kinetic friction of warm ice increases with velocity, from μk = 0.020 at 0.1 m s−1 to 0.03 at 3 m s−1, scaling roughly as μk ∝Vs 1/2; correspondingly, at strain rates above ˜1 s−1 the brittle compressive strength of warm ice increases with strain rate, 119,120 through the relationship1 σc = 9.8ε̇0.14 MPa (for strain rate in units of s−1). These are small effects and the scatter in the compressive strength is too large to allow meaningful quantitative comparison with the 1/(12mk) function. Nevertheless, the qualitative similarity suggests once again a fundamental link between friction and fracture. Should frictional sliding continue to be a significant factor in the compressive strength of ice under conditions of dynamic loading, fresh fracture surfaces would be expected to be wet. Indeed, there is now evidence 121 that fragments of ice that are created through Hopkinson bar experiments are wet.
On the strength of cold ice, Arakawa and Maeno 122 found that the unconfined brittle compressive strength of granular ice of ˜1 mm grain size upon loading at a strain rate of 4×10⁻⁵ s−1 increased by a factor of ˜2.2 upon lowering the temperature from -50 to -173°C, from ˜35 to ˜76 MPa. Some of that increase can be attributed to an increase in resistance to crack propagation, although that part, based upon discussion elsewhere,1 is expected to be rather small and to lead to an increase in strength by only a factor of ˜1.4. The other part can be rationalised in terms of friction and the discussion in the preceding paragraph. Accordingly, if it is assumed that each grain within the aggregate contained one crack of grain dimensions and that sliding across the faces of the cracks accounts for all in elastic strain, and assumed further that the sliding velocity is roughly equivalent to twice the product of crack length and applied strain rate, or ˜8×10⁻⁸ m s−1, then from Fig. 10, the appropriate values of the coefficient of kinetic friction are μk,−50 ˜0.3 and μk,−173 ˜ 0.4 Correspondingly, the friction-based increase in the compressive strength is expected to ˜([1/(1–0.4)]/[1– 0.3])˜1.2. The remaining factor of ˜2.2/(1.4×1.2)˜1.3 comes from confinement and from the influence of friction on the sensitivity of strength to confinement. Although the experiments by Arakawa and Maeno 122 were performed under uniaxial loading, the ice was actually constrained, for the specimens were bonded to copper platens whose ratio v/E (where v denotes Poisson's ratio and E, Young's modulus) differs by a factor of 10 from that for ice; i.e., v/Eice˜ 0.03 GPa−1; v/ECu˜ 0.003 GPa−1). As mentioned in the section on Relationship between friction and fracture: lessons from ice (equation (5)), confinement strengthens ice by an amount that depends not only on the degree of confinement, but also on the friction-dependent sensitivity to confinement. This sensitivity increases by a factor of ˜1.3 upon decreasing temperature from −50 to −173°C owing to the increase in the friction coefficient. In other words, by incorporating the effect of temperature on the coefficient of kinetic friction, essentially all of the difference in strength of ice at -50 and −173°C can be accounted for.
Sliding within the arctic sea ice cover
Satellite imagery has revealed evidence of strike-slip-like sliding within the sea ice cover on the Arctic Ocean, at velocities ⩽0.1 m s−1 (⩽10 km day−1), across fault-like features that can extend thousands of kilometres through the cover and that often form as intersecting sets. 13,33,123–127 The sliding is a major contributor to the deformation of the cover. Should its character on the geophysical scale mirror its character on the laboratory and the engineering scales, slip, once initiated, would be expected to be stable at lower velocities, but unstable at higher velocities. In other words, episodes of sudden slip would be expected as wind-driven driving forces buildup to the point where sliding velocity becomes high enough to impart velocity-weakening. Once the driving force is relaxed, stable deformation would be expected to resume. The winter ice cover, we predict, exhibits such behaviour.
The angle of intersection of the strike-slip-like sliding faults (also termed linear kinematic features by the ice-ocean community
124–126
) is around 2y = 35±15°.13,33
Should the faults be truly geophysical-scale Coulombic shear faults and should the intersecting features be conjugate sets oriented on either side of the direction of maximum compressive stress, as proposed,
13
theory holds that
128

The foregoing comments imply that the sea ice cover deforms intermittently and heterogeneously. Statistical analyses of ice buoy drift and examination of satellite-derived images 27,129–131 show that intermittency and heterogeneity are indeed characteristics of the deforming cover. Realisation of this character has led to the development of new sea ice models that directly incorporate friction within the context of a failure criterion. 85,132–138
As well as sliding within the plane of the cover, sea ice can slide over itself through a process termed ‘rafting’. In that scenario, sliding probably will be affected by the presence at the interface of slush and/or snow. The magnitude of the effect, however, is not known, for systematic studies on the role of snow or fragments of ice placed between sliding surfaces have just begun. 36
Tectonic evolution of icy satellites
Finally, consider the ‘tiger stripe’ rifts within the south polar region of Saturn's satellite Enceladus. 139–142 It has been suggested 143 that the water-rich and ice-rich plumes that are periodically emitted through the fractures 144 – 146 could be energised through frictional sliding of the icy crust and attendant heating, driven by diurnal, tidalbased cyclical shear along the faults. Two parameters would then be important: the coefficient of static friction, which sets the level of the driving shear stress to initiate sliding, and the coefficient of kinetic friction, which governs the shear stress needed to maintain sliding and to generate heat. If the coefficients are too high, then the mechanism cannot operate.
Smith-Konter and Pappalardo 147 and Olgin et al. 148 modelled the process. They invoked Coulomb's law, validated through the work reviewed here, assumed zero cohesion and assumed that the faults extend to a depth of 2 km within a spherically symmetric icy shell 24 km thick. When loaded under a diurnal shear stress of ˜45 kPa, a diurnal normal stress of ˜70 kPa and an overburden pressure of ˜200 kPa – a combination obtained from a numerical code 149 that gives tidalinduced stresses at any point on the surface of a satellite for both diurnal and non-synchronous rotation – the faults are expected to exhibit ‘slip windows’ during two parts of the 360u diurnal cycle, from ˜55° to ˜105° (left-lateral displacement) and from ˜195u to ˜255° (right-lateral displacement). This result was obtained using a static coefficient of friction of ms = 0.2. The windows narrow for a higher value, closing at μs⩾0.3.
Since the above analyses were performed, more is known about the friction of cold ice. Assuming (i) that water ice Ih is the primary constituent of Enceladus’ icy shell, even though spectroscopic data indicate the presence as well of hydrated salts, frozen gases, clathrates and possibly other minerals, 150,151 (ii) that small amounts of impurities and second phases do not greatly affect frictional resistance, (iii) that the sliding speed is ˜10−6 –10−5m s−1 , based upon a dis-placement of ˜0.5 m over a tidal period of 1.37 days,142,143 and taking the surface temperature at the south pole of Enceladus to be 2188 to2158°C or even higher, based upon results fromNASA's Cassini mission (http://www.nasa.gov/mission_pages/cassini/multimedia/pia06432.html), then the new knowledge indicates that the coefficient of kinetic fric-tion of cold (-175°C) ice is expected to be μk = 0.37±0.04 at 5×10⁻⁷ ms−1 , rising to μk = 0.53±0.04 at 10−5 ms −1. At -140°C μk =0.48±0.04 and at -100°C μ = 0.41±0.06, independent of velocity. Assuming further that holding under stress during the period of several hours outside the ‘slip windows’ when the rifts are closed does not begin to heal the faults, in the way that holding for up to ˜3h at -175°C and at -100°C under 60 kPa does not increase sliding resistance,31 then under the assumed conditions the static and kinetic coefficients are expected to have about the same value. The implication is that frictional sliding across Enceladus’ ‘tiger stripes’ may be more difficult than previously modelled.
Conclusions
From a review of the static and the kinetic friction of ice sliding slowly (<0.1 m s-1) on ice at temperatures from near the equilibrium melting point to -175°C, it is concluded: (i) that frictional sliding plays a fundamental role in the process of brittle compressive failure; (ii) that the coefficient of static friction increases with hold time under load through the process of creep and fracture of asperities in contact; and (iii) that the coefficient of kinetic friction at terrestrial temperatures increases with velocity over the lower end of the low-speed range, primarily through creep of interacting asperities and of underlying material, and then decreases with velocity over the upper end of the range through the progressive melting of larger and larger contacts.
Acknowledgements
The author acknowledges valuable discussions with Profs. Harold Frost, Knut Hoyland, Francis Kennedy, Lasse Makkonen, Aleksey Marchenko, Carl Renshaw and Jerome Weiss, as well as helpful comments from reviewers. The work was supported in part by the U.S.-Norway Fulbright Foundation through the award of the Arctic Chair 2013–2014 and by U.S. Dept. of the Interior-Bureau of Safety and Environmental Enforcement, contract nos. E12PC00033 and E12PC00064.
2. F. A. McClintock