
Abstract
The objective of this research was to study non-metallic inclusions during vacuum degassing in an ASEA-SKF ladle furnace. Five steel and top slag samples were taken before, during and after vacuum degassing for chemical analysis and scanning electron microscopy. It was concluded that the average CaO/Al2O3 ratios in the top slags became close to the phase C3A. The average CaO/Al2O3 ratios in the inclusions of this study were close to the phase CA6, but at the end of degassing, the average CaO/Al2O3 ratios in the calcium aluminates by subtracting the Al amounts of the inclusions that were assumed to form spinel phases with the available Mg amounts in the inclusions were situated between the phases C12A7 and C3A. By decreasing the S and Al contents of molten steel and at [S]3.[Al]2 less than around 10−7 , the ratio of calcium aluminates to spinels increased continously. It was finally concluded that by increasing the Ca amount in inclusions, their equivalent circle diameters grew, and their aspect ratios went toward unity, and when the amount of Ca measured in the inclusions was more than ∼25 wt-%, inclusions with bigger equivalent circle diameters appeared.
Introduction
One of the continuing interests at Ovako Hofors AB is in decreasing the total oxygen (TO) content of steels. It is known that the rolling contact fatigue life of steel products may be reduced due to oxide inclusions, even when the TO content is below 10 ppm.1 The destructive effects of oxides on the fatigue properties of some steels are assumed to be very dependent on their respective chemical compositions, volume fraction, dispersions and morphologies.2 – 4 Usually, large, unbreakable oxides are the most unwanted ones, and because they are potential sites of stress concentrations, they could cause early fatigue failures. On the other hand, small, breakable ones or those with low melting temperatures are preferred.3, 5, 6
Vacuum degassing in a ladle treatment unit is known to be one of the most crucial stages in the steelmaking process because at the end of vacuum degassing, final alloying, deoxidation, desulphurisation and inclusion removal must be achieved. Vacuum degassing should remove the unwanted non-metallic inclusions as much as possible and result in a cleaner, more homogeneous steel melt. However, it is not easy to calculate the optimised vacuum degassing time that would lead to the most favourable results. Generally, because of the negative effects on the production capacity and consumption of resources, unless lower degassing time might be harmful for steel cleanness, long degassing times should be avoided.
A literature survey has suggested that many researchers had already studied and discussed different aspects of the development of non-metallic inclusions in molten steels;7 – 29 however, most of these researchers focused on the development mechanisms and affecting factors on the time dependant behaviour of inclusions during ladle treatment in a laboratory scale. This article is an attempt to follow the previous publications30, 31 by studying the behaviour of non-metallic oxide inclusions during the vacuum degassing process by experimental sampling and analysing in a real production plant in order to present more detailed analysis of the inclusions behaviour during vacuum degassing.
Steel melting plant of Ovako Hofors AB
Figure 1 presents the general schematic of the steel melting plant of Ovako Hofors AB and the respective sampling occasions in this study. Scrap is melted in the 100 t, bottom tapped electric arc furnace; molten metal is tapped into the ASEA-SKF ladle furnace station; then ferro-silicon and ferro-aluminium are added during steel tapping; molten steel is deoxidised; then the slag that is the result of this deoxidation is skimmed; and the ladle sent to the ladle treatment station. In the ladle furnace, synthetic top slag mainly composed of CaO and Al2O3 is added, then the melt is desulphurised and deoxidised and its alloying composition adjusted, vacuum degassed to reduce the hydrogen level of melt, gas and magnetic stirred, possibly reheated and finally, after the temperature of the melt is adjusted to the preferred temperature, poured into 24 ingots with the capacity of 4·2 t each.
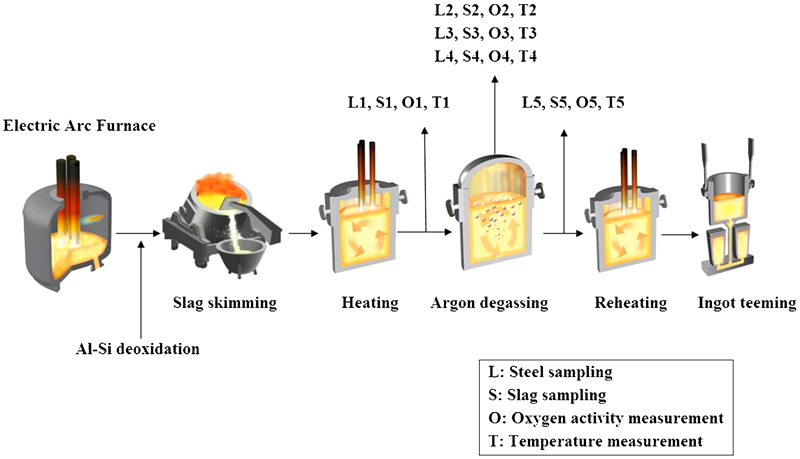
Melting plant schematic of Ovako Hofors AB and respective sampling occasions for this study
Methods
In this study, it was desired to follow the behaviour of non-metallic inclusions during vacuum degassing; thus, one steel heat grade SAE 52100 with the nominal chemical composition in Table 1 was chosen. Then, as presented in Fig. 1, five argon protected steel samples at five different occasions before, during and after the vacuum degassing process were taken; at the same time of steel sampling, slag samples were taken, and oxygen activity and temperature of molten steel were also measured.
Nominal chemical composition of steel grade SAE 52100/wt-%
*Rest is Fe.
In order to perform the sampling during degassing, the vacuum was interrupted three times for a short period of time for sampling, and then the degassing process was continued. An in-house designed sampler was applied for liquid sampling of steel during vacuum degassing with argon protection.32 This sampling device allows operators to put aside the top slag layer on the molten steel by blowing argon gas and suck molten steel into a sampler. The sampling position was the middle part of the ladle, and during sampling, neither argon blowing nor magnetic stirring was applied. At the same time, another operator took the top slag samples and another applied the Celox instrument33 in order to measure the oxygen activity and temperature of the molten steel. Then, by means of instrumental analysis and scanning electron microscopy (SEM), all of these samples were later analysed and the results documented.
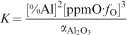
It was also decided to compare the measured results of oxygen activity with the calculated results. For the calculations, equations (1)–(4)34 were applied. Equation (3) was introduced by Turkdogan and designed to give the true oxygen activities of the molten steel by considering the electromotive correction factor for the disposable electrodes.34 Al2O3 activities necessary for these calculations were considered as 1.35
Equation (4) is valid at low aluminium contents: f
Al≈1 (Ref. 34)

Sample analysing methods
All five steel samples were tested by two instruments: OES ARL 4460 Metal analyser from Thermo Fisher Scientific Inc. was used for metal analyses, and a Leco CS-444 was used in order to analyse the sulphur and carbon contents of the samples. This instrument works based on the carbon–sulphur combustion method (ASTM E1019). A Leco TC600 was used in order to analyse the TO of the samples, and all slag samples were analysed by an X-ray fluorescence (XRF) spectrometer instrument PANalytical AxiosmAX-Minerals.
In order to measure the oxygen activities and temperatures of the molten steel at the respective occasions of sampling during the vacuum degassing process, a Celox instrument33 that was equipped with commercial consumable MgO stabilised ZrO2 electrode was applied.
It is worthy to mention that according to Turkdogan,34 at low oxygen activities in Al deoxidised steels, the measured oxygen activity might be within a factor of 2 higher than the true equilibrium oxygen activity of molten steel. The higher measured oxygen activities are suggested to be because of the partial electronic conduction of the MgO stabilised ZrO2 electrodes in molten steel that would result in higher electromotive force;34 however, some other researchers claimed that Celox33 already applies a correction factor that should consider this partial electronic conduction.36 – 38
For SEM analysis of the steel samples, an analytical scanning electron microscope Leo Supra 35 was applied, and for the analysis and classification of non-metallic inclusions, using energy dispersive X-ray microanalysis, the INCA Feature software39 that was specifically developed for analysis and classification of steel inclusions was used.
Results
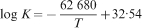
Figure 2 presents the pressure state of the ASEA-SKF ladle furnace at the sampling occasions of this study. From this figure, it can be seen that the first sample was taken before starting the degassing process or after putting the synthetic top slag on the molten steel, three other samples were taken with average 15 min intervals from the start of the degassing and the final sampling was performed at the end of the degassing process. The entire vacuum degassing process took ∼57 min.
Pressure (torr) at sampling occasions versus time (min) passed from start of degassing process
Tables 2 and 3 respectively show the chemical composition of steel and top slag samples at different sampling occasions. In Table 2, the balance is Fe.
Chemical composition of steel samples/wt-%
Chemical composition of top slag samples/wt-%
Figure 3 shows the measured temperature of molten steel during processing.
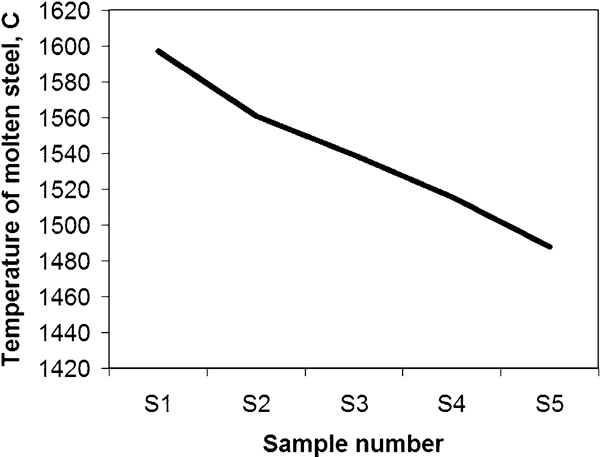
Temperature (°C) of molten steel versus sample number
Table 4 presents the areas of the observed surfaces (by SEM) of each of the five steel samples in this study.
Area size of scanned surfaces of each sample
Individual results of each sample during degassing
By considering the individual observations of each sample at five different sampling occasions, it was possible to produce Figs. 4–7. Figure 4 presents the average amount of Al, Ca and Mg measured by SEM in non-metallic inclusions observed in each of the five samples of this study, and Fig. 5 presents the average area, width and length values of the observed inclusions in each one of the samples.
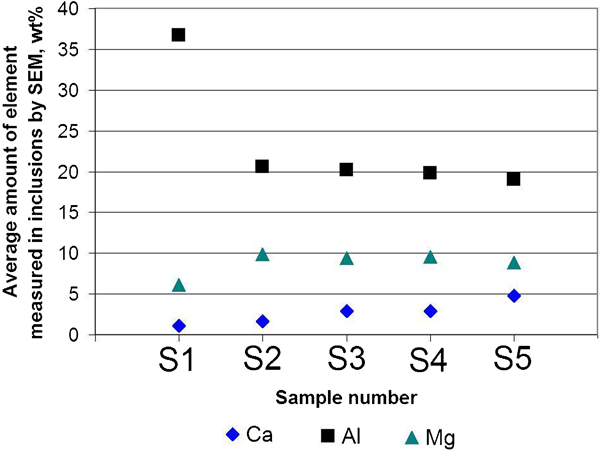
Average amount of some elements versus sample number
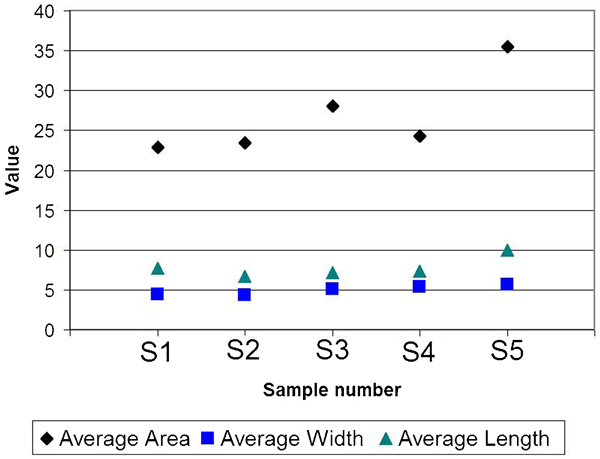
Some values achieved by SEM versus sample number
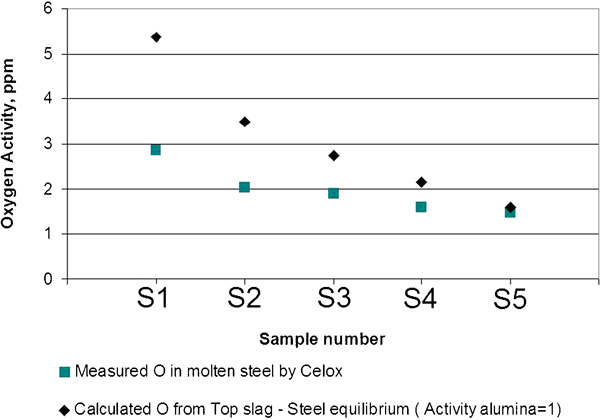
Calculated and measured oxygen activities versus sample number
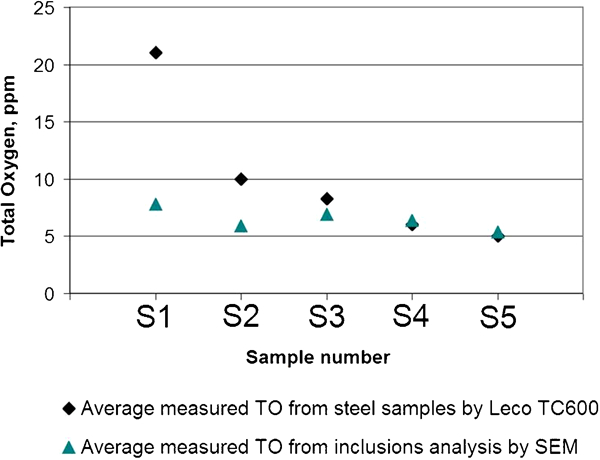
Total oxygen versus sample number
Figure 6 shows the measured and calculated oxygen activities of molten steel, the calculated oxygen levels were from Turkdogan’s equation,34 by assuming top slag–steel equilibrium (alumina activity was considered as 1),35 and Fig. 7 presents the measured amounts of TO achieved from instrumental analysis (Leco TC600) and SEM analysis of inclusions. The TO amounts achieved by inclusion analysis are the average amount of the measured oxygen level in each scanning field during SEM observations, i.e. by considering the measured oxygen in each scanned field, the average TO in ppm was calculated.
Figures 8–12, which are made by the INCA feature software39 analysing the SEM results of each sample, show the chemical compositions of all oxide inclusions normalised to the ternary diagram of Al2O3–CaO–MgO considering their equivalent circle diameters (ECDs). It should be mentioned that due to the very fast cooling rate of the samples, sulphide inclusions were not considered in this study. The legend of these figures presents the ECDs of the inclusions.
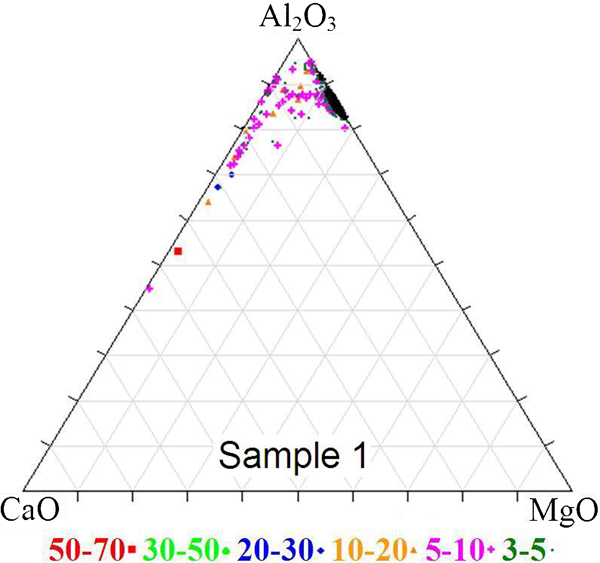
Oxides observed in S1, before start of degassing
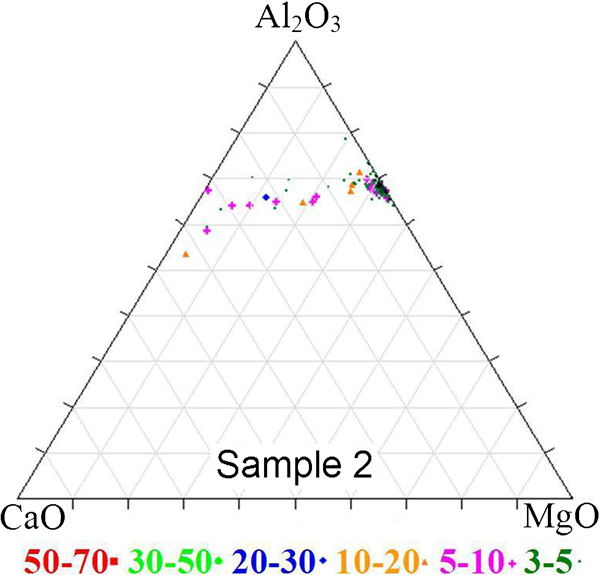
Oxides observed in S2, ∼15 min after start of degassing
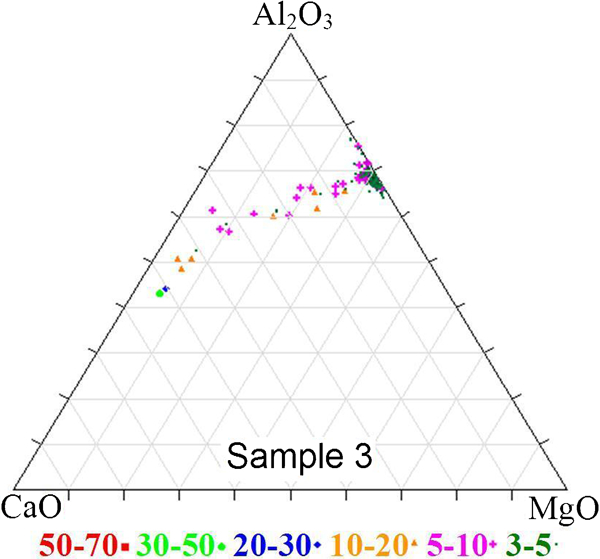
Oxides observed in S3, ∼27 min after start of degassing
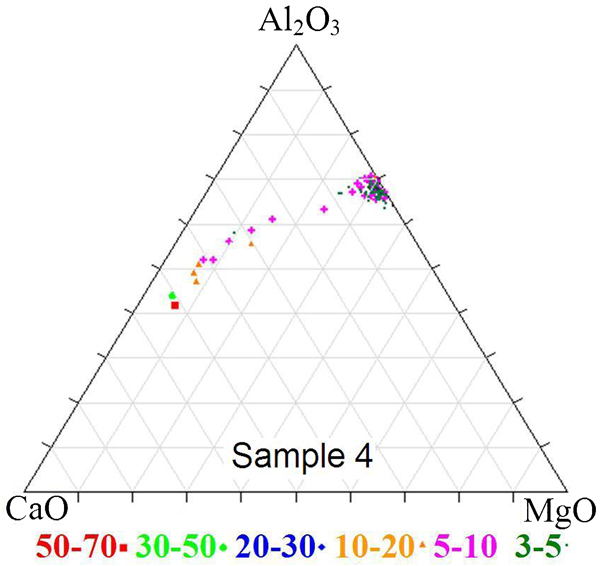
Oxides observed in S4, ∼45 min after start of degassing
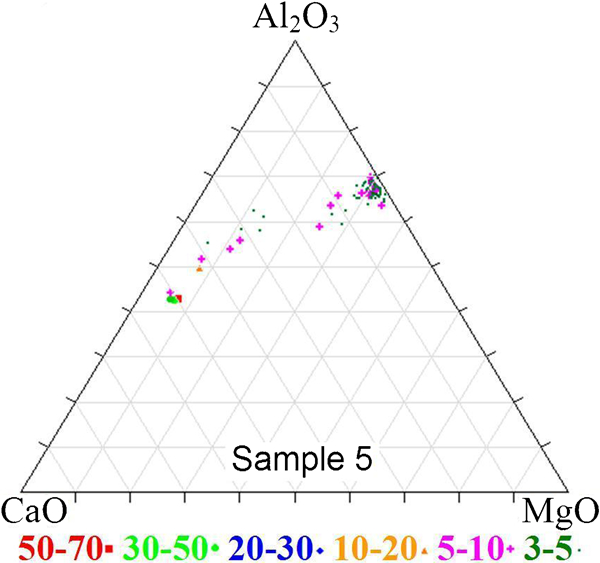
Oxides observed in S5 at end of degassing
Figure 13 shows the measured and calculated amounts of Al2O3 normalised to the binary system of CaO–Al2O3 and their positions compared to the binary phase diagram of CaO–Al2O3. The Al2O3 amounts are measured in either top slag or inclusions (average measured in all inclusions were considered) at each sampling occasion. Regarding the Al2O3 amounts of inclusions, just calcium aluminate inclusions were considered, and two approaches were used. First, the average Al2O3 in the binary system of CaO–Al2O3 were shown as they were measured by SEM. Second, the average Al2O3 in the binary system of CaO–Al2O3 were shown by deducting the amount of Al that was assumed to bound with 100% of available Mg in the inclusions and would form spinels; i.e. it was assumed that 100% of the available Mg in inclusions would bound with enough amount of Al in inclusions necessary for forming MgAl2O4 phase, and the rest of the Al would, together with the available Ca, form calcium aluminates.
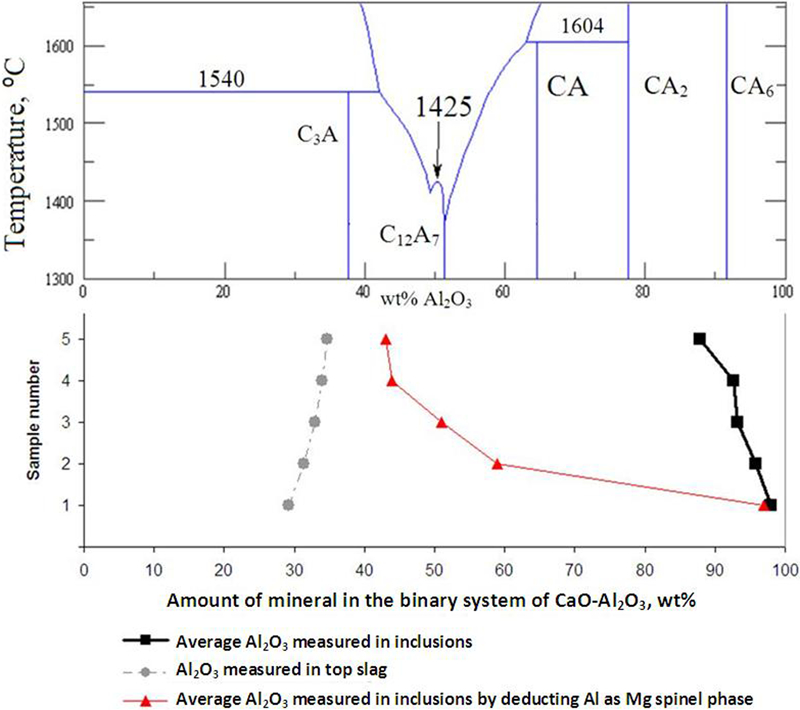
Amounts of Al2O3 normalised to binary system of CaO–Al2O3 in inclusions (average measured in all inclusions) and top slag in different samples and their respective position compared to binary phase diagram of CaO–Al2O3 (Ref. 40)
Combined results of all samples during degassing
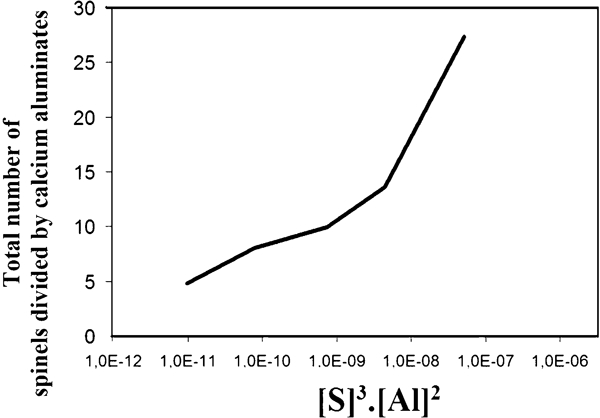
By considering the combined results of all samples, five figures were made; Fig. 14 presents the total number of spinels measured in all of the samples divided by the total number of calcium aluminates measured in all samples versus the amount of S3 times by Al2 in molten steel. Figures 15–18 present the effect of the measured Al and Ca amounts of the inclusions on the ECDs and aspect ratios of all observed inclusions in all of the steel samples of this study.
Oxides ratios versus [S]3.[Al]2 in all five samples of this study
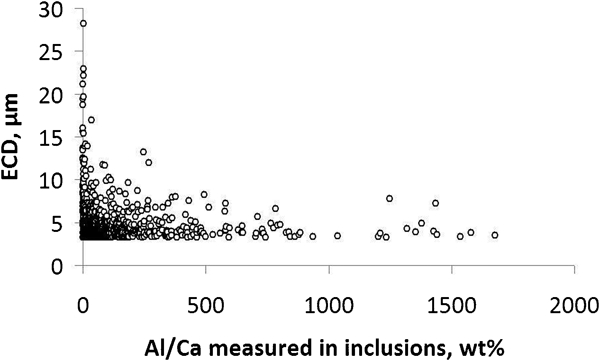
Equivalent circle diameters of all inclusions versus Al/Ca ratio of inclusions in all five samples
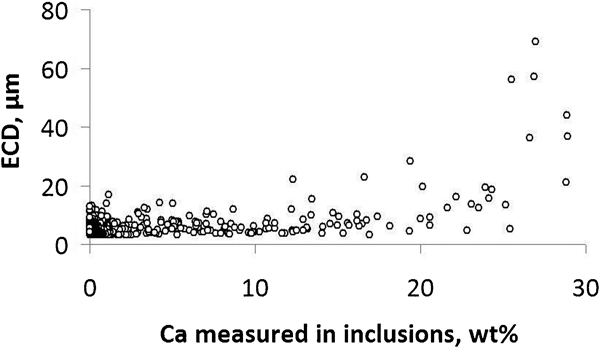
Equivalent circle diameters of all inclusions versus Ca amount of inclusions in all five samples
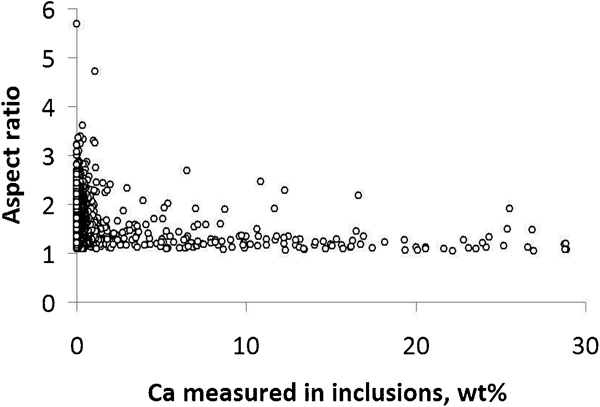
Aspect ratio of all inclusions versus Ca amount of inclusions in all five samples
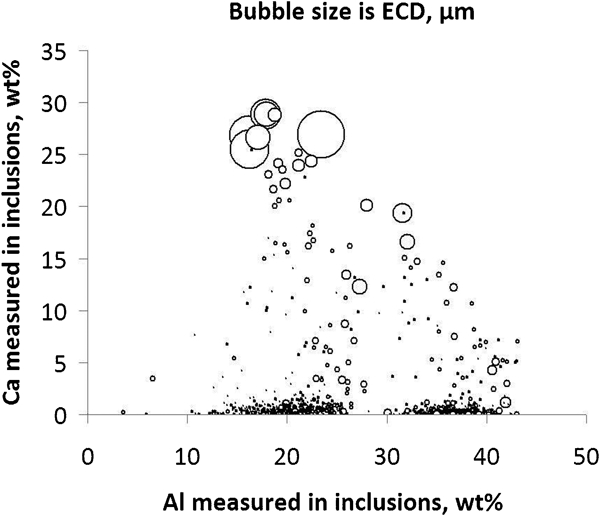
Ca versus Al amounts measured in inclusions: bubble sizes present ECDs of all inclusions in all five samples
Discussion
This study was designed to follow non-metallic inclusions during vacuum degassing in an ASEA-SKF ladle furnace. Considering Figs. 4 and 5, it could be said that vacuum degassing was a dynamic process during which the inclusions were changing constantly. From Figs. 6 and 7, and regarding the oxygen levels, it could be concluded that the theoretical calculations seem to be closer to the measured results at the final stages of vacuum degassing, i.e. in the final stages of degassing inside the treatment ladle, the average population of inclusions tended to reach some semi-equilibrium points, that is why theoretical calculations that have the assumption of equilibrium in the slag–steel system generated more accurate results at the final stages of degassing.
From Figs. 8–12, it was concluded that spinels and calcium aluminates were the main inclusion types during the entire vacuum degassing process, and at the latest stages, they tended to make two more specific populations. It should be noted that in sample 1 or before starting the degassing process, or after adding synthetic top slag to the ladle, some almost pure alumina inclusions were observed, but over time they changed to spinels. It was believed that the Mg necessary for changing alumina inclusions came from the MgO–C ladle bricks and also the Mg that came from an unwanted leftover top slag from previous slag skimming. In these figures, it was also observed that by increasing the Ca level of inclusions, larger inclusions could be seen.
From Fig. 13, it could be concluded that the CaO/Al2O3 ratios of top slag and inclusions were not the same, or there were large differences between CaO and Al2O3 ratios measured in the inclusions compared with the amounts measured in the top slag. Obviously, inclusions had much more Al content, but the top slag had much more Ca content. However, it should be mentioned that other elements like Mg were very often combined with the Al in inclusions and formed spinels, and that might be the reason that the Al content of the inclusions are so high. That is the reason that in Fig. 13 the results achieved by considering the possibility that Al would bind with 100% of Mg available in the inclusions before forming calcium aluminates were also considered. The average CaO/Al2O3 ratios in the inclusions, as they were measured by SEM, were close to the phase CA6; however, the average CaO/Al2O3 ratios in the calcium aluminate inclusions by deducting the Al amounts of the inclusions that were assumed to form spinel phases with the available Mg amounts in the inclusions at the end of the degassing process became close to the phases C12A7 and C3A. The average CaO/Al2O3 ratios in the top slags were close to the phase C3A.
From Fig. 14, it could be seen that during the entire degassing process, spinels and calcium aluminates were present; however, by reducing the S and Al content of the molten steel, spinels tended to form calcium aluminates; hence, the total number of spinels divided by calcium aluminates decreased. It could be concluded from this figure that by decreasing the S and Al content of molten steel and at [S]3.[Al]2 around 10−7, the calcium aluminates to spinels ratio increased continuously. From this figure, the importance of the amount of S and Al in molten steel on the appearance of calcium aluminates could clearly be seen, i.e. by reducing S and Al of molten steel, the inclusion population shifts toward more calcium aluminates instead of spinels.
Considering Figs. 15–18, it was observed that in all scanned samples and independent from sampling occasions, by increasing the Ca amount of inclusions or reducing the Al/Ca ratios in the inclusions, their ECDs grew, and their aspect ratios went toward unity (they tended to become spherical). It was also observed that when the amount of Ca measured in inclusions was more than ∼25 wt-%, inclusions with bigger ECDs appeared.
Conclusions
Vacuum degassing was a dynamic process during which the inclusions were constantly changing.
Spinels and calcium aluminates were the main inclusion types found.
The average CaO/Al2O3 ratios in the inclusions, as measured by SEM, were close to the phase CA6.
At the end of degassing, the average CaO/Al2O3 ratios in the calcium aluminate inclusions, by deducting the Al amounts of the inclusions that were assumed to form spinel phases with the available Mg amounts in the inclusions, were close to the phases C12A7 and C3A.
The average CaO/Al2O3 ratios in the top slag were close to the phase C3A.
By decreasing the S and Al content of molten steel and at [S]3.[Al]2 around 10−7, the calcium aluminates to spinels ratio increased continuously.
By increasing the Ca content of inclusions or reducing their Al/Ca ratio, their ECDs grew, and their aspect ratios tended towards unity.
When the amount of Ca measured in inclusions was more than ∼25 wt-%, inclusions with bigger ECDs appeared.