
Abstract
The surface cleanness of Ti-IF steel, including head, transition, end and normal slabs, was studied by original position analyser. The content, number, size and porosity of inclusions on the surface were obtained. The results showed that: the contents of inclusions in head and end slabs were significantly higher than in normal or transition slabs and fluctuated significantly in non-steady state slabs within 3.5 mm of the surface; the porosity in 3.5 mm of slab surface was lower than other positions; the surface cleanliness order was normal slab>transition slab>end slab>head slab; a reasonable surface peeling thickness for non-steady state slabs was 3.5 mm. The energy dispersive spectroscopy showed that more lump Al2O3 existed in the head slabs, and slag entrapment inclusions also appeared frequently in the end slabs. The main effect factors for cleanness of the head and end slabs were reoxidation and slag entrapment.
Introduction
Steel cleanliness includes chemical cleanliness and metallurgical cleanliness. Chemical cleanliness deals with the harmful and trace elements in steel, whereas metallurgical cleanliness deals with non-metallic inclusions, especially macroinclusions, which could influence the properties of steel products and result in defects. Cleanness control is becoming ever more important as steel quality demands increase,1,2 and how to reduce and remove them is a key technology.3 – 5
This paper focused on the surface cleanness evaluation of Ti-IF steel slabs by original position analyser (OPA) and SEM/energy dispersive spectroscopy (EDS), and an appropriate thickness for surface removal to remove defects is proposed based on experimental results.
Experimental
Experiment process
The experiment was carried out in a slab caster at Shou Gang Qian’an Iron and Steel Works (see Table 1). In order to compare the surface cleanness of the different types of slabs, samples were taken from head slab (casting start slab), end slab (casting end slab), transition slab (ladle exchanging slab) and normal slabs (steady casting slab) of Ti-IF steel. Samples of size 100×60×40 mm for OPA testing were machined as shown in Fig. 1. Before the sample preparation, the slab surface was descaled, and the thickness of the scale layer was ∼0·5 mm.
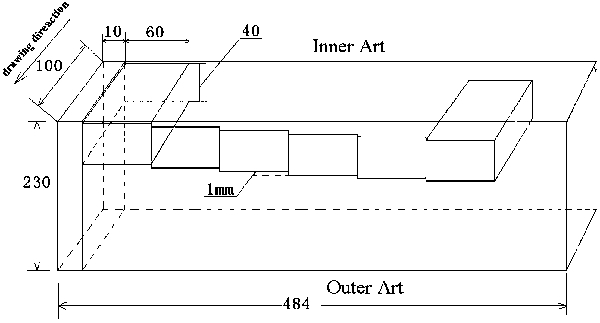
Sampling scheme in slab for OPA analysing
Main values of slab caster
Because the slab caster is a vertical bend type, the top surface cleanness of slabs is inferior to that of the bottom surface, so this paper only investigated the top surface of the slab. The content, number and size of the inclusions and the porosity of steel were analysed by OPA.6 The morphologies, compositions and classification of inclusions were studied by a special depth erosion method and SEM/EDS.
Experiment method
The OPA, which is based on single discharge analysis and a continuous scanning excitement spark spectrum without preexcitement, can be applied effectively to analyse the original position statistical distribution of components. Other information of the material, such as the inclusions on different positions in the material and the distribution of the size of the inclusions, can also be obtained based on the spark spectrum data.6 – 8
The OPA-100 operation values are listed in Table 2. Inclusion content was relevant with abnormal spark frequency and intensity, as expressed in equation (1). The sizes of inclusions were related to the abnormal spark intensity, as expressed in equation (2). The porosity represented the homogeneity of the sample. As the porosity increases, the homogeneity decreases. It can be expressed as equation (5)


Operation values of OPA
Metallographic samples were machined into rectangular pieces (15×15×10 mm thickness). These samples were polished by SiC papers and diamond suspensions, and then the observation surface was immersed in electrolytic solution, which was composed of bromine water and acetone (1∶1) with 10 wt-%HCl (<1%). The erosion depth was controlled by equations (6)–(8). The electrolytic current was controlled between 0·05 and 0·20 A; after erosion, the samples were immersed in hot water to remove the residual electrolytic solution and then dried. After metallographic preparation, the three-dimensional morphologies were observed under SEM.
The Al2O3 inclusions in steel are often surrounded by small cavities, which might be due to the high surface tension between solid Al2O3 and liquid steel.9 It was hard to observe the true morphologies of the irregular Al2O3. Some researchers studied the three-dimensional morphologies of inclusions by extracting,10,11 but this was time consuming, and the inclusions’ separation was also hard. The depth erosion method can be regarded as local extraction and is a much quicker operation


Results and discussion
Inclusion content of surface layer
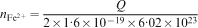
The inclusion contents fluctuated markedly within the first 3·5 mm of the surface but were stable deeper than 3·5 mm with a quality order of head slab>end slab>transition slab>normal slab, as shown in Fig. 2. The inclusion contents in the head and end slabs were higher than transition and normal slabs, and the transition slab was equivalent to the normal slab after 3·5 mm of the surface.
Inclusion content in different surface layers
Inclusion size distribution of surface layer
To determine the numbers of inclusions with different sizes, some assumptions were proposed:
assume the total inclusion number caused by abnormal spark as N Total in the scanning area
the scanning area was defined to be a (the scanning length)×b (the scanning width)
the size of inclusion that was calculated by OPA was considered to be a sphere with size φ i.
The N
Total can be resolved by equation (9) based on the above assumption, equations (1) and (2) and the inclusions’ size distribution of OPA calculation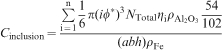

Figure 3 shows that the inclusion number with size 5–15 μm remained stable below 3·5 mm from the surface, and the average inclusion numbers were 4·88, 2·62, 1·80 and 1·64 mm−2 in the head, end, transition and normal slabs respectively. The inclusion number with size 5–15 μm in the head slab was about twice that in the end slab and three times of that in transition or normal slabs.
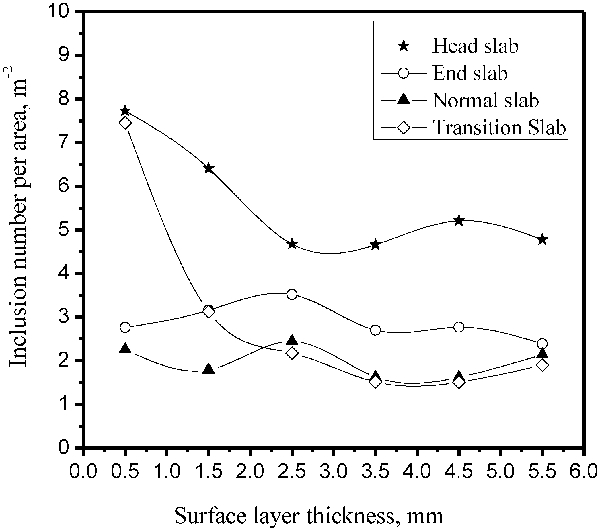
Inclusion number per area with size 5–15 μm
The average inclusion numbers with size larger than 15 μm were 0·58, 0·43, 0·35 and 0·34 mm−2 in the head, end, transition and normal slabs respectively after 3·5 mm of the surface layer, as shown in Fig. 4. Although the inclusion number with size larger than 15 μm decreased significantly compared to that with size 5–15 μm, the detriment is still very detrimental due to their large sizes.
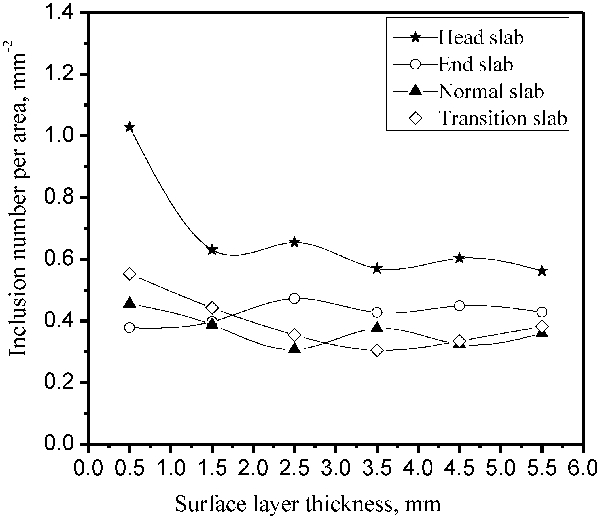
Inclusion number per area with size >15 μm
The inclusion number remained stable below 3·5 mm of the surface with an order of head slab>end slab>transition slab and normal slab, as shown in Figs. 3 and 4.
Porosity distribution of surface layer
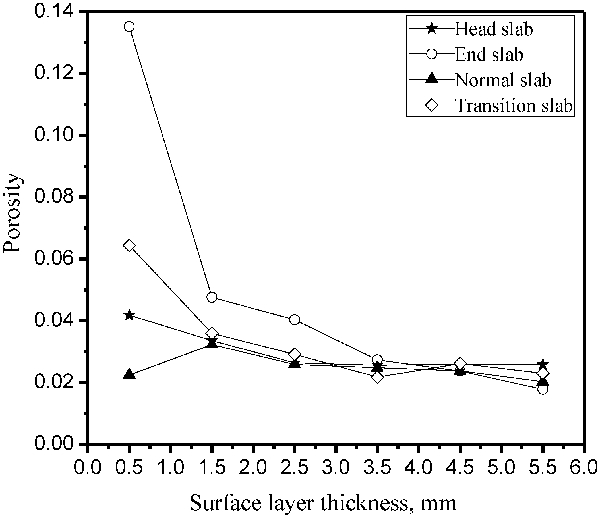
The results described indicate that the reasonable surface removal thickness should be 3·5 mm. In order to judge whether the thickness was proper, the surface porosity was analysed, as shown in Fig. 5.
Porosity of surface layers
The porosity at 0·5 mm of the surface is higher in the head than that in the end and transition slabs with average porosity values of 0·0418, 0·1351 and 0·0644 respectively, as shown in Fig. 5. The average porosity of the normal slab was 0·0224, which was lower than the non-steady slabs. The positions where porosity was high aggregated many inclusions in the head and transition slabs. The typical area distributions of inclusion and porosity are shown in Fig. 6a and b . There was no obvious inclusion aggregation in the end slabs, and typical distributions of inclusion and porosity are shown in Fig. 6c and d . Trapped gas bubble or slag entrainment may be the main reason for the porosity in the end slabs.
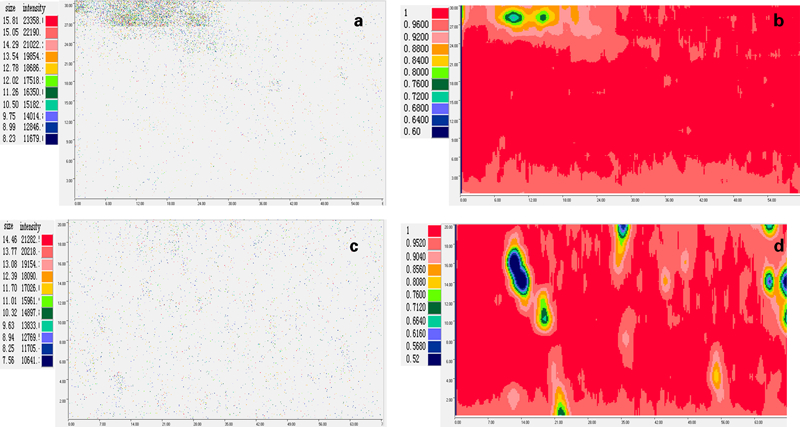
Typical area distribution of inclusion and porosity in slab surface
At the 3·5 mm surface layer, the average porosity values of the head, end, transition and normal slabs were 0·0256, 0·0273, 0·0217 and 0·0248, which are all very similar. The porosity results also indicated that 3·5 mm was an appropriate thickness for surface layer removal.
Morphologies and compositions of surface layer
In order to analyse the compositions and types of inclusions on the surface, metallographic samples ranging from 0·5 to 5 mm of the surface were machined; the morphologies of the inclusions were observed by SEM/EDS, as shown in Fig. 7.
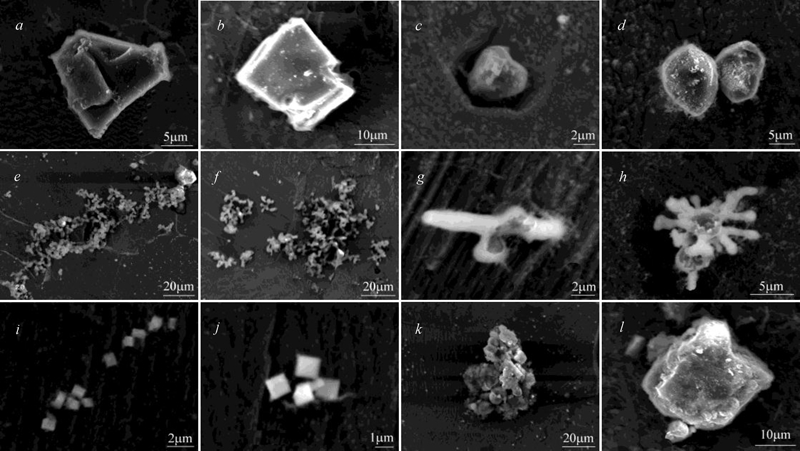
Different types of inclusions in slab surface layer
The main types of inclusions in each layer were basically the same, but the number of different types of inclusions distributed differently. Most of the inclusions were Al2O3 with different morphologies; Al2O3 was mainly formed as a product of deoxidation, but the morphologies of Al2O3 had a relationship with Ofree (free oxygen before deoxidation), aluminium addition and molten steel state (stirring or static). The following summarises the main types of inclusions observed in the surface layers:
lump Al2O3, which is more likely produced during reoxidation,12 with size of 20–50 μm, as shown in Fig. 7a and b
granular Al2O3, whose composition was mainly pure Al2O3, with size of 2–5 μm, as shown in Fig. 7c and d
cluster Al2O3, which was composed of 1–5 μm spherical or rod-like Al2O3, as shown in Fig. 7e and f ; the size of the big cluster Al2O3 ranged from tens to hundreds of micrometres, and the composition was mainly Al2O3 with seldom TiOx [Ti/(Ti+Al) = 0·02–0·08]
coral- or rod-like Al2O3, whose composition was similar with that of cluster Al2O3, but the size was smaller than that of cluster Al2O3, as shown in Fig. 7g and h
TiN or TiN–Al2O3 particles, which precipitated abundantly after 1·5 mm of the surface layer during the solidification, as shown in Fig. 7i and j , with size below 3 μm
inclusions from slag entrainment, whose composition contained K, Ca, Na, Al, Si, etc. elements, as shown in Fig. 7k , or extraneous MgO.xCaO inclusion with irregular shape, as shown in Fig. 7l , which may come from the refractory.
Figures 8 and 9 show the inclusion index for the different types of inclusions in the surface layers. Here, TiN or TiN–Al2O3 inclusions were ignored for statistics because of their small size and not a deoxidation product.
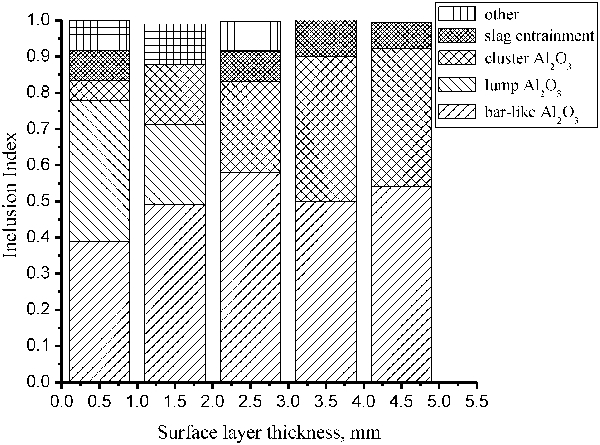
Inclusion distribution of head slab surface layer
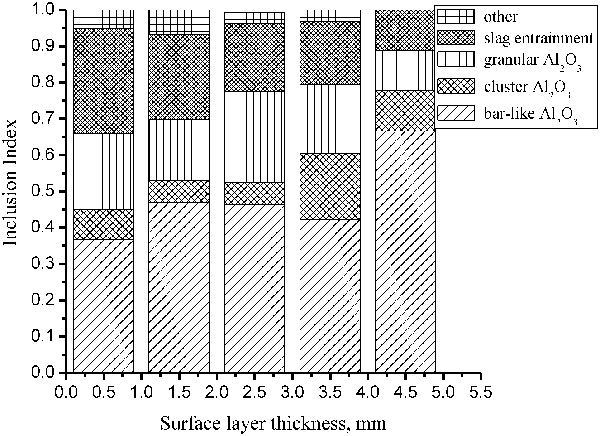
Inclusion distribution of end slab surface layer
As Fig. 8 shows, the main inclusions were rod-like and lump Al2O3 at 0·5 and 1·5 mm of the surface in the head slab; the summations of these two kinds of inclusions were 76·70 and 71·20% respectively. Deeper than 1·5 mm from the surface, the main inclusions were rod-like and cluster Al2O3, which occupied above 70% of the total inclusions. The lump Al2O3 was mainly distributed at 2·5 mm and caused by reoxidation during the casting start; the inclusions from slag entrainment took up to 7–8% in each layer.
The main types of inclusions deeper than 3·5 mm in the end slab were rod-like Al2O3, granular Al2O3 and slag entrainment, which occupied above 85% of the total inclusions, as shown in Fig. 9. The inclusion ratio from slag entrainment decreased from 29·17% at 0·5 mm from the surface to 17·27% at 3·5 mm from the surface. Cluster Al2O3 increased gradually as the thickness increased.
The main inclusions were granular and cluster Al2O3 in normal and transition slabs. The lump Al2O3 mainly appeared in head slab, and slag entrainment inclusion mainly existed in the end slab. Thus, the effect factors for head and end slab cleanness were reoxidation and slag entrainment respectively.
At Shou Gang Qian’an Iron and Steel Works, before surface removal of the head and end slabs, the slabs were downgraded and not used for high quality automotive sheet. Base on the above results, 3·5 mm is now removed, and the surface quality of the final rolled sheet has been improved. In addition, after surface removal, they could be hot rolled for galvanised sheet with average defect ratio of 2·83% in the head and end slabs and 1·89% in the normal slabs.
Conclusions
The number, size and porosity of the inclusions for different kinds of Ti-IF steel slabs were analysed by OPA. A special depth erosion method was adopted to observe the morphologies of inclusions. Experimental results were summarised as follows.
The inclusion content in the head and end slabs was higher than that in normal and transition slabs.
The inclusion content fluctuated markedly from the surface down to 3·5 mm and then tended to be stable thereafter.
The matrix was looser in the outer 3·5 mm.
The effect factors for head and end slabs cleanness were reoxidation and slag entrainment respectively.
An appropriate thickness for the cleaning surface layer was 3·5 mm.
The removal of 3·5 mm from the top slab surface has reduced the quantity of downgraded slabs and improved the strip quality.