
Abstract
The aim of this work is to investigate and analyse the microstructure and mechanical properties of dissimilar low carbon steel/dual phase steel (DP600) resistance spot welds. The failure modes of spot welds during the tensile–shear test were detailed by examination of the weld fracture surfaces. Relationships between the fracture path and the mechanical properties (peak load and energy absorption) were developed using the observed microstructures in the fusion and heat affected zones. It was found that the failure of DP600/low carbon steel is initiated from the stronger side (i.e. DP600 side). This was explained in terms of hardness profile, difference in tensile strength and workhardening behaviour of the base metals. A transition in the failure mode from interfacial failure mode to pullout failure mode was observed with increasing the fusion zone size caused by increasing the welding current. However, when expulsion occurred, the spot welds failed in the partial thickness–partial pullout mode, with reduced energy absorption and peak load, compared to those spot welds with the same or smaller nugget size, which failed in the pullout mode. This can be related to the low ductility of the location of the failure initiation (i.e. heat affected zone of DP600 side) in this mode.
Introduction
Dual phase (DP) steels possess a unique microstructure consisting of soft ferrite and hard martensite that offers favourable combination of strength, high workhardening rate, ductility and formability. Owing to these features, automotive companies are finding that the use of these steels can enable them to not only reduce the overall weight of an automobile but also offer improved crash protection to the vehicle occupants.1,2
Weldability of DP steel is one of the key factors governing its application in the auto industry. Resistance spot welding is the predominant process in sheet metal joining, particularly in the automotive industry. The integrity of the resistance spot welds is critical to the overall integrity and reliability of an automobile3,4 as the failure of a single spot weld could destroy the energy absorption capacity of a crash member. This fact is widely recognised by the automotive community. Widespread use of advanced high strength steels (AHSSs) brings substantial weight saving; however, it increases the risk of fracture. Failure of the spot welds, in general, and in these new types of steel, in particular, has become a challenge for the steel and automotive industries. The complexity of the spot welds comes from a number of factors, as follows:
failure mode and failure mechanism of spot welds are complicated phenomena: failure mode and failure mechanism are largely dependent on the complex interplay among weld geometry, fusion zone (FZ)/heat affected zone (HAZ)/base metal (BM) properties, test geometry and stress state in each weld;5 – 7 therefore, failure mode and failure location are not known in advance
spot welds do not exhibit a homogeneous structure: owing to the weld thermal cycle, three distinct microstructural zones (i.e. FZ, HAZ and BM) are created in the weld and its vicinity; since analysis of the spot weld failure requires the characterisation of the failure, strain hardening and strain rate sensitivity properties of FZ and HAZ, microstructural heterogeneity further complicates the failure analysis and prediction of the failure mode8,9
strength mismatch among FZ, HAZ and BM creates strain concentration at the lowest strength microstructural zone; therefore, to predict the spot weld failure, the strain gradient should be determined8
geometrically, a spot weld causes an external crack at the joint;9 moreover, applying electrode force during the resistance spot welding process creates an indentation, and therefore, the stress concentration is created at the indentation wall;10,11 therefore, the stress concentration associated with these two effects should be considered in the analysis of the spot weld failure.
The resistance spot welding behaviour of low carbon steels (LCSs) and high strength low alloy (HSLA) steels is well understood through several researches carried out in the past years. However, the resistance spot welding of AHSS is still challenging due to some reasons, which are summarised below:
complicated microstructure development in FZ (e.g. martensite formation) and HAZ (e.g. martensite formation and HAZ softening due to martensite tempering);12 – 14 this complex microstructure development can impact the failure behaviour of AHSS RSWs and should be taken into account
increased tendency to fail in interfacial failure (IF) mode (crack propagation through FZ failure mode)12,14 – 16
high susceptibility to formation shrinkage voids in FZ due to their rich chemistry in comparison to LCSs17 – 20
high prone to expulsion that can lead to reduced peak load and energy absorption.3,21,22
An unavoidable practical requirement in modern automotive construction technology is dissimilar resistance spot welding of AHSSs and traditional steel grades. Understanding the failure mode and the failure behaviour of similar spot welds is straightforward. However, the failure behaviour of dissimilar RSWs can be problematic due to the following:
the difference in the physical properties of the BMs
the difference in the materials properties (strength, ductility and workhardening) of the BMs
the more complicated microstructural gradient across the weld.
The increased use of AHSSs has led to a wider range of possible material combinations in the resistance spot welding of the body in white assemblies. The majority of the research investigations into spot welding have focused on the welding of similar sheets. Despite various applications of dissimilar RSWs, reports in the literature dealing with their mechanical behaviour are limited.23 – 28
Alenius et al. 23 studied the weldability of various dissimilar metal joints between austenitic stainless steel and non-stainless steels. They concluded that the strength of the dissimilar joint in tensile–shear test is dictated by the strength and thickness of non-stainless steels. Marashi et al. 24 studied the microstructure and failure behaviour of dissimilar RSW between galvanised LCS and AISI 304 stainless steel RSWs. They found that the hardness of the FZ, which is governed by the dilution between two BMs, and the FZ size of the galvanised carbon steel side govern the failure mode. For spot welds made at low welding currents, the low FZ hardness and the small FZ size led to experiencing interfacial mode during shear–tensile test.
For spot welds made at high welding currents, the higher hardness of FZ due to martensite formation and the larger FZ led to experiencing pullout failure (PF) mode during the tensile–shear test. Pouranvari and Marashi25 presented a comparative study on the failure mode transition from IF to PF for similar and dissimilar resistance spot welds of low carbon and austenitic stainless steels. They found that the dissimilar welds exhibit the lowest tendency to fail in IF mode. Poggio et al. 26 studied the spot welding behaviour of dissimilar DP600/AISI 304 joint. Daneshpour et al.,27 in their work on the resistance spot welding of DP780 and deep drawing steel (DC04), concluded that the static tensile–shear behaviour of dissimilar DP780/DC04 welds is comparable to that of the resistance spot welds of DC04 due to the joint strength being governed by DC04. Khan et al. 28 investigated the static and fatigue performance of DP600/HSLA350. They concluded that the fatigue performance of dissimilar material HSLA350/DP600 spot welds was similar to that of similar HSLA350/HSLA350 spot welds. Hernandez et al. 29 studied the mechanical behaviour of the resistance spot weld of DP600 spot welded to HSLA, DP780 and TRIP780. They concluded that a PF mode with improved mechanical properties was obtained when DP600 is paired with other AHSSs compared to the DP600 welded to itself, which is prone to IF and poor mechanical properties, given the same weld size.
The aim of this paper is to investigate and analyse the microstructure–mechanical property relationship of dissimilar resistance spot welds between DP600 and LCSs.
Experimental
A 2 mm thick uncoated st14 LCS and a 2 mm thick DP600 DP steel sheet were used as BMs. The chemical compositions and mechanical properties are presented in Tables 1 and 2 respectively. Resistance spot welding was performed using a 120 kVA ac pedestal type resistance spot welding machine controlled by a programmable logic controller operating at 50 Hz. Welding was conducted using a 45° truncated cone RWMA class 2 electrode with an 8 mm face diameter.
Chemical compositions of base metals used in this study/wt-%
Tensile properties of base metals used in this study*
*YS, yield strength; UTS, ultimate tensile strength; n, strain hardening coefficient; K, strength coefficient; EL, total elongation.
To study the effects of the welding conditions on the weld performance, several welding schedules were used. Electrode force and holding time were selected based on the thickness of the base material and were kept constant at 5·1 kN and 0·2 s respectively. The welding current was increased step by step from 7·5 to 13 kA at welding times of 0·5 s. The critical welding conditions leading to expulsion were recorded. Four samples were prepared for each welding condition, including three samples for the tensile–shear test and one sample for the metallographical investigation and measurement of weld size.
In order to evaluate the mechanical performance and failure mode of the spot welds, a tensile–shear test was performed. Samples were prepared according to the American Welding Society standard.30 The coupon dimension for the tensile–shear was 140×60. The mechanical tests were performed at a crosshead of 10 mm min−1 with an Instron universal testing machine. The peak load (measured as the peak point in the load–displacement curve) and the failure energy (measured as the area under the load–displacement curve up to the peak load) were extracted from the load–displacement curve. The data points for peak load and failure energy are the average of the measured values for three specimens. The failure modes of the spot welded specimens were determined by examination of the fractured samples. The fracture surface of some samples was examined under a scanning electron microscope (SEM).
Samples for metallographical examination were prepared using a standard metallography procedure. Nital etching reagent was used to reveal the macrostructure and microstructure of the samples. The microstructure of various zones was studied using an optical microscope. Weld nugget (FZ) sizes and average electrode indentations were measured for all the samples on the metallographic cross-sections of the welds.
A Vickers microhardness test was performed using an indenter load of 100 g for a period of 20 s to obtain diagonal hardness. The hardness indentations were spaced 0·3 mm apart.
Results and discussion
Microstructure and hardness profile
The macrostructural characteristics of the RSWs, particularly the FZ size and microstructural and hardness characteristics, play important roles in their failure behaviour and failure mode. The rapid heating and cooling induced by the resistance spot welding thermal cycles significantly alter the microstructure in the joint zone. A typical macrostructure of DP600/LCS RSW is shown in Fig. 1a indicating three distinct zones, namely FZ, HAZ and BM.
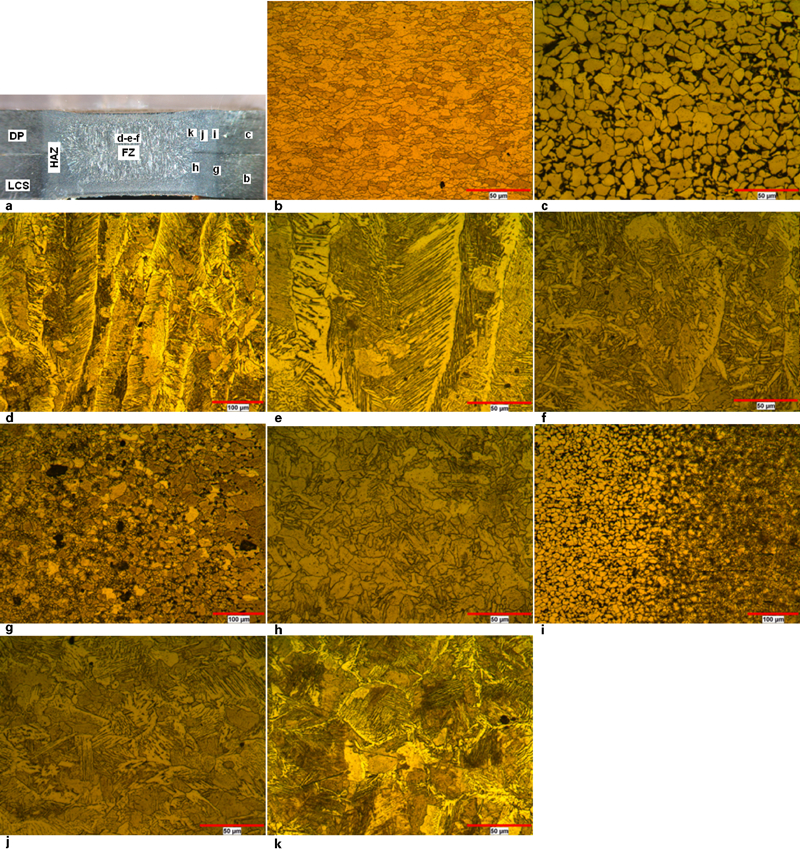
Microstructure gradient in DP600/LCS RSW
The hardness profile of the joint is shown in Fig. 2. The hardness variation across the joint can be analysed in terms of the microstructure of the joint. The LCS BM microstructure, as depicted in Fig. 1b , consists of ferrite grains; the corresponding hardness is 135 HV (Fig. 2). The DP600 microstructure, as shown in Fig. 1c , is composed of dispersed martensite islands embedded in a ferrite matrix; the corresponding hardness is 200 HV (Fig. 2). As can be seen in Fig. 1d–f , FZ exhibits a complex microstructure including columnar grains of martensite, upper bainite, allotriomorphic ferrite and Widmanstätten ferrite with an average hardness of 300 HV (Fig. 2). The martensite formation in the FZ is attributed to the inherently high cooling rate of the resistance spot welding process due to the presence of water cooled copper electrodes and their quenching effect as well as the short welding cycle.13 The formation of bainite and martensite in the FZ explains the higher hardness of the FZ compared to the BM hardness.
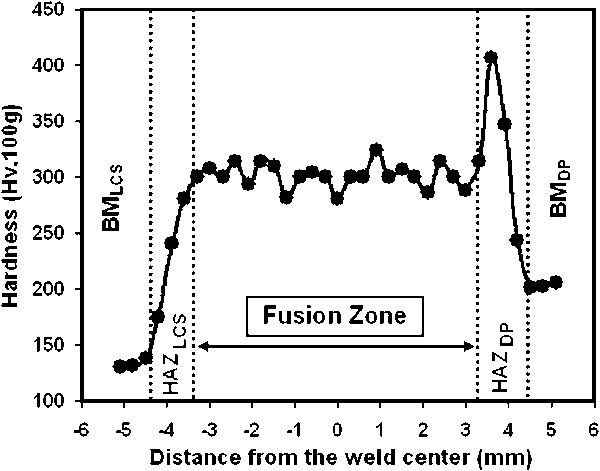
Typical diagonal hardness profile of DP600/LCS dissimilar RSW
The hardness of the HAZ in both sides is higher than the BM hardness due to the formation of non-equilibrium phases. The microstructure was more heterogeneous in the HAZ than in the FZ, as verified by the hardness profile. The material in the HAZ experiences a peak temperature and a cooling rate, which is inversely proportional to its distance from the fusion line.31
Thus, the high thermal cycle gradient coupled with the resulting austenite grain structure can explain the observed microstructure gradient in the HAZ. The HAZLCS microstructure near BMLCS (Fig. 1g ) consists of ferrite and some pearlite colonies. The region next to the fusion boundary of the LCS side (Fig. 1h ) exhibits polygonal ferrite and some lower bainite. The HAZDP microstructure near the BMDP (Fig. 1i ) exhibits a ferrite–pearlite/martensite microstructure. On approaching the fusion boundary, the volume fraction of martensite, and therefore the hardness of the material, is increased due to the formation of rich austenite during the dissolution of martensite. Moreover, some Widmanstätten ferrite, grain boundary ferrite and bainite are observed by approaching the FZ (Fig. 1j ).
One of the interesting features of the DP600/LCS hardness profile is the sharp change in the hardness profile in the HAZDP/FZ boundary. The microstructure of the HAZDP near the FZ (Fig. 1k ) almost entirely consists of martensite and grain boundary ferrite. The hardness of this region is 400 HV (Fig. 2). In this region, which experiences grain coarsening during the thermal cycle of the welding process, both high cooling rate and large grain size coupled with the formation of the carbon rich austenite grain promote the formation of martensite. Therefore, the sharp peak in HAZDP/FZ can be attributed to the formation of hard martensite.
It should be noted that the chemical composition of the FZ is a mixture of the composition of each BM, and hence, the FZ hardness is affected by the mixing of the BMs. The mixing of DP600 (C = 0·135, Mn = 1·28) and LCS (C = 0·065, Mn = 0·204) resulted in the reduction of the hardenability of the FZ rather than the HAZ of the DP600 side. The peak hardness in the HAZDP is 1·3 times higher than that of the FZ. As will be discussed later in this paper, this hardness characteristic can affect the failure behaviour of dissimilar DP600/LCS RSW.
Finally, it is noted that no softening is detected in the HAZ/BM interfaces. An HAZ softening is generally observable in DP steel containing higher martensite volume fraction (e.g. DP780 and DP980).4,14
Failure mode of dissimilar DP600/LCS welds during tensile–shear test
The failure mode of RSWs is a qualitative measure of the joint quality. Figure 3 shows the schematic representation of the main fracture path during the mechanical testing of the spot welds. Basically, spot welds can fail in four distinct modes described as follows:5,14,15
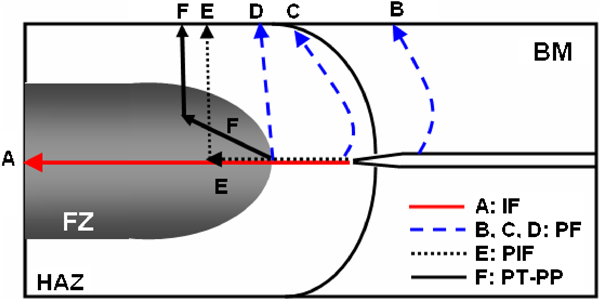
Schematic representation of various failure modes that can occur during tensile–shear test
interfacial failure mode in which fracture propagates through the FZ (path A)
pullout failure mode in which failure occurs via withdrawal of the weld nugget from one sheet; in this mode, fracture may initiate in the BM (path B), HAZ (path C) or HAZ/FZ (path D), depending on the metallurgical and geometrical characteristics of the weld zone and the loading conditions
partial interfacial mode in which fracture first propagates in the FZ and then redirected through the thickness direction (path E)
partial thickness–partial pullout (PT-PP) mode in which a slant crack propagates into the FZ and some part of mating sheet thickness is removed during separation.
As mentioned above, one of the major problems in the RSW of AHSSs is their high susceptibility to IF. Since the tendency to fail in IF mode during tensile–shear test is higher than the cross-tension test, the tensile–shear test was chosen to examine the fracture characteristics and mechanical behaviour of spot welds. The observed failure modes during the tensile–shear test are described below.
Interfacial failure mode
Figure 4a shows a typical fracture surface of a spot weld that failed in IF mode. The spot weld has failed through the weld nugget centreline. High susceptibility to the IF mode is one of the important issues in the weldability of the AHSS. Macroscopic observation of the fracture surface at low magnification indicates that the IF mode is accompanied with almost no plastic deformation. Many of the spot welds that failed in the IF mode exhibit voids in their FZ fracture surface. Figure 4b shows the magnified view of the void region in the FZ. Figure 4c shows the higher magnification view of the void region of Fig. 4b , indicating a dendritic fracture surface. It provides evidence that these cracks result from solidification shrinkages.
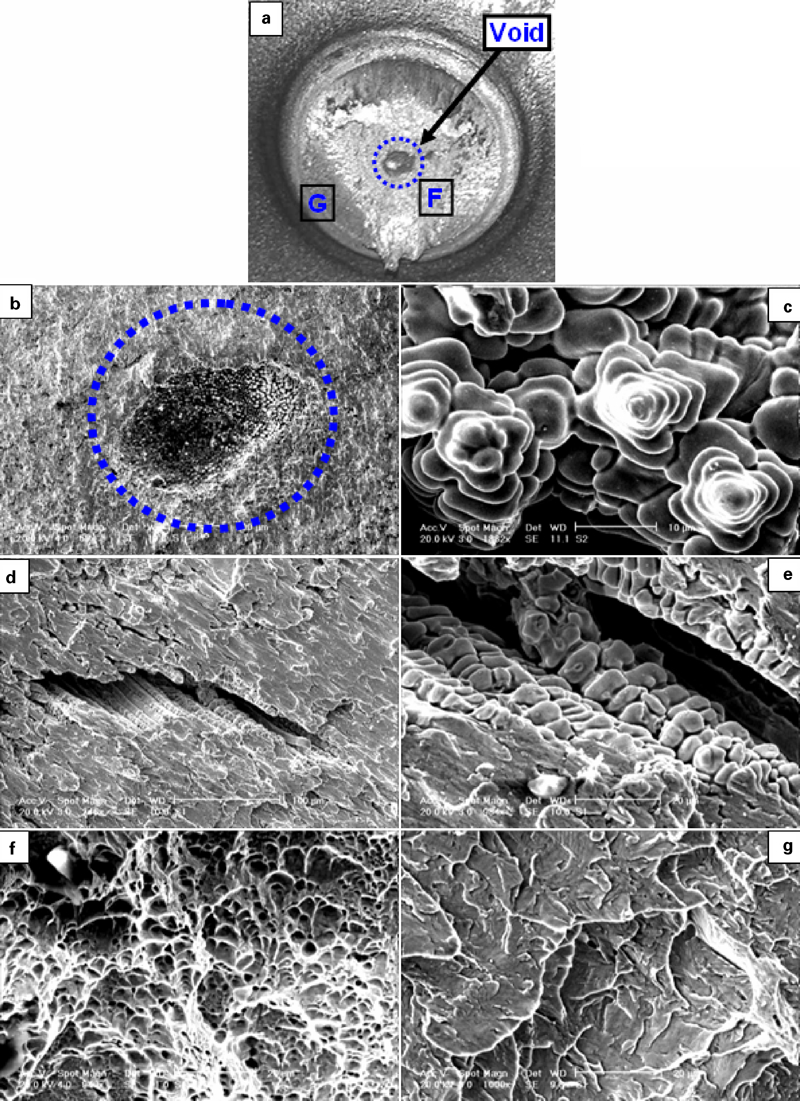
Fracture surface of DP600/LCS spot weld that was failed in IF mode during tensile–shear test
The presence of solidification cracks in the weld nugget was reported by several researchers.17,18 Moreover, there are also some cracks in the weld nugget (Fig. 4d ). Higher magnification of these cracks (Fig. 4e ) reveals a dendritic surface, which implies that the observed cracks are due to solidification shrinkage. The fracture surface (Fig. 4f ) exhibits dimples, which are characteristic of the ductile fracture, in spite of the hard structure of the FZ. In some regions, at the weld nugget edge, where the hardness was the highest, the fracture surface shows a cleavage fracture, which is a typical indicator of the brittle fracture (see Fig. 4g ). The causes of IF are detailed in the section on ‘Analysis of the failure mode’.
Pullout failure mode
Pullout failure mode was also observed in this study (Fig. 5). According to the macroscopic observation, the PF of dissimilar RSW between DP600 and LCS can be divided into three stages:
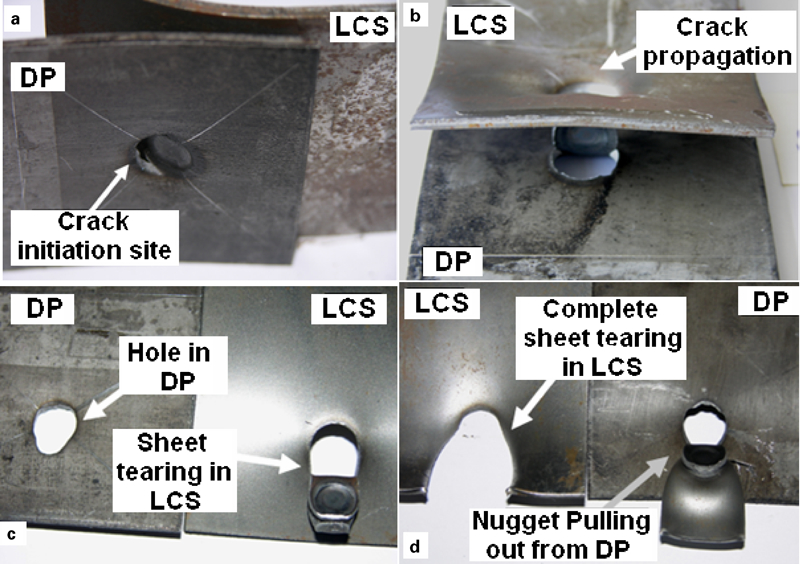
Stages of double pullout failure mode of DP600/LCS RSW during tensile–shear test
in all the spot welds that failed in the PF mode, the failure started by crack initiation from the DP steel side (Fig. 5a )
as the crack propagated along the nugget circumference in the DP side, another crack/necking was initiated in the LCS side (Fig. 5b )
the final stage of the complete separation occurred in two different types:
This failure mode has two interesting features. The PF is a double thickness failure: generally, during the PF mode of the LCSs, crack initiation and propagation occur in one sheet; however, in the case of the double thickness failure, the crack propagates in both sheets (see Fig. 5b ). One of the interesting phenomena observed in this research is the location of failure initiation in the pullout mode. As can be seen from Fig. 5a , the failure is initiated from the DP600 steel side. Since the generally accepted failure mechanism of the PF mode is through thickness necking,6,8 it is expected that the failure of the tensile–shear test samples would occur in the softer region of the spot weld. For example, it was reported that the PF location in similar LCS, HSLA and DP600 is located in the BM8,32 due to its lower hardness compared to FZ and HAZ. It was reported that the PF location of DP980/DP980 spot welds is at the HAZ softening region.22 Moreover, it was observed that the PF location of SS304/LCS dissimilar spot welds is in the LCS side due to its lower hardness.24 However, in this study, as it is obvious from Fig. 5, failure is initiated from the stronger BM, i.e. DP600. There are limited reports on this abnormal phenomenon. Hernandez et al. 29 reported that the PF DP600/DP780 dissimilar spot weld in the tensile–shear test is initiated from the stronger side, i.e. DP780. They attributed this phenomenon to the difference between the workhardening of DP600 and DP780. In the current study, the observed phenomenon can be explained as follows.
The yield strength of LCS is lower than DP600. Thus, during loading, the LCS sheet experiences yielding first and starts to workharden and can cause strain transferring to DP600. Moreover, it is believed that the high peak hardness in the FZ/HAZDP can act as a metallurgical notch, inducing stress concentration in the DP600 side. This can affect the strain distribution and promote failure initiation at the DP600 side. It can be concluded that the hardness profile, the difference in tensile strength of the BMs and the difference in workhardening behaviour of the BMs are key factors influencing the PF location of dissimilar spot welds. Failure location can significantly affect the mechanical properties of the spot weld. As a direct result of this phenomenon, the pullout peak load of the DP600/LCS is dictated by the DP600 BM tensile strength.
Partial thickness–partial pullout failure mode
Figure 6 shows a typical fracture surface of the spot welds that failed in the PT-PP mode. In this failure mode, part of the mating sheet thickness is removed during separation,15 as can be seen in Fig. 6. Failure is initiated from the notch located in the HAZDP and then propagates into FZ. Unlike the PF mode, PT-PP is not a double failure mode, and failure occurs only in one sheet.
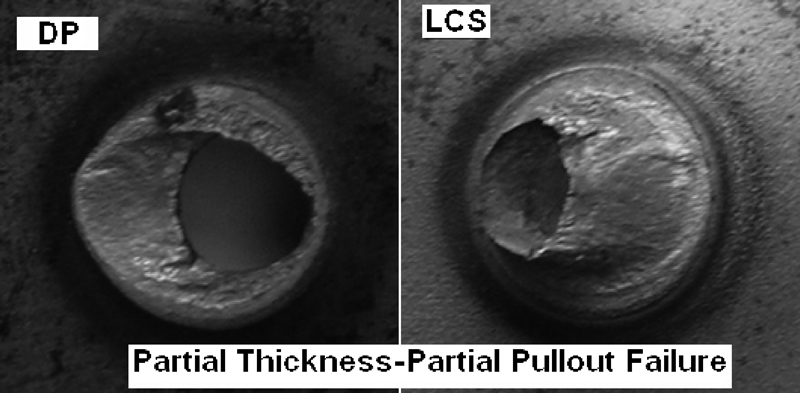
Typical fracture surface of PT-PP failure mode observed during tensile–shear test of dissimilar DP600/LCS welds
Analysis of failure mode
The failure mode of RSWs during the tensile–shear test depends on several physical and metallurgical weld attributes, including FZ size, electrode indentation and hardness characteristics of the weld as well as shrinkage voids. Figure 7a shows the effect of the welding current on the FZ size, electrode indentation and failure mode of the spot welds. The FZ size increases proportionally with increasing welding current; however, it is reduced when expulsion occurs. Increasing the welding current increases the temperature of the electrode/sheet interface, which in turn increases the degree of plastic deformation that can occur in the sheet surface under the electrode pressure. Spot welds with expulsion exhibit severe electrode indentation. As can be seen, by increasing the welding current, a transition in the failure mode from IF to PF was observed. In high welding currents, when expulsion occurred, the failure mode was changed from PF to PT-PP mode.
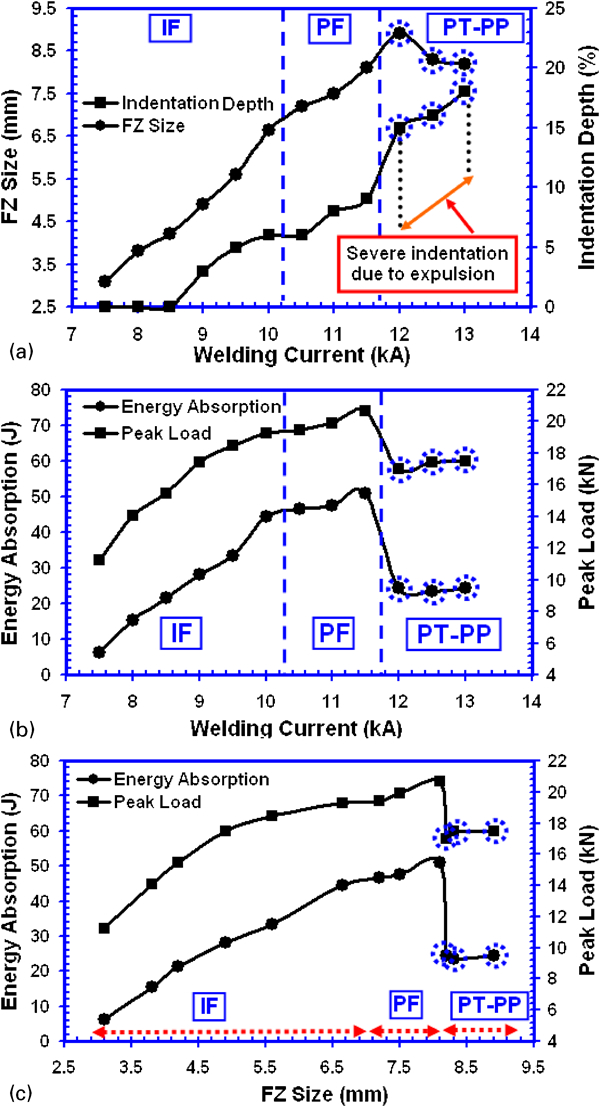
a effect of welding current on FZ size and electrode indentation depth, b effect of welding current on tensile–shear peak load and energy absorption and c effect of FZ size on peak load and energy absorption of DP600/LCS dissimilar RSWs
The occurrence of IF depends on several factors, as follows:
small weld nugget size: it is well known that there is a critical FZ size to ensure PF mode.4,5,7 As can be seen in Fig. 7a , those spot welds with an FZ size smaller than 7 mm tend to fail in interfacial mode. Therefore, the welding parameters, namely welding current, welding time and electrode force, which determines weld heat input, should be adjusted so that the sufficient weld size is obtained
presence of shrinkage void and solidification crack in nugget: it is shown that the presence of voids in the weld centreline can increase the critical FZ size.19,20 The presence of preferential crack paths, such as porosity or solidification cracks, can allow a crack to initiate at the surface notch and to propagate from one porosity or crack location to another along the surface of the weld.33 Furthermore, the presence of voids in the FZ decreases the effective FZ size and thus the area of the load bearing surface in IF mode (i.e. sheet/sheet interface area). In fact, a small weld nugget coupled with porosity and solidification cracks increases the experienced shear stress during the tensile–shear test at the faying surface and promotes the IF of the joint. It is shown that a longer weld time and a higher electrode force help in reducing the solidification voids and cracks17
chemical composition of FZ: the chemical composition of FZ can affect the hardenability of the FZ and its susceptibility to the formation of solidification defects. The higher carbon equivalent from elements of manganese, etc. makes the weld hard and brittle, which congregated in the grain boundaries and increased the boundary energy to easily cause solidification cracks.18 Segregation of trace elements, such as S and P, in the material composition to the grain boundaries induces an intercrystalline fracture.33,34 It is of note that the higher hardenability of steel, which aids in the formation of hard martensite in FZ, also provides preferential paths for crack propagation through the weld FZ and thus increases the sensitivity to IF mode in some loading conditions, such as peel and cross-tension loading.12,33,34
According to Fig. 7a , the FZ size is not the only governing physical parameter for the failure mode. Welds with FZ sizes of >7 mm do not always guarantee PF mode. Despite their large FZ size, spot welds made with the welding currents higher than 11·5 kA failed in the PT-PP mode, not in the PF mode. These spot welds experienced expulsion during welding and exhibited increased electrode indentation. Increasing the indentation depth increases the stress concentration at the edge of the weld nugget size. This fact affects the failure mode in two ways:
increasing the electrode indentation reduces the tendency to fail in the IF mode and promotes nugget withdrawal from one of the sheets due to the increased stress concentration at the indentation wall
the increased stress concentration at the weld nugget edge can change the fracture path. The fracture during the PF mode of dissimilar DP600/LCS is initiated from the BMDP and terminated in the BMLCS. However, in PT-PP mode, the increased stress concentration at the weld nugget edge promotes failure initiation from this site. The change in the failure location due to the increasing indentation is previously reported in similar LCS and DP steel RSWs.3,21,22 In PT-PP mode, the crack follows a slant path from the FZ/HAZDP into the weld nugget and then may redirect perpendicular to the weld interface.
Mechanical properties of dissimilar DP600/LCS during tensile–shear test
The peak load of the RSWs depends on several factors, including the physical weld attributes (mainly FZ size and indentation depth), the failure mode and the strength of the failure location. The failure energy of RSWs, measured as the area under the load–displacement curve up to the peak point, can be expressed as follows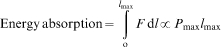
Figure 7b shows the effect of the welding current on the peak load and the energy absorption. As can be seen, a direct relationship between the welding current and the mechanical performance of the weld is not always established. The mechanical properties of the RSWs depend on several factors, including physical weld attributes (mainly FZ size and indentation depth), failure mode and strength/ductility of the failure location. Figure 7c shows the effect of the FZ size on the peak load and energy absorption. The following points can be drawn from Fig. 7:
before expulsion, there is a direct relationship between FZ size and peak load (and energy absorption). Increasing the welding current resulted in a higher heat generation at the interfaces. This leads to the formation of the larger FZ and increases the overall bond area. Moreover, this promotes the PF mode versus the IF mode. These facts can explain increasing the peak load and energy absorption until the optimal welding current is received
after expulsion (welding currents higher than 11·5 kA), the peak load reduced slightly, while the energy absorption reduced significantly, despite the large nugget size. For example, the peak load and the energy absorption of the spot welds made at 12·5 kA (FZ size = 8·1 mm) are ∼18 and 50% lower than those for the spot welds made at 11·5 kA (FZ size = 8·2 mm) respectively. Since the FZ size is very similar, this significant reduction in the mechanical performance should be related to the change in the failure mode.
Figure 8 compares the load–displacement curve of the DP600/LCS spot weld in three different failure modes. Spot welds that failed in the IF mode have a characteristic load–displacement curve. The peak point in the load–displacement curve corresponds to the crack initiation from the notch into the FZ. The load immediately drops to zero due to the rapid crack propagation in the FZ. For PF mode, the peak point corresponds to the crack initiation from the notch DP steel side. Unlike the IF mode, here, the load–displacement curve has a long ‘tail’ corresponding to the post-failure mode. In this failure mode, the load is gradually decreased. As can be seen, after reaching the peak load, there is continuous energy absorption due to the tearing of the BM. This fact contributes to the total energy absorption of the spot welds (i.e. the area under the load–displacement curve up to the final fracture point). It should be noted that PF spot welds with type 2 final separation have a longer tail than type 1 due to the complete tearing of the BM. The observed changes in the slope of the tail segment of the load–displacement correspond to the changes in the crack propagation path, as explained above. The load–displacement curve of the PT-PP mode exhibits a smaller tail compared to the PF mode.
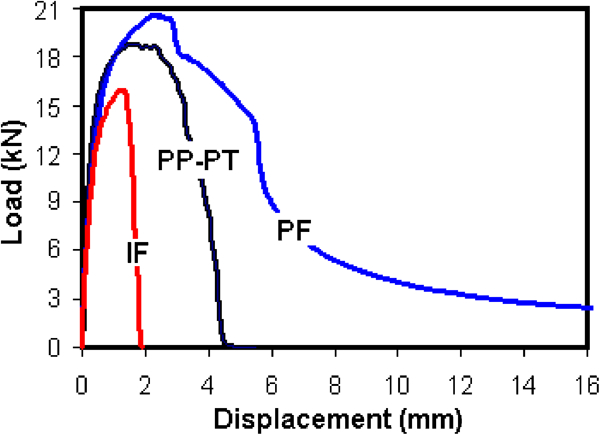
Tensile–shear load–displacement curve for IF, PF and PT-PP mode (IF mode, welding current of 8·5 kA; PF mode, 11·5 kA; PP-PT mode, 12·5 kA)
The influence of the strength/ductility of the failure location on the peak load and energy absorption depends on the failure mode. If spot welds fail in the IF mode, the strength and ductility of the FZ are important for the mechanical properties of the weld. If spot welds fail in the PF mode, the strength and ductility of the failure location (i.e. BMDP in the DP600/LCS spot welds) determine the mechanical properties of the spot weld. In this case, the FZ properties are not critical for the determination of the weld mechanical properties. In PT-PP failure mode, the properties of the FZ/HAZDP affect the mechanical properties of the joint.
As can be seen in Fig. 7, the PF mode exhibits the highest peak load. The higher peak loads in PF mode compared to IF mode is a function of the higher weld FZ size. Despite the similar/higher FZ size of the spot weld nuggets in PT-PP mode, they sustain a lower force compared to PF mode as a result of their higher electrode indentation. The stress concentration associated with the electrode indentation promotes premature failure.35 In some cases, the peak load of the IF mode is higher than that of the PT-PP mode.
As can be seen in Fig. 7, the PF mode exhibits the highest energy absorption. It is noticeable that if the total failure energy (the area under the load–displacement curve up to the failure point) is calculated, the difference between the energy absorption in various failure modes is more pronounced. The higher failure energy of the PF mode compared to the IF mode is due to its higher plastic deformation experienced during this failure process. In addition, the process of double PF is accompanied with higher plastic deformation compared to the traditional PF mode. This can increase the strain energy dissipation in the crash conditions. The PT-PP mode exhibits a lower failure energy compared to the PF mode. In some cases (welding current of 9–10 kA), the failure energy of the PT-PP welds is even lower than that of the IF mode. The low ductility of the failure initiation location (HAZ of DP600) and the low fracture toughness of the fracture path coupled with the higher electrode indentation can explain the lower failure energy of the PT-PP mode. Therefore, despite its nearly similar appearance to pullout mode, the PT-PP failure mode should be distinguished from the PF mode during mechanical testing for quality control. As shown in this study, one implication of this failure mode is the reduced peak load and energy absorption. Therefore, this failure mode should be avoided. To obtain PF failure mode, expulsion and severe electrode indentation should be avoided in addition to ensuring a large weld nugget size.
It is noticeable that during service the spot welds in automotive structures can experience both shear loading due to the relative displacement or rotation of the adjacent sheets and tensile loading due to the separating forces applied between the adjacent sheets in a direction normal to the sheets.36 Therefore, the peel or cross-tensile strength is as critical in automotive applications. To reach a more complete understanding of the weldability of dissimilar DP600/LCS RSWs, it is necessary to further assess the failure mode and mechanical properties of the joints in other loading mode, particularly peel and cross-tension tests.
Conclusions
The microstructure and mechanical properties of dissimilar resistance spot welds between DP600 ferrite–martensite DP steel and AISI 1008 LCS were investigated. The following conclusions can be drawn from this study.
The microstructure and FZ size of DP600/LCS dissimilar RSW are functions of the mixing degree of the two BMs and the high cooling rates inherent to the RSW process. The FZ microstructure exhibits a complex microstructure of upper bainite, martensite, allotriomorphic ferrite and Widmanstätten ferrite. The peak hardness in the HAZ of DP600 was greater than the FZ hardness due to the higher hardenability of D600 compared to FZ.
Increasing the welding current led to the failure mode transition from interfacial mode to pullout mode. A further increase in the welding current caused severe expulsion and indentation, leading to the change in the failure mode to PT-PP mode.
The failure location of DP600/LCS in PF and PT-PP modes did not follow the general expectations, i.e. failure initiated from the stronger side (DP600 side).
Before expulsion, there was a direct relationship between FZ size and mechanical properties. However, on expulsion, the peak load and the particularly energy absorption were significantly reduced. The reduction in the failure energy was related to the PT-PP failure mode. For similar weld size, the peak load and the energy absorption of the spot welds in the PT-PP failure mode were significantly lower than that in the PF mode. This can be attributed to the low ductility of the failure location (i.e. HAZ of DP600), low fracture toughness path (i.e. FZ) and higher electrode indentation of the PT-PP mode.