
Abstract
A combined first principle and experimental study of the microstructural characteristics of oxide scales developed on type 430 stainless steel during hot rolling is presented. The oxide layer structures have been investigated by means of SEM, XPS and GDS. The oxide scales were found to have a multilayer structure with Si enrichment at the oxide/matrix interface and were identified as (Fe,Cr)2O3/(Fe,Cr)3O4/Cr2O3, FeO and Si rich region/Fe–Cr stainless steel from the outer to the inner layer. An atomistic model of the Fe–Cr/FeO interface has been generated through first principle methods based on density functional theory. Structural and electronic properties are compared to available experimental data and studied as they evolve across the Fe–Cr/FeO and Fe–Cr (Si)/FeO interface.
Introduction
Hot rolling is a very complex manufacturing process, and surface quality from the process is affected by such factors as abrasive wear, fatigue cracking and heat impact on the rolls, oxidation of the stock being rolled and the sticking of the rolled material onto the roll. During hot rolling, stainless steels exposed to high temperature atmospheres are inevitably oxidised, forming secondary hot rolling scales. The scales must be removed to ensure the steel surface quality after the subsequent cold rolling process. However, a descaler cannot remove all scales during the hot rolling process. Acid pickling is normally used to remove the hot rolling scales in the stainless steelmaking route. The efficiency of acid pickling depends strongly on the properties of the scales, which are often affected by their microstructure. 1 1,2 The microstructure of the oxide/alloy interface plays a key role in determining the consistency of the oxide scales formed on the alloy after hot rolling.
Ferritic stainless steels have excellent hardness and strength at room temperature, but their high temperature hardness decreases significantly at about 1173–1373 K, the hot rolling start temperatures, resulting in easy separation of the scale from the rolled steel due to the reduction by the rolls. In addition, the high temperature oxidation behaviour, which can harden the rolled steel surface as oxide layers are formed in the surface region, can adversely affect the sticking. 3 3,4 Although the sticking can be minimised or prevented by designing optimum rolling conditions, only limited information, including oxidation effects, is available on the sticking of scales on ferritic stainless steels. In particular, most studies were carried out at low temperatures, probably due to experimental considerations. 5 5,6 Understanding the oxidation mechanism of ferritic stainless steels in hot rolling is of vital importance for acid pickling. The impact of local atomic order and of the chemical bonding on the oxide/alloy interface is still not well described and understood.
In this study, the composition and microstructure of the oxide scales of ferritic stainless steels were examined by scanning electron microscope (SEM), glow discharge spectrometry (GDS) and X-ray photoelectron spectroscopy (XPS). A first principle model is used to understand the oxide behaviour at the oxide scale/Fe–Cr ferritic stainless steel interface. The purpose of this study was to provide some understanding of the structure of the oxide/alloy interface of type 430 stainless steel at the atomic scale. It is recognised that surface deformation, as in subsequent hot rolling, is also important.
Experimental
Type 430 ferritic stainless steels were adopted in this study, and the chemical compositions are as follows (in mass-%): 0·06C, 0·75Si, 17·00Cr, <1·00Mn, <0·03S and <0·04P, with the balance of Fe. The yield strength, tensile strength and elongation are 305 MPa, 410 MPa and 36% respectively, which are similar to those of conventional SUS 430 steels. The slabs for hot rolling were made by the Taiyuan Iron and Steel Group Corporation. The hot rolling test was conducted on slabs heated in a pilot plant scale rolling facility. The reheating temperature was 1373 K, and the entry temperature was ∼1323 K. The slab specimen was heated at ∼50 K s−1. Samples with dimensions of 20×30×5 mm were cut from the hot rolling slabs. After forming the oxide scales, the surface microstructures of the oxide scales and the elemental distribution at the oxide scale/alloy interfaces were investigated using several kinds of analytical instruments. The microstructures of the surface and oxide scale/alloy interfaces were analysed by an SEM equipped with an energy dispersive X-ray spectroscope (EDS; Kevex). The elemental distributions of the major and minor elements around the oxide scale/alloy interfaces were investigated using a glow discharge spectrometer. X-ray photoelectron spectroscopy of the surface oxide film on the type 430 stainless steel was performed using an ESCALAB-250 spectrometer, with a non-monochromatised Al Kα X-ray source. The surface appearance of the oxide scale after rolling was photographed using an industrial digital camera.
Computational methods
First principle methods have been proven very useful in the study of interface materials.
7
7,8 In the present study, the simulations have been performed within the density functional theory (DFT) method by using the CASTEP code. DFT is the most suitable method for describing the electronic structure of atoms and can provide precise information. The DFT calculations in this study were performed using an implementation based on plane waves and norm conserving pseudopotentials, including relativistic corrections, with the following electronic configuration of the elements: Fe 3d64s2, Cr 3d54s1, Si 3s23p2 and O 2s22p4. Plane waves and norm conserving pseudopotential methods have been used to investigate the metal, oxidation and interface slabs.9 For the exchange and correlation energy, the generalised gradient approximation proposed by Perdew et al. was used.10 The target material in the present study is ferritic stainless steel; therefore, the body centred cubic (bcc) Fe–Cr binary alloy model was considered. The metal oxide is wüstite FeO at the alloy/oxide interface. In the calculations, the energy cutoff was set to 350 eV. The presented model was relaxed structurally until the maximum component of the forces was <10−2 eV Å–1. The method described by Perdew et al.
10 was first employed to calculate the structural properties for the bulk form of Fe and FeO. The technical parameters are identical to those used in Refs. 11 and 12; the bcc crystal Fe surface being modelled by a six layer Fe slab (two layers are allowed to relax) and the lattice constant is fixed to the theoretical Fe bcc lattice constant (a
theory = 0·2867 nm, a
exp = 0·2844 nm). FeO has the same crystal structure as NaCl. FeO surface is modelled by a six layer FeO slab (two layers are allowed to relax), and the lattice constant is fixed to the theoretical FeO lattice constant (a
theory = 0·4298 nm, a
exp = 0·4334 nm). Note that the results of this study agree well with the experimental values of Nakanishi et al.
13 for lattice constants. In this study, the electronic structure of the oxide/alloy interface is studied using generalised gradient approximations within DFT. It is noteworthy that the cohesive energy E of a material is a fundamental property, which is a measure of the strength of the forces that bind atoms together in the solid state and is descriptive in studying the phase stability. Hence, the less the cohesive energy, the more stable the crystal structure. In this work, the cohesive energy is given by
Results and discussion
Microstructure of oxide scale
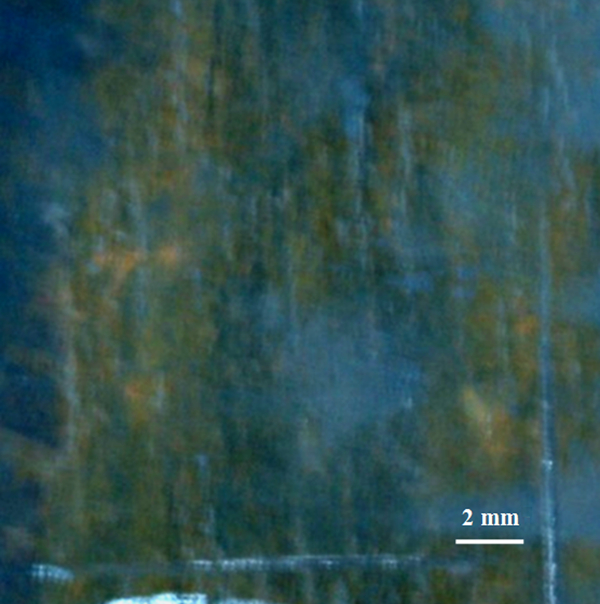
The surface morphologies of oxide scale of type 430 stainless steels after rolling are shown in Fig. 1, in which the visible sticking is observed. The oxide scales on type 430 stainless steel after rolling are not uniform. After forming the oxide scales, the specimens were sectioned perpendicular to the oxide/alloy interface. Figure 2 shows the microstructure of the cross-section at the oxide scales/alloys interface after rolling. It is shown that the oxide scales have three different colour contrasts: grey on top, bright in the middle and dark at the bottom. The thickness of oxide scales are about 0·5–1·5 μm. Furthermore, the oxide scale/alloy interface has a clear boundary zone with dark line in the image. The microstructure of oxide scale is a relatively dense structure with no voids and cracks.
Surface morphologies of oxide scales on type 430 stainless steels after rolling
Cross-sectional image (SEM) of oxide scale on type 430 stainless steels after rolling
Figure 3 shows the results of the GDS analysis of near the interface between the oxide scale and alloy. The GDS analysis indicates that the scale consists mainly of Cr, O and Fe; in addition, Si was also detected. The chromium and oxygen concentrations were not constant throughout the scale layer. A strong Si peak is observed at the interface between the scale and the substrate, in which Si oxide is observed at the interface. The oxygen intensity showed a stable signal during the first 0·15 μm, followed by a continuous decrease in the signal up to the sample substrate. An XPS depth profile of the same oxide layer was also measured and is shown in Fig. 4. The XPS depth profile result is in a good agreement with the SEM and GDS results, and consequently, this is an indication that Fe2O3 and Fe3O4 form on the top and Cr2O3 forms mainly in the middle. When XPS analysis is used, the minor element Si is difficult to detect due to its uniform distribution near the interface between the oxide scale and the alloy. The progressive decrease in O from the surface to the interface and the broad but shallow Si peak in Fig. 3 is a consequence that as Si cannot appear in Fe oxides, it is rejected to the interface where it forms SiO2 and then fayalite, Fe2SiO4. The Si rich layer has been reported to have a beneficial effect on oxidation resistance due to the formation of a silicon oxide layer between the oxide and alloy interface. The formation of chromium protective scales is promoted by this continuous or non-continuous silicon oxide layer that is reported to act as a diffusion barrier to Fe and Cr reaching the oxide layer. 14 14,15
Depth profile of elements at surface of hot rolling specimens by GDS
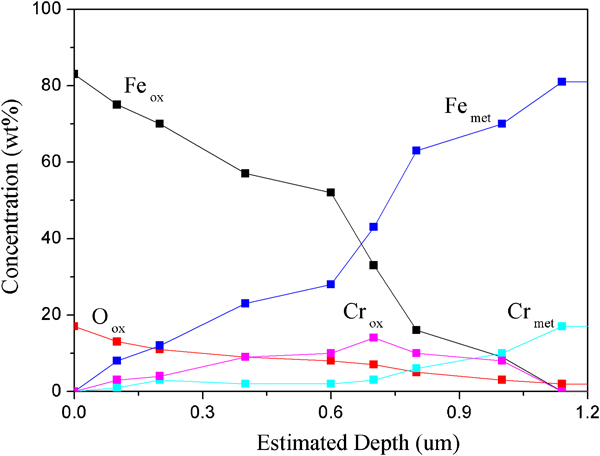
Depth profile analysis by X-ray photoelectron spectroscopy of mechanically polished type 430 stainless steel
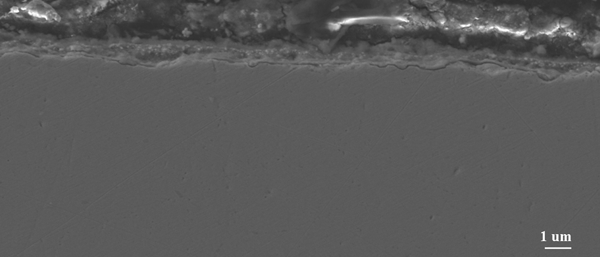
To investigate the elemental distributions around the oxide/alloy interface more precisely, EDS images were examined further in the depth direction of Fig. 2. Figure 5 shows the elemental distribution profiles and scan lines for the elements Fe, Cr, O and Si obtained from the EDS images; the profile is shown from the surface of oxide scale to the oxide scale/alloy interfaces. The distribution of Si shows a maximum ∼1·5 μm, which corresponds to the oxide scale/alloy interface. The presence of Si may impart a positive effect on the efficiency of acid pickling of ferritic stainless steel. On the basis of the data from EDS, GDS and XPS, it is possible to draw the oxide scale structure of compounds, (Fe, Cr)2O3/(Fe, Cr)3O4/Cr2O3, FeO and Si rich region/Fe–Cr stainless steel, from the outer to the inner layer.
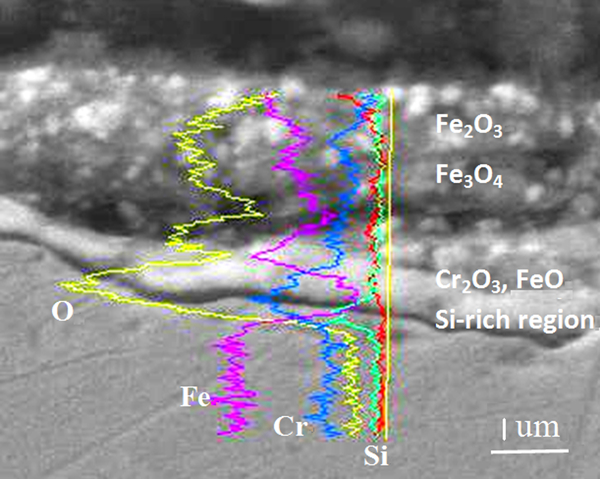
Cross-sectional image (SEM) of oxide scales: X-ray linescan showing distribution of Fe, O, Cr and Si
Interface of alloy/oxide scale
The present studies have shown that two different kinds of metal oxide, Cr2O3 and FeO, interact with the alloy/oxide scale interface after hot rolling. The metal and metal oxides have different lattice constants that create lattice mismatches between the surfaces. In the calculations, an attempt was made to minimise these mismatches. The following describes the Fe–Cr/FeO interface. FeO was placed on the Fe–Cr (100) binary alloy substrate. The computational cell of the perfect Fe–Cr (100)/FeO (100) interface is shown on the left side of Fig. 6. The bcc Fe–Cr (100) surface had 12 metal atoms, with Fe atoms replaced randomly by Cr atoms. The oxide films were composed of six iron atoms and six oxygen atoms for the FeO. This structure can be changed to Fe–Cr (Si) (100)/FeO (100) interface if an Si atom is substituted for the Fe on the Fe/Cr interface layer, as shown on the right side of Fig. 6. To confirm the accuracy of the calculations, Fig. 7 compares the calculated cohesive energies for the two modes of interaction.
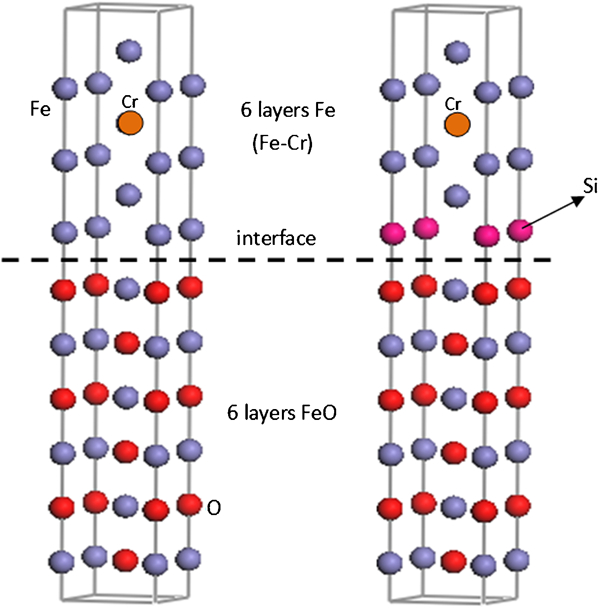
Stable structure of atomic models of Fe–Cr (100) (six atomic layers)/FeO (100) (six layers)
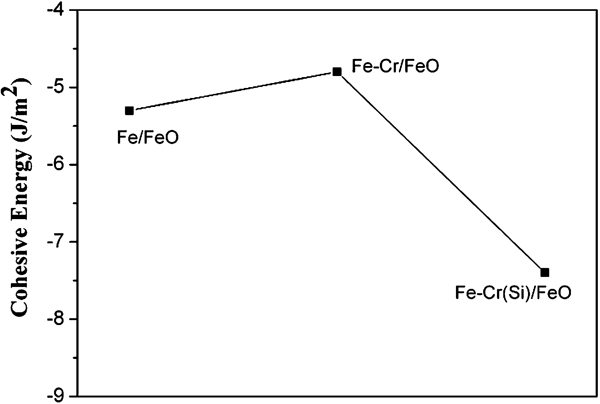
Cohesive energy of Fe–Cr/FeO interface
Figure 7 shows the cohesive energy of Fe–Cr (100)/FeO (100), Fe–Cr (Si) (100)/FeO (100) interface structures. After introducing Si into the Fe–Cr (100)/FeO (100) interface, the cohesive energy for the Fe–Cr (Si)/FeO interface is much less than that of the Fe–Cr (Si)/FeO interface. The cohesive energy is significantly lower at the Fe/FeO interface than at the Fe–Cr/FeO. This indicates that Fe–Cr (Si)/FeO interface is more stable than Fe–Cr/FeO and Fe/FeO in high temperature environments. From the above discussion, it can be concluded that the Si atom would like to substitute the Fe atom on the Fe–Cr/FeO interface layer.
Conclusions
In summary, a multilayer oxide structure with Si enrichment at the oxide/Fe–Cr interface was observed. The results indicate clearly that silicon was enriched at the substrate/scale interface by nearly three times its bulk concentration. The first principle simulations predicted the structural stability of Fe–Cr/FeO and Fe–Cr (Si)/FeO. The cohesive energy of Fe–Cr (100)/FeO (100) was higher than Fe (100)/FeO (100) and Fe–Cr (Si) (100)/FeO (100), whereas the Fe–Cr (Si)/FeO interface had a stronger bonding strength.
Footnotes
Acknowledgements
The authors would like to gratefully acknowledge the support of the National Natural Science Foundation of China (grant no. 50874079).
This paper is part of a special issue on ‘UK: China Steel’