
Abstract
In order to improve the process control during the steelmaking process, it is essential to obtain knowledge, as well as interpret information, on the characteristics of non-metallic inclusions in liquid steel samples. The purpose of the present study is to evaluate the effect of different sampling conditions on the inclusion characteristics. The changes in number, size and composition of primary inclusions due to the precipitation of secondary inclusions are studied. This is investigated in laboratory scale samples from an Fe–10 mass-%Ni alloy as well as industrial steel samples with varying contents of oxygen and sulphur. The results show that in most cases, the inclusion population can be separated, using a size condition, into primary (⩾0·6 μm) and secondary (<0·6 μm) inclusions. Overall, the Lollipop sample with a 6 mm thickness can be recommended, because most of the secondary inclusions in low sulphur steels can be removed from the total particle size distribution. However, during sampling of liquid steel containing high levels of sulphur, a significant amount of sulphides precipitate heterogeneously onto primary inclusions, making it impossible to use size or morphology to separate the population. Finally, the numbers of secondary inclusions in the steel samples were found to increase significantly with an increased sample cooling rate. However, the number of primary inclusions was found to be almost constant and independent of the sample cooling rate.
Introduction
It is very important to understand how inclusion characteristics in metal samples change during sampling of liquid steel. This topic is becoming more and more essential as rapid techniques, such as optical emission spectroscopy–pulse discrimination analysis1 and laser ablation–inductively coupled plasma–mass spectrometry,2 for online determination of inclusion characteristics during the steelmaking process are becoming more and more available.
Depending on the moment of precipitation, the inclusion population can be divided into primary and secondary inclusions. Primary inclusions exist in the melt at the sampling moment, whereas secondary inclusions are formed during cooling and solidification of the steel sample. However, the determination of primary inclusions, whose characteristics depend strongly on the process stage, has utmost importance for online control and correction of the steelmaking process. It should be noted that the secondary inclusions formed by heterogeneous precipitation on surface of primary inclusions can change significantly the composition and size of the primary inclusions in steel samples. Therefore, detailed studies of changes in inclusion characteristics in samples during sampling of liquid steel are necessary in order to interpret correctly the results of characterisation techniques.
Previous studies focused on the general cleanliness of the steel samples, expressed by the total oxygen content, and the risk of contamination during sampling. Specifically, it was found that the argon protected sampling method provides the best samples for characterisation of inclusions.3 Furthermore, the precipitation and growth behaviour of secondary inclusions were studied by Dekkers et al. 4 and van Ende.5 In their studies it was suggested that very small spherical Al2O3 inclusions precipitate during fast cooling and solidification of low alloyed steels. Therefore, in order to analyse primary and secondary inclusions separately, it is of great importance to investigate if a critical particle size can be determined to separate the primary and secondary inclusions in the total inclusion population.
The purpose of the present study is to evaluate how inclusion characteristics change according to different sampling conditions in both laboratory experiments and industrial process. Specifically, the changes in size and composition of the primary inclusions related to the precipitation of secondary inclusions are investigated. Furthermore, it is investigated if a critical inclusion size can be found for separation of secondary and primary inclusions.
Experimental
Laboratory scale samples of an Fe–10 mass-%Ni alloy, and industrial steel samples with varying oxygen and sulphur contents, were investigated. The major characteristics of the samples are given in Table 1. In addition, typical compositions of the alloy and steel grades are given in Table 2. It should be noted that the main difference regarding inclusion forming elements are the levels of oxygen and sulphur. Specifically, oxygen is higher in the laboratory scale samples and the 316L stainless steel sample compared to the usual low alloyed samples. In addition, high sulphur levels are found in SAE 1146 and 17CrMo4, which are free cutting steel grades.
Geometric shape and major characteristics of different laboratory and production samples*
*QT, sample by quartz tube; LP, Lollipop type sample; LSHR, liquid solidification hot rolling sample; IQ, water quenched ingot sample; IC, ingot sample cooled till 1200°C.
Typical contents of main elements in sampled steel grades from laboratory and industrial experiments
* TO, total content of oxygen; TN, total content of nitrogen.


Laboratory scale experiments
The experimental procedure of the laboratory scale experiments is illustrated in Fig. 1. A high grade alumina crucible with 160 g Fe–10%Ni (here and hereafter in mass-%) charge was placed in an induction furnace. This was equipped with a graphite susceptor, which was used to avoid induction stirring of the melt. The charge was melted in an argon atmosphere and held for 20 min at 1600°C for homogenisation of the melt composition. Thereafter, 0·02% or 0·06%Al (as Fe–16%Al alloy) was added for deoxidation and then stirred mechanically with an Al2O3 rod for 10 s. During the experiments, the metal samples QT-1 and QT-2 were taken from the melt after 1 and 5 min respectively, using a quartz tube, which was quenched in water directly after sampling. The melt which remained in the crucible was quenched in water from 1600°C (IQ ingot sample), or cooled in the furnace till 1200°C with a cooling rate of ∼0·8°C s−1 (IC ingot sample) and thereafter quenched in water.
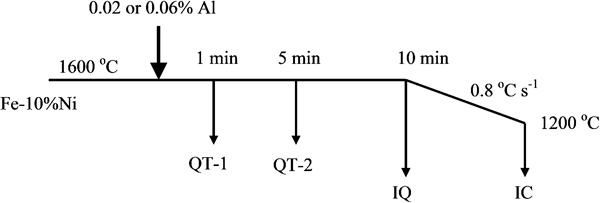
Schematic illustration of melting, deoxidation and sampling during laboratory scale experiments: QT, sampling by quartz tube; IQ, water quenched ingot sample; IC, ingot sample cooled till 1200°C
Industrial scale experiments
Most liquid steel samples in the industrial experiments were taken from the tundish with a hand held semi-automatic argon protected sampling system. Disposable samplers of a Lollipop type with a thickness of 6 (LP-6) and 12 mm (LP-12) and a liquid solidification hot rolling (LSHR) type with a thickness of 14 mm were used. It should be noted that the LP-6 sample of the 316L steel was taken during the final stage of the ladle treatment using an automatic argon protected sampling system. Liquid steel samples from the following four steel grades were analysed: 17CrMo4, 28MCB5, SAE 1146 and 316L.
Determination of particle size distribution (PSD)
Specimens with dimensions of (12–15)×(8–10)×(3–5) mm (sample from quartz tube Ø 6×10 mm) were cut from the steel samples. Thereafter, the specimens were ground and cleaned, and then dissolved using the electrolytic extraction method with a 10% AA electrolyte (1% w/v tetramethylammonium chloride–10% v/v acetyl acetone–methanol). After extraction, the solution, containing undissolved inclusions, was filtrated through polycarbonate film filters with an open pore size of 0·05 μm. In the case of the 316L steel grade, polycarbonate film filters with an open pore size of 1 μm were used to collect large size particles (⩾1 μm).
The inclusion characteristics (such as PSD, composition and morphology) on the surface of the film filters were investigated in three dimensions by scanning electron microscope (SEM). Initially, the homogeneity of the inclusion dispersion on the film filters was verified. The composition of typical inclusions was analysed with energy dispersive spectroscopy (EDS). Thereafter, the area and the equivalent circle diameter d
V of each inclusion in the obtained photographs were measured. The number of inclusions per unit volume N
V was calculated as follows
Results and discussion
Changes in inclusion characteristics due to precipitation of secondary inclusions during sampling
It is known that the cooling rate of liquid steel has a strong effect on the precipitation of secondary inclusions during cooling and solidification. Depending on the precipitation behaviour, the PSD in the metal samples is considered to change. In the case of rapid solidification of the liquid steel, two peaks can clearly be distinguished in the observed PSD (Fig. 2a ), because of the homogenous nucleation of secondary inclusions. The right hand side peak corresponds to the PSD of primary inclusions, which are present in the liquid steel at the sampling moment. The left hand side peak is expected to correspond to that of small size secondary inclusions, which nucleates during cooling and solidification of the steel. In this case, a critical particle size d crit, can be used to separate the inclusion population into the two subgroups containing primary (⩾d crit) and secondary (<d crit) inclusions. This can enable a separate estimation of the secondary and primary inclusion characteristics (such as number, size and composition) based on the particle size. However, a lower cooling rate can give the secondary inclusions time to grow and precipitate heterogeneously onto primary inclusions. This can result in that only one peak can be distinguished (Fig. 2b ) in the PSD. In this case, the primary inclusions (right hand side peak) cannot be separated from the total PSD obtained by a size condition. Thus, the obtained characteristics of the final inclusions are different from those of the primary inclusions existing initially in the liquid steel. Finally, if a secondary phase (hereafter called phase B) only precipitates heterogeneously onto primary inclusions (hereafter called phase A), the apparent diameter of the initial primary inclusions increases, while the total number of inclusions equals to the number of primary inclusions (Fig. 2c ). Moreover, the surface layer (secondary phase) significantly changes the initial composition of the primary inclusions.
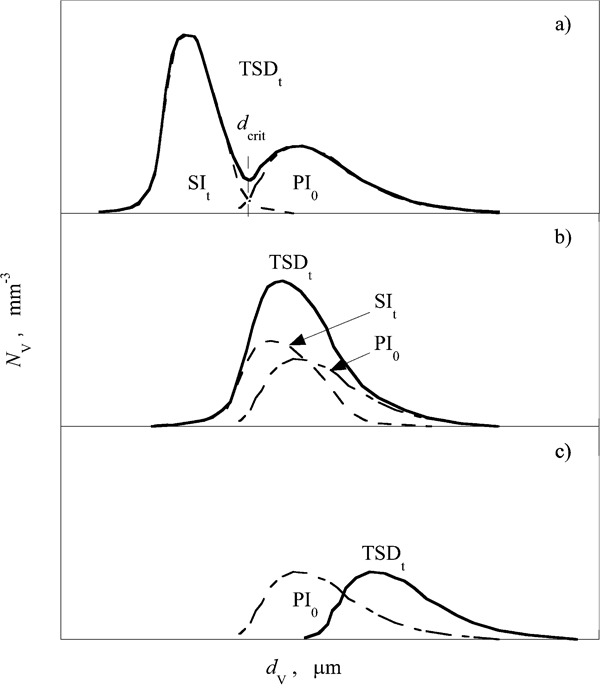
Schematic diagram of PSDs by a homogeneous and b, c heterogeneous precipitation of secondary inclusions during cooling and solidification of steel samples: PI0, PSD of primary inclusions; SIt, PSD of secondary inclusions; TSDt, total PSD
The N
V value of secondary oxide and sulphide inclusions, which can nucleate during cooling and solidification, are estimated as follows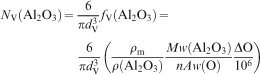
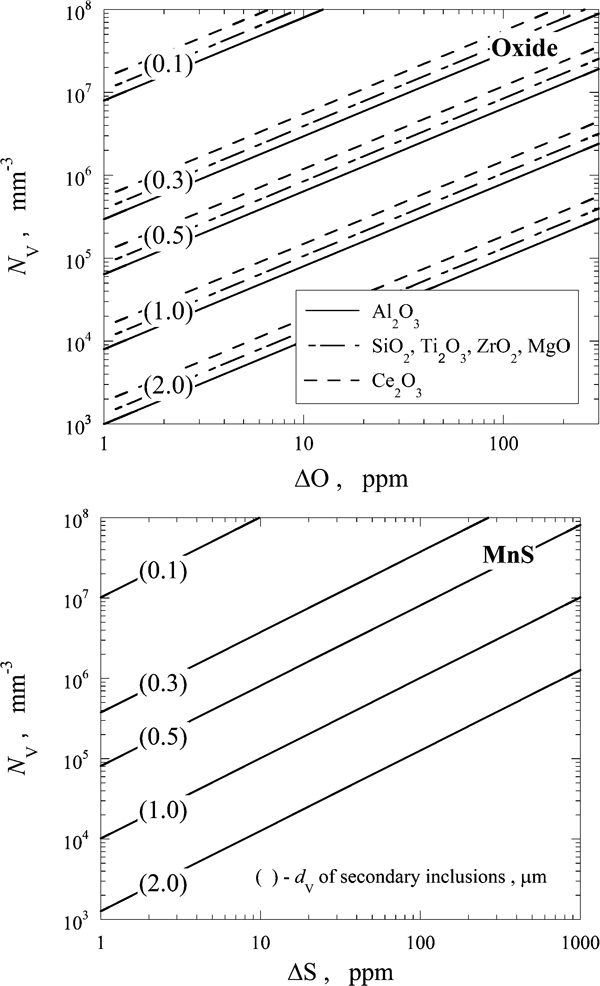
Calculated number of secondary oxide and MnS inclusions of different diameter per unit volume of metal by homogeneous precipitation during cooling and solidification of liquid steel samples
Figure 4 shows the estimated thickness of secondary Al2O3 and MnS layers l
B, assuming heterogeneous precipitation onto the surface of the primary spherical inclusions during cooling and solidification of the liquid steel sample. In addition, it was also assumed that the secondary phase precipitated uniformly on all primary inclusions. In this case, the total volume of the inclusions V
tot, can be estimated as the sum of the volumes of the primary V
A and the secondary V
B, phases, as follows
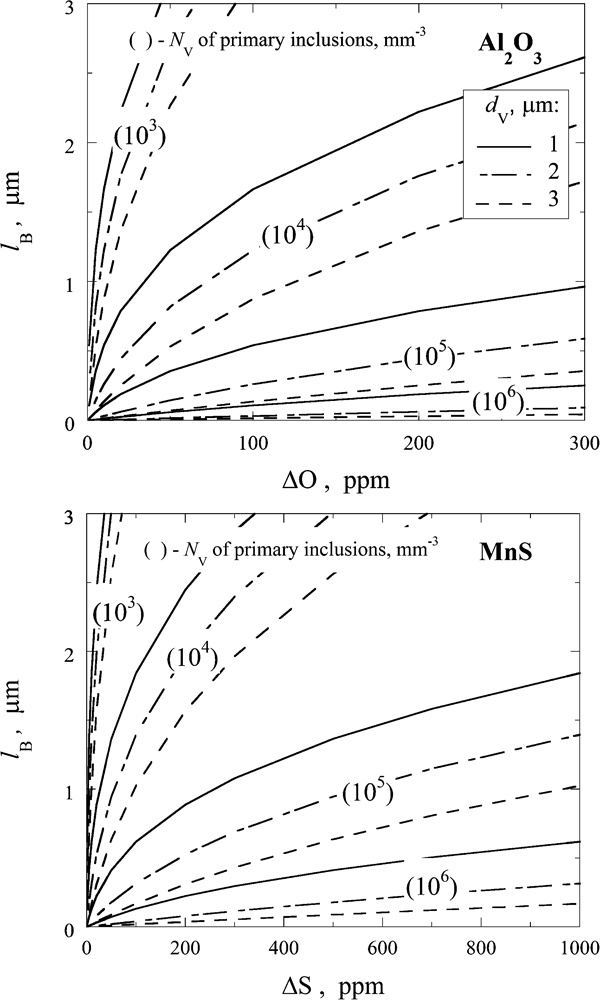
Calculated thicknesses of secondary Al2O3 and MnS layers as result of heterogeneous precipitation on surface of primary spherical particles during solidification of liquid steel samples
A thick secondary phase layer also has a significant effect on the result of the inclusion composition analysis. Figure 5 shows how the composition analysis result changes as a function of the depth of the analysed zone L anal and the thickness of the precipitated layer l B. The analysed layers of phases A and B and the depth of the analysed zone by EDS are defined and shown schematically in the upper diagram of Fig. 5. In this case, the content of the phase A determined using EDS analysis can be estimated roughly as x A/(x A+l B)×100%. The depth of the analysed zone L anal depends strongly on the EDS conditions and equipment, as well as the properties of the analysed material. However, for iron, L anal can be approximated to 0·5–1·5 μm for an acceleration voltage of 10–20 keV.6 It can be seen in Fig. 5b that the content of phase A decreases drastically as the thickness layer of the secondary phase B increases. As the exact thickness of the precipitated layer is unknown, it is difficult to determine the average composition of the primary inclusion. Thus, it may be difficult to identify correctly the type of inclusion present in the steel.
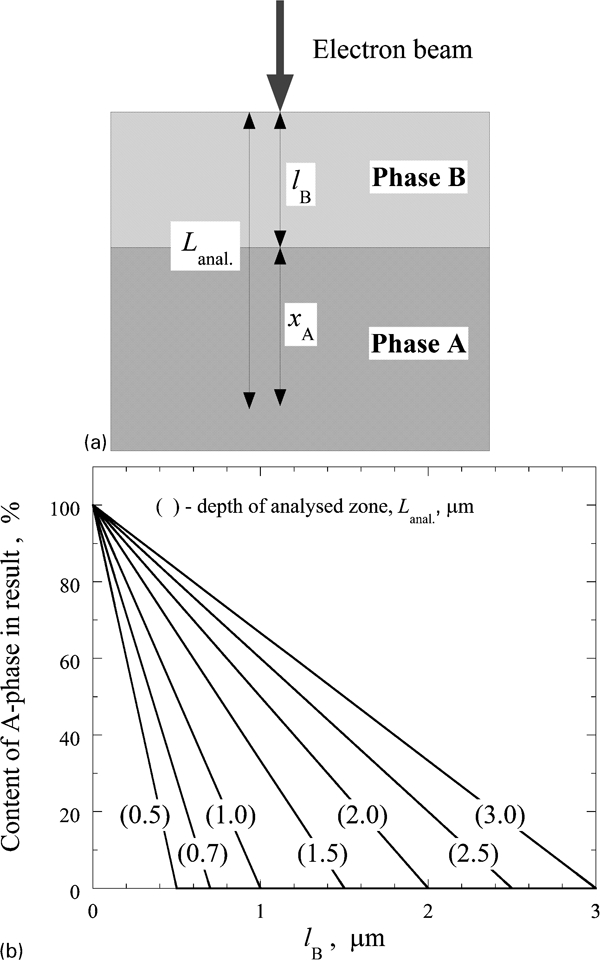
Estimated content of primary inclusion phase (phase A) as result of particle composition by EDS analysis depending on thickness of secondary phase layer l B and depth of analysed layer L anal
Based on the results in Figure 3 Figure 4 Figs. 3–5, it is apparent that the partial or total precipitation of secondary phase onto the surface of the primary inclusions changes strongly the initial characteristics (number, size and composition) of the primary inclusions. Therefore, it is very important to determine the optimal parameters for sampling and solidification of the liquid steel, in order to separate and analyse the primary inclusions present in the liquid steel at the sampling moment.
Inclusion characteristics depending on sampling conditions
In the present study, the nucleation modes of the secondary inclusions were estimated by plotting the PSDs for different sample types obtained at various sampling parameters. The PSDs were obtained by three-dimensional (3D) investigations of inclusions on film filters after electrolytic extraction. According to the recommendations given in a separate article,7 magnifications of ×2000–5000 and ×1000 were used during the SEM observations for analysis of small (<1 μm) and large (⩾1 μm) size inclusions respectively. Figure 6 shows the PSDs as a function of the observation magnification for a QT sample obtained from laboratory scale experiment. The total observed area varied from 0·014 mm2 (for ×2000 and ×5000) to 0·113 mm2 (for ×1000). The number of inclusions analysed were 330–380 and 2050 inclusions for ×2000–5000 and ×1000 observations respectively. It can be seen in Fig. 6 that the PSDs obtained at magnifications of ×2000 and ×5000 have two peaks. Therefore, the d crit value can be assumed to be 0·6 μm. As mentioned above, the right hand side and the left hand side peaks correspond to the size distribution of primary and secondary inclusions respectively. However, only one peak is observed in the PSD obtained at a magnification of ×1000. This is due to the limitation of accurate measurement of inclusions smaller than 1 μm. At the same time, the results obtained at a magnification of ×1000 are more accurate for large size inclusions. This is due to the larger area observed on the film filter and thus a larger number of analysed inclusions. Therefore, the total PSD was estimated by combining the PSD of ×5000 (for <1 μm) with that of ×1000 (⩾1 μm) observation results.
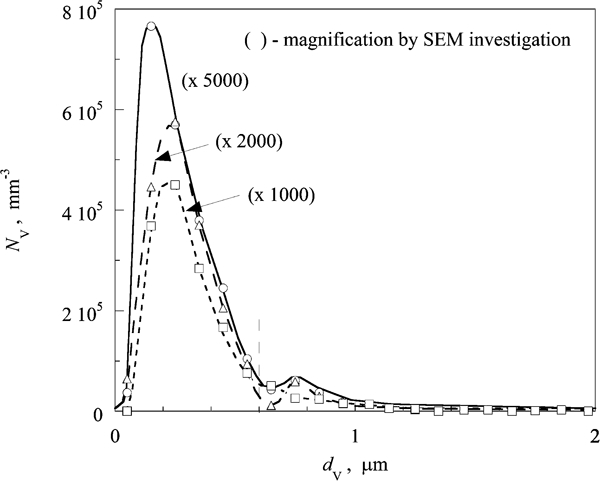
Typical PSDs obtained by 3D investigation of inclusions on film filter at different magnifications
The typical PSDs in an Fe–10%Ni alloy deoxidised by Al are shown in Fig. 7 for different cooling rates of the laboratory scale samples. The QT sample (Fig. 7a ) has the highest cooling rate (>50°C s−1), with the IQ sample (Fig. 7b ) and IC sample (Fig. 7c ) following at 5–15 and 0·8°C s−1 respectively. The real cooling rate in the IC samples of Fe–10%Ni alloy was estimated to about 0·1–0·3°C s−1 based on the microstructure of the solidified sample.8 In the cases of the QT and IQ samples, two peaks are clearly seen. However, in the IC sample, representing a lower cooling rate, the boundary between the two peaks is more diffuse. Overall, the critical size limit between secondary and primary Al2O3 inclusions d crit was estimated to 0·6 μm. Specifically, most of the inclusions below 0·6 μm are considered secondary inclusions and those above primary inclusions. It can be seen that the peak height corresponding to the secondary inclusions decreases strongly with decreasing cooling rates. In this case, it is likely that some of the secondary inclusions have precipitated onto primary inclusions and/or increased considerable in size.
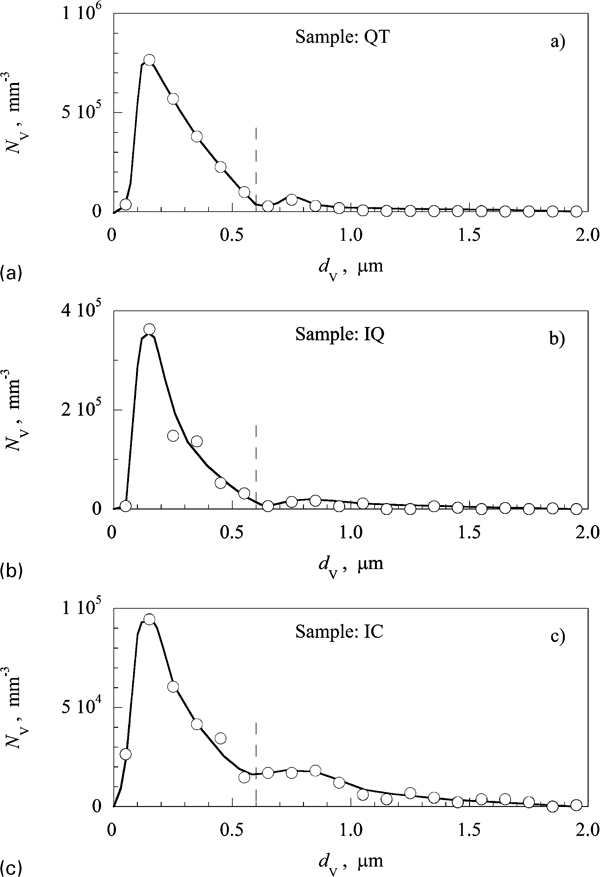
Typical PSDs determined in different metal samples of Fe–10%Ni alloy at various cooling rates
Figure 8 shows the total numbers of primary (⩾0·6 μm) and secondary (<0·6 μm) inclusions as a function of the cooling rate in different samples of the Fe–10%Ni alloy deoxidised with 0·02 or 0·06%Al. It can be seen that the number of secondary inclusions per unit volume N V increases significantly with increasing cooling rates (Fig. 8a ). However, as shown in Fig. 8b , the number of primary inclusions (⩾0·6 μm) is almost constant at the given cooling rates. A small decrease of the N V value at the lowest cooling rate can be explained by agglomeration and flotation of some of the primary Al2O3 inclusions during holding of the melt at 1600°C. The flotation of primary inclusions occurs during longer holding times of the melt at a slow cooling rate (IC sample). The tendencies obtained for primary and secondary inclusions in the metal samples are consistent with those reported by other authors. 9 9,10 From Fig. 8a , in which secondary inclusions are observed, it can be suggested that at fast cooling rates (>50°C s−1), the nucleation of secondary inclusions is very fast and the inclusion growth is limited during the cooling and solidification of the metal samples. The large scatter in the N V values of secondary inclusions in Fig. 8a may be explained by slightly different amounts of dissolved oxygen in the different samples. However, the scatter of data points is a lot less at low cooling rates because most of the secondary inclusions have precipitated on the surface of the primary inclusions during cooling and solidification of the melt. It should be noted that the oxygen contents estimated from the analysed amount of secondary Al2O3 inclusions in QT samples correspond satisfactorily, in most cases, with the dissolved oxygen in [Al]/Al2O3 equilibrium at 1600°C. This experimental finding indicates that the reoxidation of the melt during QT sampling is negligible. In addition, the precipitation of secondary inclusions onto primary inclusions seems to be small at this higher cooling rate. However, based on the results from the SAE 1146 and 17CrMo4 industrial samples it should be considered that this phenomenon may not be valid for higher contents of dissolved oxygen and especially for higher contents of sulphur.
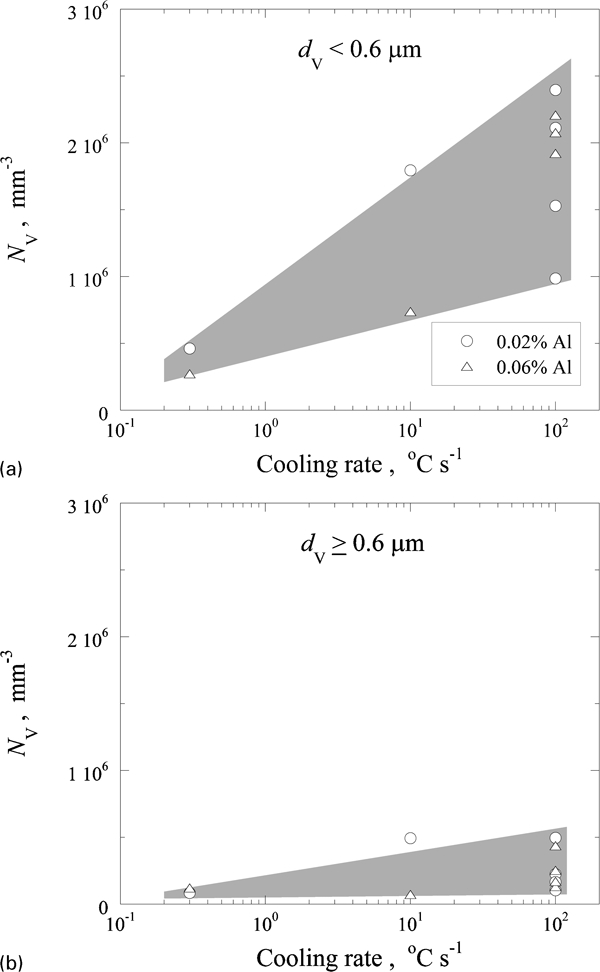
Total number of a secondary and b primary inclusions in Fe–10%Ni samples as function of cooling rate
Inclusion characteristics in different industrial steel samples
As mentioned above, the heterogeneous precipitation of secondary oxide, nitride and sulphide inclusions on primary inclusions changes drastically the characteristics of the inclusions during sampling of the liquid steel. The PSDs in various industrial steel samples with different contents of oxygen, nitrogen and sulphur were investigated.
The characteristics of the inclusions in each industrial steel grade are shown in Table 3. It can be seen that most of the inclusions (80–100%) in all samples were ‘spherical’ or ‘spherical and regular’ oxide inclusions. However, the LP-12 sample from the 28MCB5 steel contained ∼20% ‘cubic’ nitride inclusions. Moreover, two samples of the high sulphur steels (SAE 1146 and 17CrMo4) contained about 19 and 4% respectively, of elongated and dendrite shaped MnS inclusions, in the size range 1–30 μm and with an aspect ratio between 1·5 and 25. It may be assumed that this type of sulphide precipitated in interdendritic or intergranular regions during solidification of the last part of liquid steel containing a high S content. Therefore, these MnS inclusions are considered to be secondary inclusions. This type of sulphide inclusion can easily be identified and were not included in the present study. However, it should be noted that some of these MnS inclusions could have precipitated heterogeneously onto the primary inclusions. Figure 9 Figures 9 and 10 show the typical PSDs in different samples obtained from low (316L and 28MCB5) and high (SAE 1146 and 17CrMo4) sulphur steels respectively. It can be seen that in all cases the PSDs have two peaks, which are assumed to correspond to ‘secondary’ (left hand side peak) and ‘primary’ (right hand side peak) inclusions. However, the peak overlap in the high sulphur steels (SAE 1146 and 17CrMo4 in Fig. 10) is quite large due to the precipitation and growth of inclusions about 0·6–1·0 μm. Overall, the boundary between the ‘secondary’ and ‘primary’ inclusions is located at approximately the same inclusion size as that for the laboratory scale samples (∼0·6 μm), as shown in Figure 6 Figs. 6 and 7. Therefore, a value of d V = 0·6 μm is used below as the critical value d crit for the separation of secondary and primary inclusions in the PSDs.
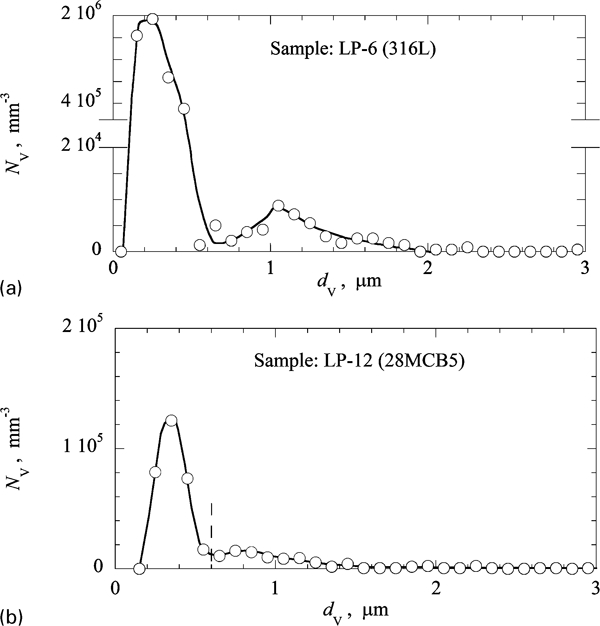
Typical size distributions of inclusions determined in 316L and 28MCB5 liquid steel samples of industrial experiments
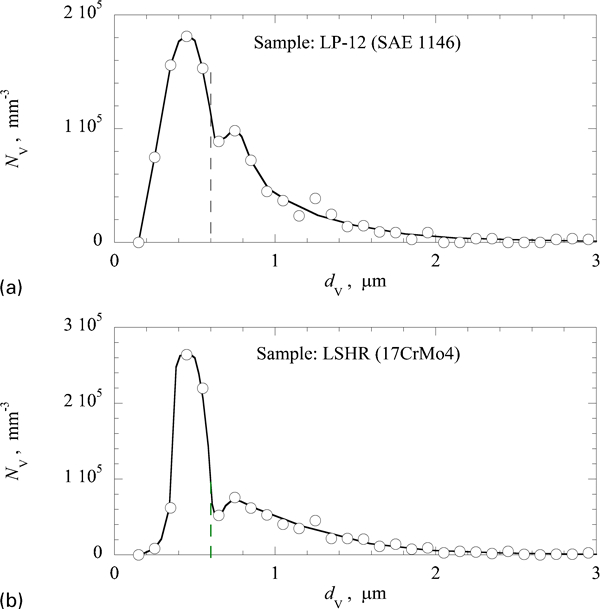
Typical size distributions of inclusions determined in SAE 1146 and 17CrMo4 liquid steel samples of industrial experiments
Inclusion characteristics obtained by 3D SEM investigation of particles on film filters after electrolytic extraction of industrial samples*
*LP, Lollipop type sample; LSHR, liquid solidification hot rolling sample; N V, number of inclusions per unit volume; d V, equivalent circle diameter.
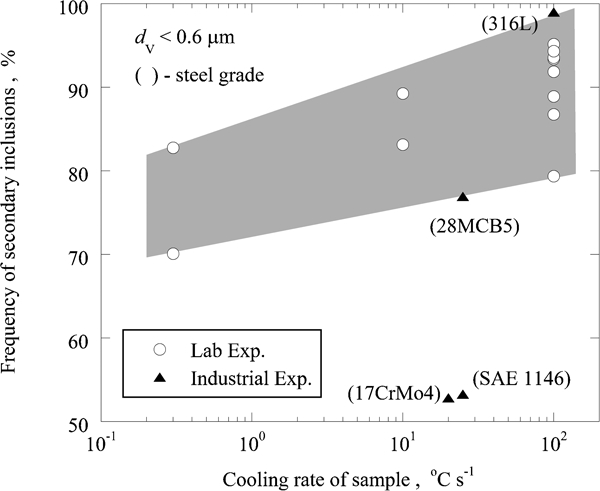
Table 4 shows the characteristics of the secondary and primary inclusions found in laboratory scale and industrial samples. It can be seen that the population of secondary inclusions (%N V) varied from 79 to 99% in the QT and IQ samples (Fe–10%Ni), and the LP-6 (316L) sample. These samples contained very low amounts of sulphur and were obtained at the highest cooling rate (>50°C s−1). The %N V values are within the range found in another study,10 using the comparable rapid solidifying total oxygen sampler (TOS) pin samples, where 87–98% the inclusions were small spherical inclusions with an average size of 0·5 μm. The LP-12 sample from the 28MCB5 steel (cooling rate ∼25°C s−1 and <0·030%S) contained ∼77% secondary inclusions, which corresponds well to the population of the secondary inclusions in the IC samples of Fe–10%Ni alloy (cooling rate <1°C s −1 and <0·001%S). In comparison, the frequency of secondary inclusions in the LP-12 sample of the high sulphur steel SAE 1146 (cooling rate 25°C s−1 and 0·08–0·13%S) and the LSHR sample of the high sulphur steel 17CrMo4 (cooling rate 20–25°C s−1 and ∼0·030%S) are both 53%. However, it should be pointed out that the size and composition of most primary inclusions were changed significantly due to the heterogeneous precipitation of secondary sulphides.
Characteristics of secondary and primary spherical inclusions obtained by 3D SEM investigations of particles on film filter after electrolytic extraction*
*QT, sample by quartz tube; IQ, water quenched ingot sample; IC, ingot sample cooled till 1200°C; LP, Lollipop type sample; LSHR, liquid solidification hot rolling sample; N V, number of inclusions per unit volume; d V, equivalent circle diameter.
Figure 11 shows the frequency of secondary inclusions in the total inclusion population as a function of the cooling rate in the samples. It can be seen that there is a tendency for an increase in the %N V value of secondary inclusions with an increase in cooling rate for most industrial and laboratory samples. It should be noted that the samples with high S contents (SAE 1146 and 17CrMo4) do not fall within the same range as those samples where the majority of the inclusions are oxides.
Frequency of secondary inclusions in total PSDs as function of cooling rates of samples in laboratory and industrial experiments
The composition analysis of spherical inclusions on film filters after electrolytic extraction showed that most of the secondary and primary oxide inclusions in the steels with ⩾0·03%S were covered by sulphides. Typical compositions of the spherical inclusions having different sizes are shown in Table 5. It can be seen that the MnS content in the spherical inclusions varied in a wide range, from 0% in pure oxide inclusions in low S steels, to 100% in pure MnS or MnS coated oxide inclusions in high S steels. According to Fig. 4, the thickness of the precipitated MnS layer is >1 μm in the case of SAE 1146 steel grade, assuming that all of the sulphur precipitates heterogeneously. However, it should be noted that inclusions detected as pure MnS were also observed in this sample. The finding that a small amount of oxide was present in the inclusions means that the oxide core is probably very small in comparison to the thick outer layer of MnS. Because of the depth analysed by the EDS being normally around 0·5–1·5 μm, it is only possible to detect a small amount of oxides, as expected from Fig. 5. It is clear that the cooling rate in these steel samples is not high enough to prevent heterogeneous precipitation of sulphides onto primary oxide inclusions. In this case, the characteristics of primary inclusions (such as particle size, number and composition) change drastically during sampling of liquid steel containing high levels of sulphur (>0·03%S).
Composition of typical spherical inclusions (in normalised mass - %) obtained by analysis of particles on film filters after electrolytic extraction*
*QT, sample by quartz tube; IQ, water quenched ingot sample; IC, ingot sample cooled till 1200°C; LP, Lollipop type sample; LSHR, liquid solidification hot rolling sample.
Based on the obtained results, it may be concluded that the characteristics of most primary oxide inclusions with sizes larger than 0·6 μm can be determined in LP-6 samples (>50°C s−1 cooling rate) taken from liquid steel with a sulphur content smaller than 0·03%.
Conclusions
The change in inclusion characteristics (such as size, number and composition) during sampling and solidification of liquid steel was investigated as a function of sampling parameters, as well as the oxygen and sulphur contents in the steel. A possibility for investigation of the original primary inclusions without heterogeneous precipitation of secondary inclusions was evaluated in various laboratory and industrial samples. The following conclusions were obtained.
In most cases, the obtained PSDs have two peaks, which correspond to ‘primary’ and ‘secondary’ inclusions. The height and overlap of the two peaks depends on the cooling rate, steel composition (S content in the present study) and accuracy of the investigations of the PSDs. A boundary size limit between the secondary and the primary inclusions d crit in the laboratory and the industrial samples was found at ∼0·6 μm.
The number of secondary inclusions in the liquid steel samples increased significantly with an increased sample cooling rate. However, the number of primary inclusions is almost constant in the cooling rates of steel samples investigated.
The samples obtained at cooling rates larger than 50°C s−1 (as a Lollipop with a 6 mm thickness) can be recommended for determination of the original characteristics of primary oxide inclusions in low sulphur steels (<0·03%S in the present study). In this case, the size of the inclusions can be used to separate most of the secondary inclusions from the total inclusion population.
During sampling of liquid steel with high levels of sulphur (⩾0·03%S) a significant amount of secondary sulphides precipitated heterogeneously onto the primary oxide inclusions, even at cooling rates of 20–25°C s−1. In this case, it is not possible to separate primary oxides from secondary sulphides by size, composition and morphology. As a result, the original characteristics of primary inclusions (such as particle size and composition) change drastically during sampling of liquid steel with high levels of sulphur.