
Abstract
The influence of a swirling flow inside the submerged entry nozzle on the structure and the stability of a liquid metal flow in a physical model of a slab casting mould are investigated. For visualisation of the flow, contactless inductive flow tomography (CIFT) is applied. As expected and desired, the swirling flow leads to a stronger upward fluid motion along the walls. At the same time, however, the oscillatory character of the flow becomes stronger. These flow features obtained with CIFT are shown to be in reasonable agreement with independent measurements using ultrasonic Doppler velocimetry. Preliminary results of numerical simulations also show a similar behaviour.
Introduction
Recently, the use of swirling flow submerged entry nozzles (SENs) has attained considerable attention for various versions of steel casting, including round billet casting1 as well as slab casting.2 For the case of billet casting, the usual single port SEN forms a strong downward flow in the mould that makes flotation of inclusions and bubbles difficult. The idea of using a swirling flow SEN is to introduce centrifugal forces into the flow field that are expected to generate a stronger upward current along the wall. This general idea has been confirmed in an experiment with Wood’s metal.1 However, the details of the mechanism, in particular, the critical swirl number for the onset of the effect, are very much dependent on the presence of an overall rotation in the mould induced by a supporting electromagnetic stirring device (M-EMS). Interestingly, swirling flow SENs have also been tested successfully in slab casting, although for a different motivation, to avoid self-excited flow oscillations in the mould.2
An alternative to the use of rotating impellers1 or swirl blades2 is the utilisation of an EMS to drive a rotation in the SEN. In this paper, we report, for the first time, on the effect of such EMS on the flow in the mould. For the work reported, the usual electromagnetic stirring by coils carrying ac currents with appropriate phase shifts is modelled in the experiment by the induced magnetic stirring due to the rotation of a pair of permanent magnets. The experiments have been carried out at the so called Mini-LIMMCAST facility at Helmholtz-Zentrum Dresden-Rossendorf. This facility is a small mock-up of a slab casting installation in which steel is replaced by the eutectic Ga–In–Sn alloy that has the advantage of being liquid at room temperature.3
While the original double port SEN of the Mini-LIMMCAST facility was replaced by a single port SEN, as it would be more typical for billet casters, it was decided not to change the shape of the pre-existing slab casting mould for the first test experiments. This means that the experimental set-up represents a sort of ‘hybrid’ between a slab caster model (concerning the mould) and a billet caster model (concerning the single port SEN). Accordingly, our results have to be considered with care when it comes to generalisations to the real casting process.
Mini-LIMMCAST and measuring technique
Figure 1 shows a schematic drawing of the Mini-LIMMCAST facility (see also Refs. 3–5 for more details concerning experiments with a double port SEN). A stainless steel cylinder serves as the tundish, which contains ∼3·5 L of the Ga–In–Sn alloy; Table 1 gives the material properties of Ga–In–Sn compared with those of steel. The melt is discharged through a Plexiglas tube with inner diameter of 10 mm into the mould with a rectangular cross-section of 140×35 mm2 (also made from Plexiglas). From the mould, the liquid metal flows over a weir into a storage vessel. The vertical position of the weir controls the free surface level in the mould. An electromagnetic pump conveys the melt from the vessel back into the tundish.
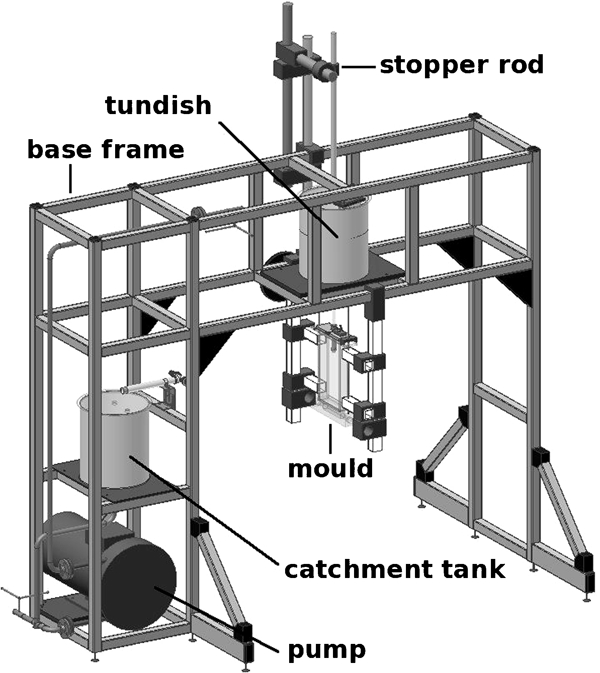
Schematic drawing of Mini-LIMMCAST facility at Helmholtz-Zentrum Dresden-Rossendorf
Material properties of Ga–In–Sn and steel
All experiments were performed in a discontinuous mode, i.e. after filling the tundish with the melt, the stopper rod was lifted to drain the fluid into the mould. This process took ∼30 s, which was sufficient to study typical flow phenomena, such as left–right oscillations. During this process, the liquid level within both the tundish and the mould were monitored using a laser and an ultrasonic distance sensor respectively. The liquid flowrate was derived from the decrease in the surface level in the tundish.
Cold liquid metal experiments of steel casting processes excel water experiments in many respects. They became feasible during the past decade as related velocity measurement techniques started to allow an almost complete monitoring of the melt flow.6 One of the viable methods is ultrasonic Doppler velocimetry (UDV), which provides the velocity component in the beam direction. Actually, this technique has been used intensively to study various single and two-phase flow phenomena in the Mini-LIMMCAST facility.3 – 5 In the present paper, however, it will serve only for the sake of comparison with the results of another technique, whose advantage of being completely contactless makes it attractive not only for cold liquid metal experiments but also for real steel casting applications.
The contactless inductive flow tomography (CIFT) 7 7,8 technique is based on Faraday induction, and relies on the fact that, by exposing the flow of a highly conducting melt to an externally applied magnetic field, electrical currents are induced, which give rise to a perturbation of the applied field. This flow induced field perturbation, which is measurable outside the fluid volume, contains information about the flow structure and can be exploited to reconstruct the velocity field. By applying consecutively the external magnetic field in different directions, different induced currents and magnetic fields can be produced from the same velocity structure. This enables a tomographic representation of the velocity field. Contactless inductive flow tomography was proposed for the first time by Stefani and Gerbeth,7 and later, its experimental feasibility was verified by Stefani et al.8 For the special case of slab casting, the general method can be reduced again, since in this case, one external field and the measurement of the induced field at the narrow faces of the mould is sufficient for determining the, basically, two-dimensional velocity field. More details of previous experiments with a double port SEN can be found in Ref. 9.
Note that in addition to CIFT, mutual inductance tomography (MIT) was utilised, whose suitability for identifying the structure of the two-phase Ga–In–Sn/argon flow in the Mini-LIMMCAST has been described recently.4 In the present experiment, however, the MIT technique was used mainly to verify the filling status of the SEN. Since, in this work, the SEN turned out to be completely full (at least for the relevant parameters) without argon flow, the MIT results will not be discussed further.
Figure 2 shows the final experimental set-up as it was used for the swirling flow experiment. The single port SEN is a simple straight tube with an inner diameter of 10 mm, and the outlet at z = 240 mm. The magnetic stirrer, shown in detail in Fig. 3, has been installed below the tundish. This stirrer consists basically of a rotating pair of permanent magnets, which can be driven at up to 50 Hz, which is expected to produce a significant swirl in the SEN.
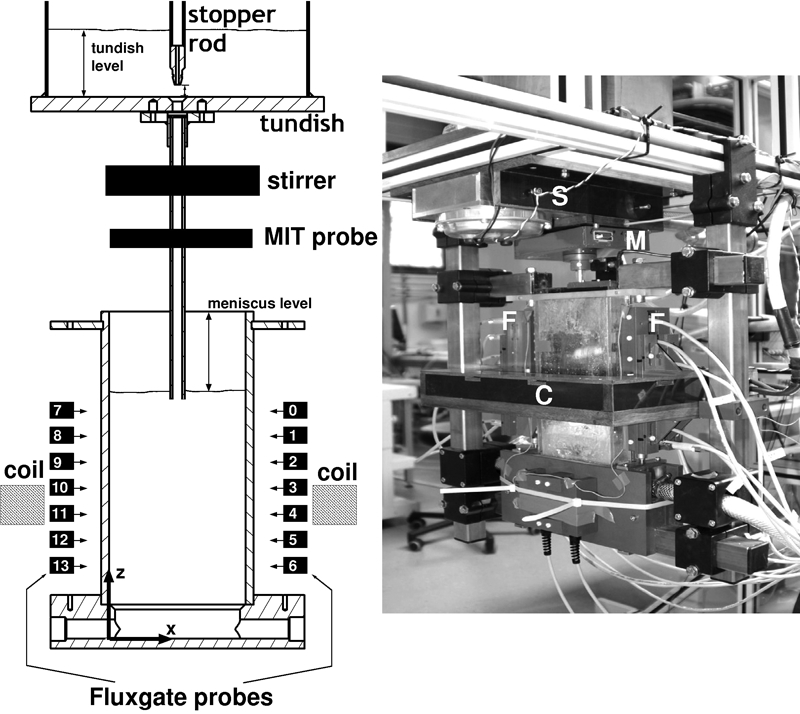
Sketch and photograph of Mini-LIMMCAST facility as modified for swirling flow SEN experiments (S: stirrer; M: MIT sensor; F: fluxgate sensor array for CIFT; C: coil for measuring field)
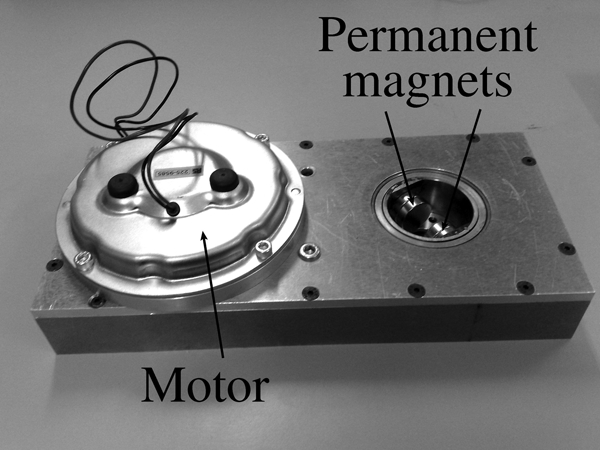
Details of stirrer with motor (left) and two permanent magnets (right), which revolve around the SEN: maximal achievable rotation rate is ∼50 Hz
Results
During the experimental campaign, a total of 143 runs were carried out, with varying stopper rod positions and rotation rates of the stirrer. Figure 4 gives an overview of the investigated parameter combinations. The number at each point in the matrix indicates the number of individual runs that were carried out for the respective parameter combination. To put the values on the ordinate axis in context, a stopper rod position of 11 mm virtually closes the flow, while a stopper rod position of 15 mm is almost completely open.
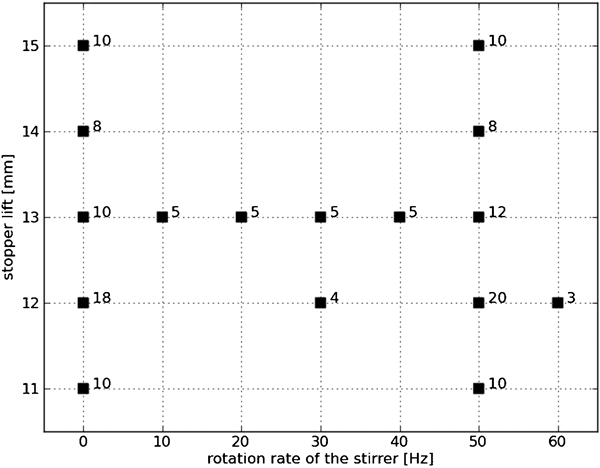
Overview of experimental runs for various combinations of stopper rod position and stirrer rotation rate: numbers of runs for each parameter combination are also indicated
In the following, we will focus mainly on the experiments for an intermediate stopper rod position of 13 mm. Figure 5 shows, always for one representative run with the stirrer rotation rates 0, 10, 20, 30, 40 and 50 Hz, the time dependence of the stopper rod position, of the level in the tundish, of the distance of the meniscus from the upper edge of the mould and of the pressure measured in the argon supply pipe (note, however, that the argon flow was always set to zero). From the linear decrease in the level in the tundish, it is possible to infer the flowrate in the SEN. In addition to those flow related data, Fig. 5 also shows four (out of seven) of the measured magnetic field signals at the left and the right narrow face.
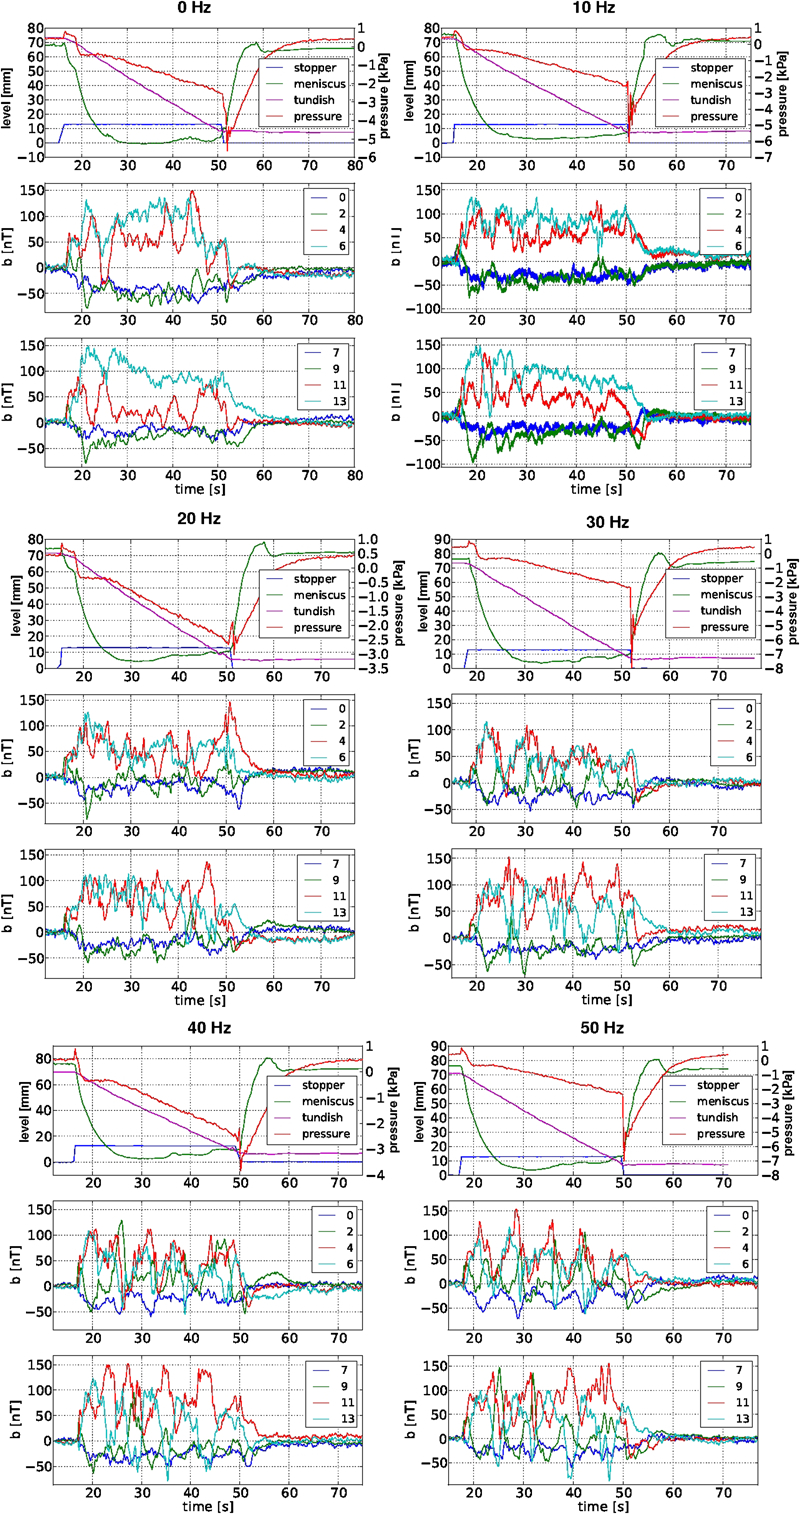
Time dependences of stopper rod position, of fluid level in tundish, of distance of meniscus from upper edge of mould, of pressure in argon supply tube as well as of 2×4 measured induced magnetic fields for six representative runs with different stirrer rotation rates between 0 and 50 Hz: numbers of magnetic field signals correspond to fluxgate sensors indicated in Fig. 2
While the level in the tundish, the meniscus height and the pressure show a rather stable and regular behaviour, the magnetic signals are in general much more irregular. This observation points to a significant movement of the flow in the mould. Interestingly, for increasing stirrer rotation rate, not only higher amplitudes are observed but, at the same time, also an increasing regularity of the magnetic field fluctuations. Clearly visible is the out of phase character of the magnetic field fluctuations at the left and the right narrow face. This gives first evidence for the left–right asymmetry of the flow that is encoded in the measured magnetic data.
For further investigation, the data from all the 2×7 fluxgate sensors were inverted using the inverse problem solver described in Ref. 9, which was only slightly modified to account for the new single port nozzle geometry. Figure 6 shows, again for the six different stirrer rotation rates, the t and x dependence of the CIFT reconstructed x component of the velocity [i.e. v x(t,x)] at the height z = 10 cm (measured from the bottom of the mould). The left–right asymmetry of the oscillations becomes clearly visible.
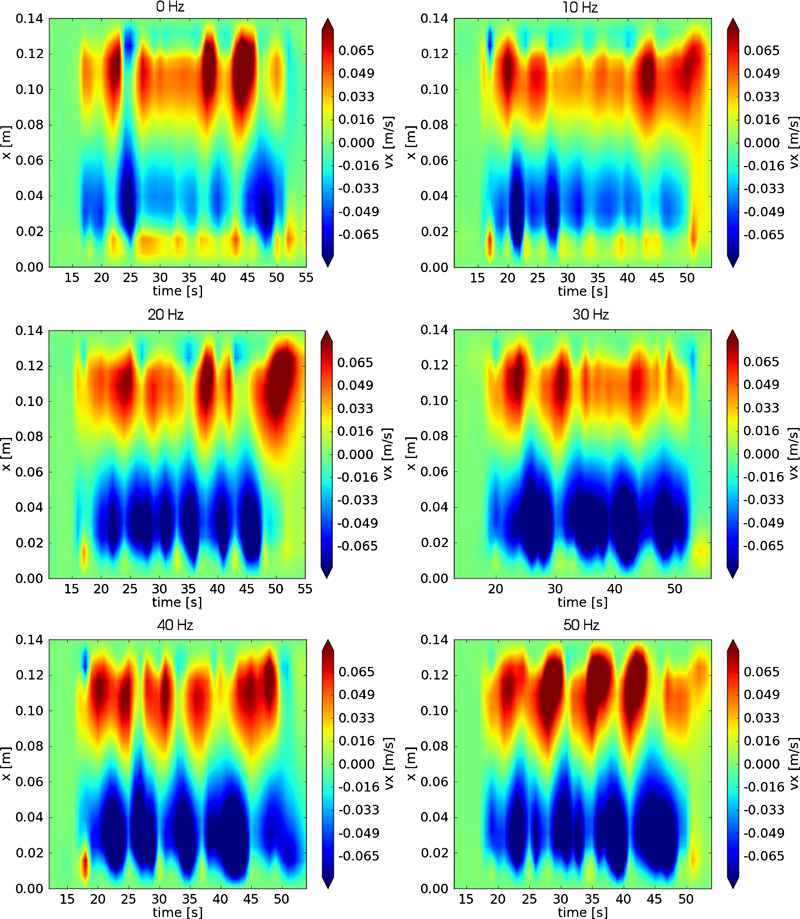
Contactless inductive flow tomography reconstructed v x(t,x) at z = 10 cm, for increasing stirrer rotation rate
The complementary t and z dependence of the CIFT reconstructed z component of the velocity [i.e. v z(t,z)] at x = 1 cm is shown in Fig. 7. There are a number of observations to be made in this figure. First of all, by increasing the stirrer frequency slightly from 0 to 10 Hz, a sort of stabilisation of the flow is observed. However, when increasing the stirrer rotation rate further, an enhancement of the fluctuation appears. At maximum rotation, the positive v z component extends to higher values of z, but the price for this is a stronger oscillation.
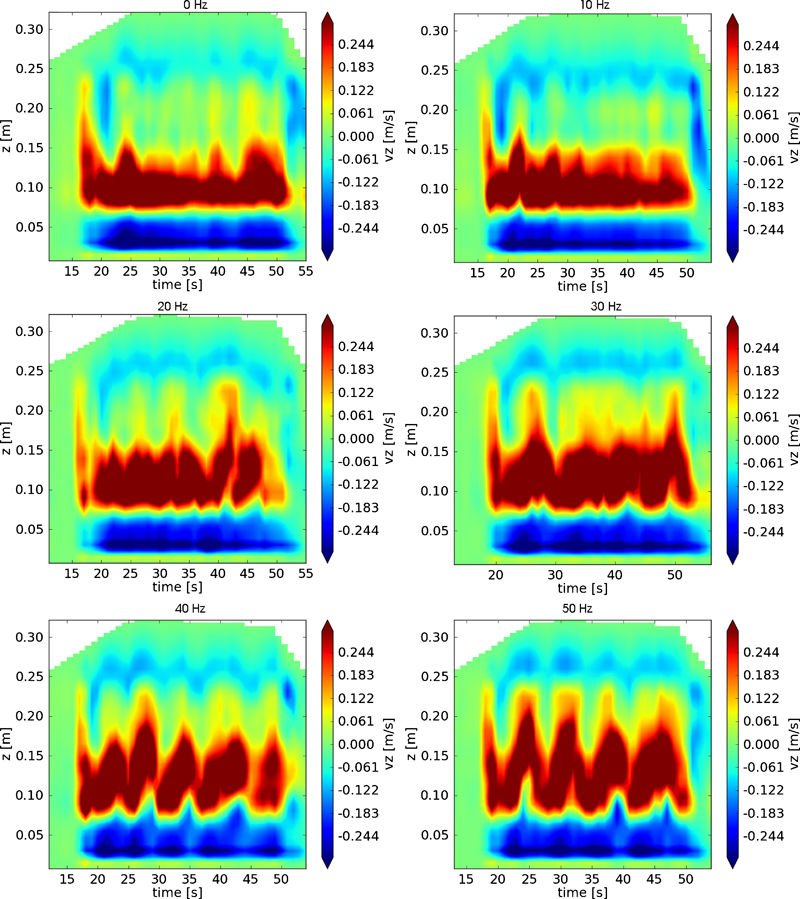
Contactless inductive flow tomography reconstructed v z(t,z) at x = 1 cm, for increasing stirrer rotation rate
The next figures show sequences of snapshots of the complete CIFT reconstructed two-dimensional velocity field (vectors), in combination with the so called λ 2 quantity (greyscale), which is the most appropriate measure for the identification of a vortex.10 In order to illustrate the movement of the dominant vortex, we have chosen eight snapshots between t = 23 and t = 37 s, with 2 s difference. While for the low stirrer rotation rate of 10 Hz (Fig. 8), the flow is mainly stationary, the case of 50 Hz (Fig. 9) shows a strong and rather regular oscillation with a clearly visible left–right asymmetry.
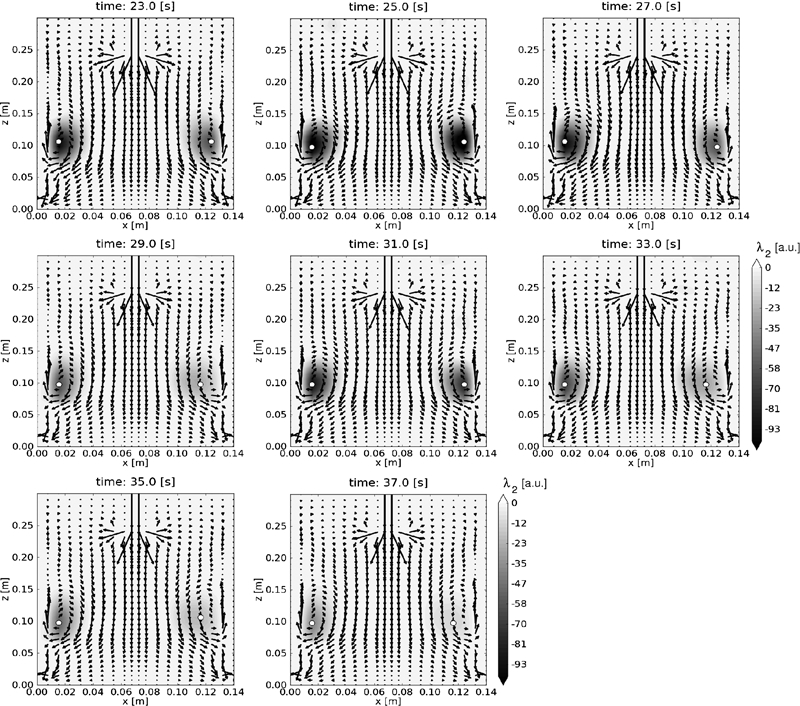
Snapshots of CIFT reconstructed velocity (vector field) in combination with quantity λ 2 (greyscale), which is most appropriate measure for strength of vortex, for stirrer rotation of 10 Hz: note rather stable position of minimum of λ 2 (indicated by small circle)
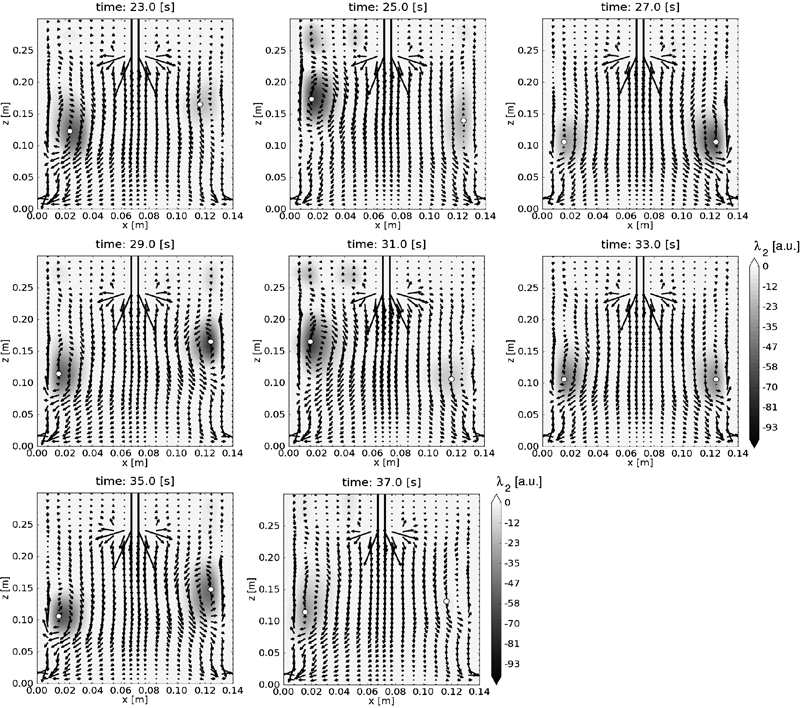
Same as Fig. 8, but for stirrer rotation rate of 50 Hz: note strong left–right asymmetric up and down movement of minimum of λ 2
Careful comparison of Figure 8 Figs. 8 and 9 gives evidence for a significant upward shift of the vortex centre with increasing stirrer rotation, as the vortex positions are vertically higher in Fig. 9, a fact that was expected and desired. However, at the same time, the position of the centre of the vortex shows a significant fluctuation in the vertical direction in Fig. 9, whereas in Fig. 8, the vortex centres have relatively stable positions over the time sequence shown. This increased fluctuation of vortex position with stirrer rotation rate is certainly not a desired feature.
The temporal character of the fluctuations can be further analysed by the spectral content. Exemplified for v x (x = 2 cm, z = 19 cm), Fig. 10 shows the power spectral density. It is evident that for higher stirrer rotation rates, significant sharpening of the spectrum is obtained around f = 0·14 Hz, hence an increasing regularity of the oscillations.

Power spectral density, averaged over five runs, of CIFT reconstructed value v x (t, x = 2 cm, z = 19 cm): note significant sharpening ∼0·14 Hz for increasing stirrer rotation rate
Comparison with UDV measurements and numerics
Although the main focus of this paper lies on the applicability of the CIFT technique for the flow reconstruction, some comparative studies were made using UDV. In Fig. 11, the results of CIFT and UDV are compared for the v x(t,x) component at two vertical positions (z = 19 cm and z = 15 cm); in both cases, for the stopper rod position of 15 mm and a stirrer rotation rate of 50 Hz. Note that the data were recorded during two different runs, since a simultaneous measurement was hardly possible due to size limitation around the mould, which does not allow for a parallel access of both measuring techniques. In spite of the fact that the UDV signal is strongly damped for large values of x, the oscillatory character of the flow is clearly visible and the data compare well for both measurements. A more detailed and quantitative comparison of the UDV and CIFT results for more parameters is left for future work.
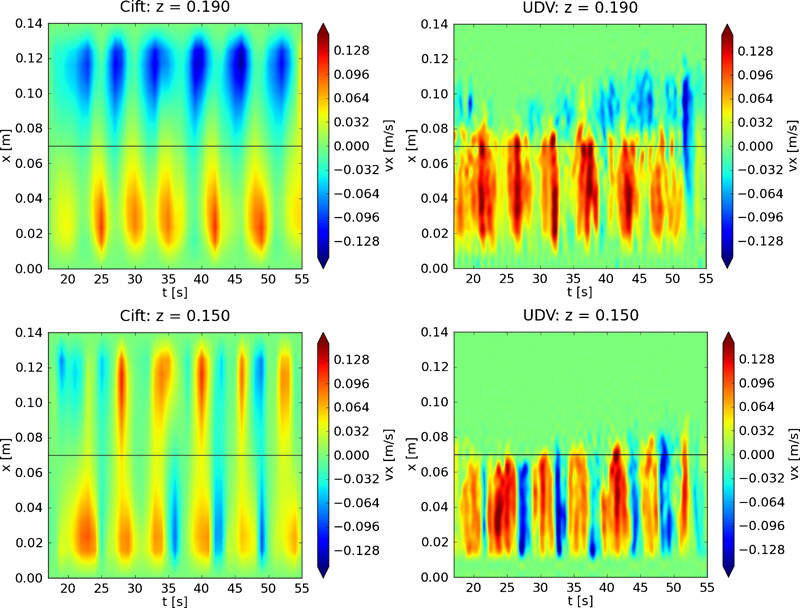
Comparison of v x(t,x), determined by CIFT (left panels) and UDV (right panels) at z = 19 cm (upper panels) and z = 15 cm (lower panels): CIFT and UDV measurements were made during two different runs, both with stopper rod position of 15 mm and stirrer rotation rate of 50 Hz, and imperfect coverage of UDV signals is due to strong damping of signals for large values of x
In addition to this cross-validation of two complementary measuring techniques, the first steps were made to simulate the flow behaviour with the CFD code OpenFOAM. As an example, Fig. 12 shows the snapshots of the resulting streamlines for the case without stirring and stirring with 50 Hz.
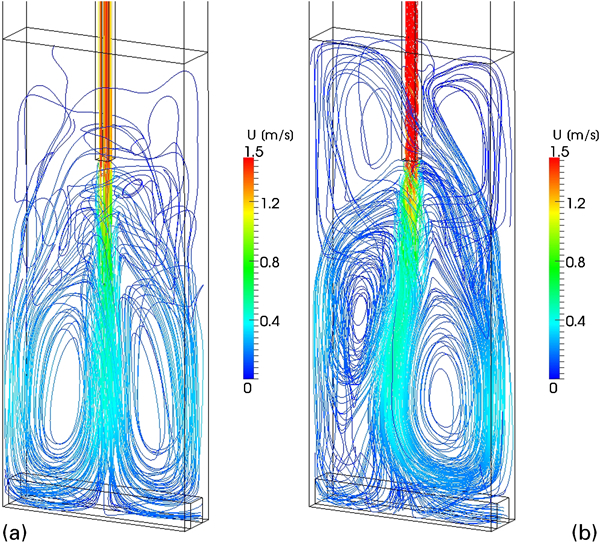
Snapshot of streamlines of velocity resulting from transient simulation of flow a without stirring and b with stirring at 50 Hz: greyscale corresponds to speed of flow
An important question here is the quantitative effect of the stirrer on the flow. Under the assumption of a rotation frequency of 50 Hz and a mean magnetic field of 0·5 T between the poles of the stirrer, a flow profile with axial velocity of ∼1·5 m s–1 and a rotational component of 0·6–0·8 m s–1 with a slight left–right asymmetry is obtained at the outlet of the SEN.
Figure 13 shows, therefore, the time dependence of the vertical position of the minimum of λ 2. As in the experiment, a similar oscillation frequency is obtained, in the order of 0·15 Hz, and also a stronger oscillation for the 50 Hz case, connected with a general shift of the vortex centre towards higher values of z. A more detailed numerical simulation and a comparison with the experimental results are under way.
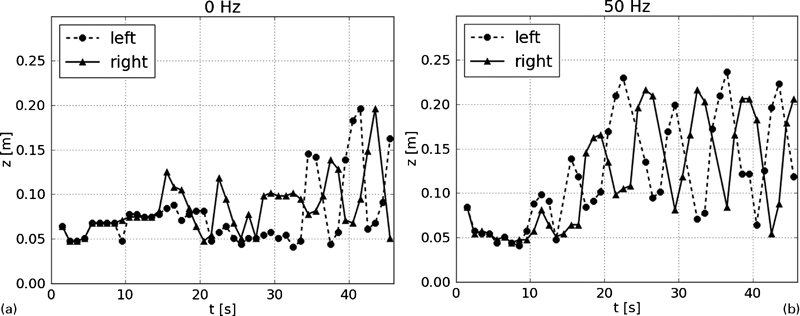
Numerically determined time dependence of vertical position z of minimum of λ 2 in left and right parts of mould: stirrer rotation rate has been set to a 0 Hz and b 50 Hz
Discussion and outlook
In this paper, the principle applicability of the contactless inductive flow tomography (CIFT) for studying the dependence of the flow in the mould on the swirl intensity in the SEN has been demonstrated. CIFT is clearly capable of reproducing the time dependent left–right asymmetry of the flow in the mould. The comparison between the CIFT results and the UDV measurements shows a good qualitative agreement. Nevertheless, the approximate and global character of CIFT and its limitations when it comes to the accuracy of local velocity values should always be recognised. While the observed oscillation is certainly a real feature of the flow, the broadness of the downward jet, for example, should be interpreted with caution. More sensors close to the bottom would be helpful for inferring this structure in more detail.
Finally, it should be noted again that the results of this experiment using a ‘hybrid’ system with a single port SEN and a broad slab caster-like mould cannot be transferred directly to the billet caster regime. For a more realistic investigation, a new billet caster-like mould would be necessary. In this respect, consideration should also be given to an enhancement of the CIFT technique, by adding another excitation coil that would help to measure the rotational components of the flow that are hidden in the present set-up of the CIFT measurement. Another step will be to study the same problem at the much larger LIMMCAST facility working with a continuous flow of SnBi.3 The installation of the CIFT technique at this larger facility is currently under way.
Footnotes
Acknowledgements
The research leading to these results has received funding from the European Union’s Research Fund for Coal and Steel (RFCS) research programme under contract no. RFSR-CT-2007-00012. The authors acknowledge the support of the European Union. Parts of this work have also been supported by Deutsche Forschungsgemeinschaft in framework of SFB 609.