
Abstract
For a typical tailor welded blank (TWB), the mechanical performances of the weld metal vary dramatically with different distances to the longitudinal centreline of the weld. Constructive models that can describe this laterally inhomogeneous behaviour of welds, however, have rarely been reported. In this work, the elastoplastic properties (i.e. hardness, Young’s modulus, initial yield stress, strength coefficient and strain hardening exponent) of a laser welded bead, made of DX56D and DP600 automotive steel sheets of different gauges, were determined according to the nanoindentation response. Based on the measured data, a constructive model of the weld bead, which has taken into account the performance inhomogeneity traversing the weld line, was built. This constructive model was justified by the fact that the numerical results of Erichsen cupping tests for TWB specimens are in good agreement with the corresponding experimental ones.
Introduction
In recent years, great efforts have been made in the utilisation of tailor welded blanks (TWBs) due to their competitive advantages over conventional sheet metal forming methods. Laser welding, as the most common fabrication method of TWBs in the modern automobile industry, creates a narrow weld and heat affected zone (HAZ) at the junction of the identical or dissimilar sheets. Hence, in most previous works, when the forming process of a laser welded blank was simulated via finite element (FE) software, the weld was either directly neglected or simply represented by a row of connected nodes or elements. These simplified methods are well justified when the welds are apart from regions of high strain. Significant loss in accuracy, however, occurs if the welds are located in large deformation zones.1 Furthermore, the expansion of TWB application fields nowadays increases the necessity of building precious constructive models to describe the laterally inhomogeneous behaviour of the welds.
In the literature related to TWB modelling, the mechanical performances of weld metals are mainly determined by the rule of mixture method. This method was proposed based on the assumption of isostrain across the weld section and has been widely used since the end of the last century.2 – 4 In addition to the rule of mixture, Cheng et al. 5 used a weld only subsize tensile specimen with the reduced gauge width of ∼2·0 mm and a real time microscopic recording system to determine the mechanical properties of the weld. Recently, Chung et al. 6 developed the continuous indentation method to determine the mechanical properties of the metal active gas weld and HAZ. In their work, indentation simulations were carried out for a total of 840 different combinations of hardening parameters, and the mechanical properties were determined by comparing the measured load–depth curves with the simulated ones. However, it is clear that in all the above methods or references, at least three important fundamental issues remain:
for the rule of mixture and the weld only subsize tension methods, the performance inhomogeneity of the weld metal has not been taken into account
for the continuous indentation method, it cannot be applied to a narrow laser welded bead due to the limited size of the investigated region, although the performance inhomogeneity of the weld metal has been considered
the constructive model of weld metals describing the performance inhomogeneity has not been built yet.
Compared to the above methods, the instrumented indentation technique is a non-destructive and more convenient approach to determine the mechanical properties of a narrow laser welded bead. In fact, some investigations 7 7,8 have been performed on the correlation between flow stress and hardness since the middle of the last century. In recent years, especially after the development of depth sensing instrument, the mechanical characterisations including Young’s modulus, yield stress and strain hardening exponent of materials were further represented by their hardness values.9 – 14 Although much theoretical work has been performed to derive the elastoplastic properties of materials from depth sensing indentation response, this method has not been applied to measure the elastoplastic behaviours of weld materials in TWBs.
The objective of this paper is to preciously build the constructive model, which takes into account the performance inhomogeneity traversing the weld line, based on the measured data with the application of a nanoindenter.
Theory
Anisotropic yield function
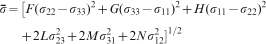
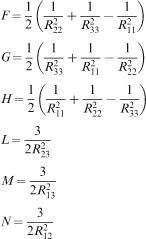
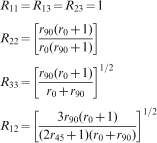
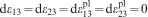
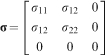
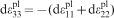
The anisotropic plastic behaviours of the base steel sheets are described by the general quadratic yield condition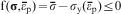


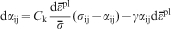
Non-linear isotropic/kinematic hardening law
The combined isotropic/kinematic hardening model takes into account the Bauschinger effect and the anisotropy induced by workhardening. This model provides a more accurate approximation to the stress–strain relation than the isotropic or linear kinematic hardening models when metal sheets are subjected to cyclic loading, which occurs frequently for the automotive products used in practice.
The yield function with non-linear isotropic/kinematic hardening law can be written as


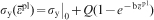
The kinematic component of this model describes the translation of the yield surface in stress space through the back stress 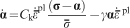

Theoretical basis of deriving properties from indentation response
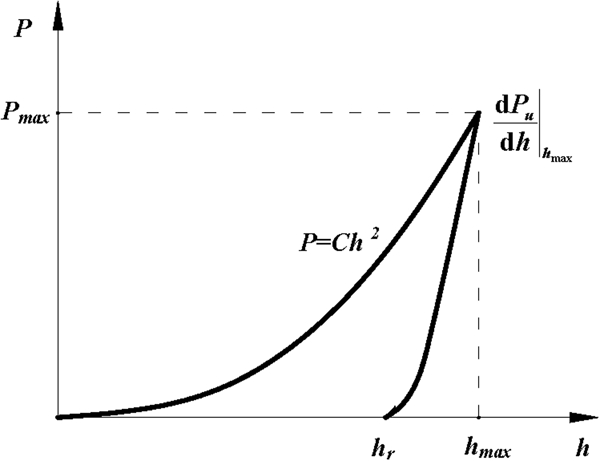
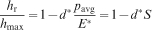
As mentioned above, the mechanical properties of the investigated material can be estimated from the measured loading and unloading load–depth P–h responses by using a nanoindentation test machine. This is a so called ‘reverse problem’. Figure 1 schematically shows the typical P–h relationship of an elastoplastic material to sharp indentation. The following independent quantities can be directly obtained from a single P–h curve: maximum load P max, maximum indentation depth h max, initial unloading slope dP u/dh and residual depth at complete unloading h r.
Schematic of typical load–depth curve of elastoplastic material
It is well known that the loading response is governed by Kick’s law

The effective elastic modulus of the indenter specimen system E* is defined as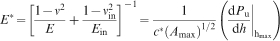

Therefore, suppose that Poisson’s ratio of the specimen is known, its Young’s modulus can be obtained as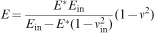
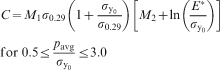
In this work, σ
y0 and σ
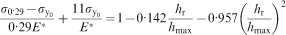
0·29 are used to denote the initial yield strength and the stress corresponding to the characteristic plastic strain of 0·29 for the indented material in a uniaxial compression process respectively. The relationship between σ
0·29−σ
y0 and h
r/h
max can be fitted by the following polynomial, which holds for Vickers, Berkovich and circular conical indenters
17
19
17,19,20
It is assumed that the plastic deformation behaviours of materials follow a simple Hollomon type power law, i.e.


Material properties
Base materials
In this study, two automotive sheets, including hot dip zinc coated DX56D steel sheets with thickness of 1·0 mm and dual phase DP600 steel sheets with thickness of 0·75 mm, were considered. The chemical compositions of the sheets are listed in Table 1. The principle of choosing these materials was for practical use. DX56D steel is a conventional material used for autobody panels. Dual phase (DP) steel, which is one of the main substituting materials for weight saving and environmental friendly purposes of vehicles, is particularly suitable for structure components due to its superior combination of strength and ductility, no yield point elongation and a higher strain hardening rate than the other steels. 22 22,23
Chemical compositions of base materials, wt-%
The mechanical properties of the automotive sheets were obtained by uniaxial tension tests using a Zwick Z100 material testing machine. The measured mechanical properties along the rolling, 45° and transverse directions are shown in Fig. 2 and Table 2. The true stress–true strain data in the aforementioned three directional uniaxial tests were fit to a Hollomon type equation, and the results were summarised in Table 3. Note that, to obtain reliable material parameters and reduce occasional errors, the results of each case were the mean of three replicates.
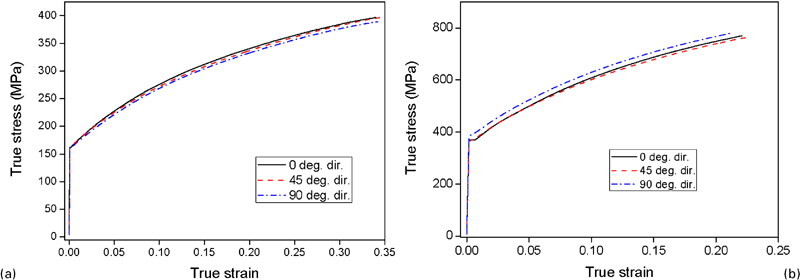
Hardening curves of two base sheets along rolling, 45° and transverse directions
Mechanical properties of base sheets along rolling, 45° and transverse directions
Parameters of Hollomon type hardening for base sheets along rolling, 45° and transverse directions
Welding method
Nd∶YAG laser welding was used for the joining of DX56D and DP600 steel sheets with a laser welding machine (model no JJM-1GXY-500). The welding parameters used in the welding process are listed in Table 4. The base materials were welded parallel to the rolling direction.
Laser welding parameters for investigated TWBs
Here, the weld geometry of the investigated TWBs can be clearly described based on the etched metallographic section of the weld shown in Fig. 3. As mentioned above, the cross-sectional thickness of the welded specimen was not uniform. When using tension tests to determine the mechanical behaviours of weld materials, in most cases, the measure of inserting a thinner base sheet (i.e. the pad) at the grip parts of the welded specimen has been taken to achieve the isostrain condition. However, the accuracy of the corresponding results may be influenced in this case due to the irregular profiles of the weld. In this study, this problem was avoided by using depth sensing indentation test.
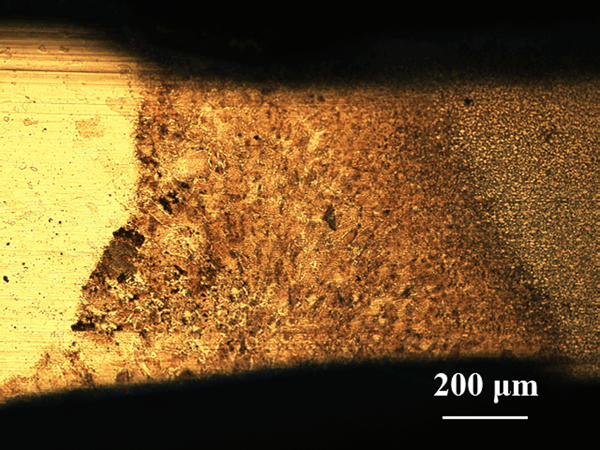
Etched metallographic section of weld zone in investigated TWB
Property characterisation of weld metals by using nanoindentation test
The indentation tests were conducted with a Nano Indenter G200 system (Agilent Technologies Inc., Santa Clara, CA, USA) equipped with a three-sided pyramidal indenter (i.e. Berkovich indenter), as shown in Fig. 4a . The included tip angle of the Berkovich indenter is 130·6°. On the weld cross-section of the specimen, 20 test points were equidistantly arranged in a row, with their numbers increased progressively from the DX56D base metal side to the other side (Fig. 4b and c ). The maximum depths for all of the test points were 2000 nm. The corresponding strain rates were set to be 0·05 s−1 for both loading and unloading stages. In order to achieve equilibrium and to get a more well defined slope of unloading, a dwell time of 10 s was implemented at the maximum load.
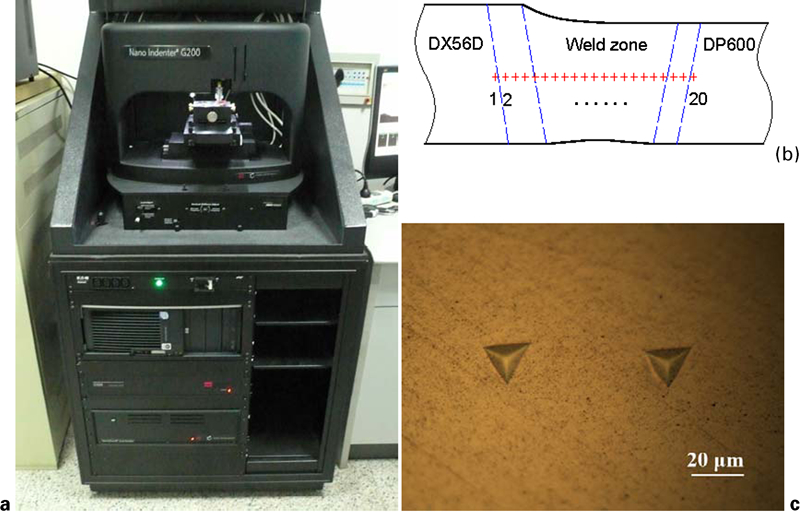
Nanoindentation test
Nanoindentation results and discussion
The experimental nanoindentation response of the welded specimen is presented in Fig. 5. It is shown that for a given maximum depth, the values of the maximum loads and loading slopes decrease distinctly with increasing distance from the weld centreline.
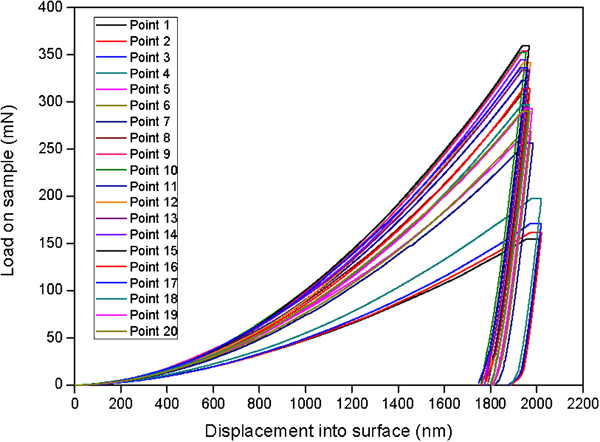
Experimental indentation responses in weld zone of specimen
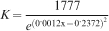
Hardness
The typical relationship between hardness and indentation depth for a single point, e.g. test point 1, is presented in Fig. 6a . Here, the hardness first increases sharply to the peak, then declines rapidly and eventually flattens. The values of hardness corresponding to the indentation depth beyond 1000 nm were averaged as the mean hardness of test point 1. In fact, all of the other test points have a similar tendency as test point 1. It can be seen from Fig. 6b that the mean hardness generally decreases with increasing distance from the weld centreline, and the mean hardness beside the DP600 steel side is distinctly higher than that beside the DX56D steel side.
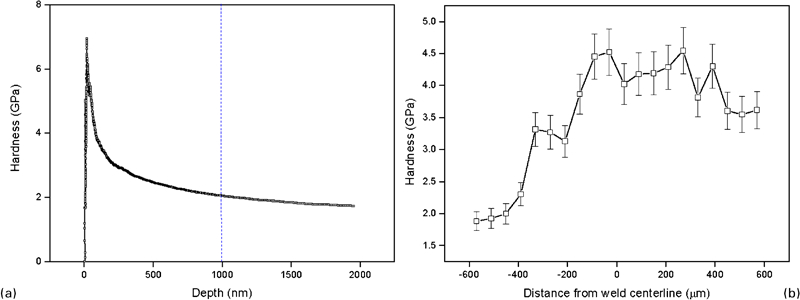
Hardness test results
Elastic and plastic performance and constructive model
Figure 7 shows the plots of Young’s modulus, initial yield stress, strength coefficient and strain hardening exponent traversing the weld line respectively. As we can see, although there are some fluctuations, the Young’s modulus, initial yield stress and strength cofficient generally decrease with increasing distance from the weld centreline, and the values beside the DP600 steel side are higher than that beside the DX56D steel side. The strain hardening exponent, however, indicates the opposite tendency.
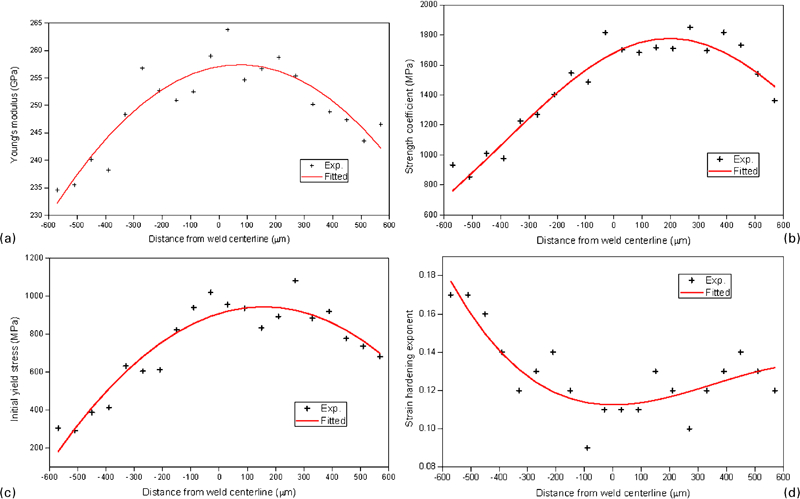
Experimental elastic and plastic parameters of weld metal and corresponding fitted curves
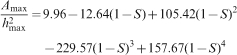
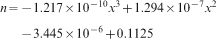
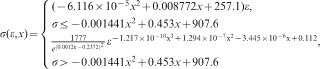
In order to build the elastoplastic constructive model of the weld accounting for the performance inhomogeneity in the weld width direction, the Young’s modulus, initial yield stress, strain hardening exponent and strength coefficient of the weld metal were fitted to their corresponding suitable equations as follows

Verifications
In order to validate the newly built constructive model of the weld, Erichsen cupping tests were performed experimentally and numerically on the welded specimens.
The experimental Erichsen cupping test was carried out using a GBS-60B cupping test machine. The initial dimension of the TWB sample was 95·0×95·0 mm. The blank holding force applied to prevent inflow of sheet material into the deformation zone was ∼10 kN. In case the failure of the TWB sheet was initiated, the penetration depth of the punch was identified as the value of the Erichsen index. In this test, graphite was used as a lubricant between the blank and tools.
Numerical simulation of the cupping process was conducted using the general purpose FE package ABAQUS. In order to achieve a balance between computational efficiency and accuracy, a reasonable mesh density must be adopted. Here, the sample was modelled with a total of 15 120 reduced integration four-node shell elements (S4R) with a fine mesh near the weld region and a gradually coarser mesh further away to ensure numerical accuracy. Seven integration points through the thickness were employed due to its cost effectiveness and accuracy in results.
In order to input the property data of the weld into the ABAQUS/Explicit code, a set of hardening parameter combinations were firstly obtained from the constructive model equation (i.e. equation (25)). Then, the whole weld (including the HAZ) was divided into six zones, each of which was assumed to be stepwise homogeneous, and its properties were obtained by averaging the hardening data within the zone. Moreover, the thicknesses of the six zones were 0·95, 0·90, 0·85, 0·80, 0·75 and 0·75 mm respectively based on the metallographic section of the weld zone (Fig. 3).
For the base materials of the welded sample, the constructive model with the quadratic anisotropic yield function Hill’48 and non-linear isotropic/kinematic hardening law was adopted. The anisotropic coefficients of Hill’48 and hardening law parameters are listed in Table 5 Tables 5 and 6 respectively. As for the weld materials, the isotropic properties were assumed by applying 1·0 for all anisotropic coefficients in the yield function. Additionally, the isotropic hardening law was also applied to the weld for simplicity.
Anisotropic coefficients of Hill’48 for base steel sheets
Material parameters of non-linear isotropic/kinematic hardening law
The friction between moulds was treated as Coulomb friction, where the magnitude of the friction force is constant, but its direction is always opposite to that of the sliding velocity. Corresponding to the practical conditions of the experimental test, a set of optimal friction coefficients was chosen to provide good correlation with the experimental data.
The forming limit diagram calculations were conducted separately on the basis of the Swift’s diffuse instability27 and the Hill’s localised instability28 theories using the Hollomon type hardening law (Fig. 8). It can be seen from this figure that the forming limits of the weld materials are much higher than those of the base materials and the forming limits vary considerably within the weld zone. This indicates that the forming limits of the base and weld materials have a tight correlation with their strain hardening exponents.
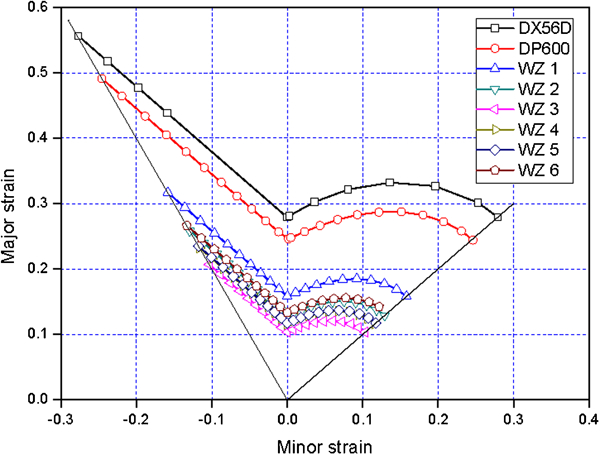
Forming limit diagram of base and weld materials
As shown in Fig. 9, the experimental and simulated failure onsets in the Erichsen cupping tests were compared and found to be in good agreement.
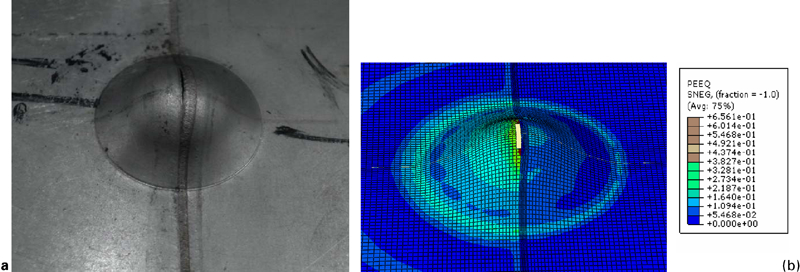
Failure onset in Erichsen cupping tests (PEEQ denotes equivalent plastic strain)
In the Erichsen cupping test, the centrally welded sample was under the balanced biaxial stretch mode, and the combination of the effects of strength and ductility determines the failure onset, which shows a close relationship with the weld movement. Generally, both strengths and thicknesses of the base materials influence the weld movement in the TWB sample, i.e.
sheet material flows from the weaker base metal side towards the stronger one
on the other side, sheet material flows from the thinner side to the thicker one.
In this case, the welded sample was made of two dissimilar base materials of different thicknesses. Compared to the DP600 steel and the weld, the DX56D steel sheet has the highest ductility but the lowest strength. Attributed to the joint effects of strengths and thicknesses, the weld moved to the DP600 steel sheet, and the strain was localised in the DX56D metal side beside the weld (Fig. 9b ). Failure onset eventually occurs parallel to the weld line in the strain concentration zone, as both demonstrated in Fig. 9a and b .
The punch load versus stroke profiles of the Erichsen cupping tests obtained by the experimental and numerical methods were compared in Fig. 10. The differences in Erichsen index values and maximum punch loads between simulated and experimental data were 1·5 and 6·8% respectively. This indicates that the experimental data are also well correlated with the simulated ones.
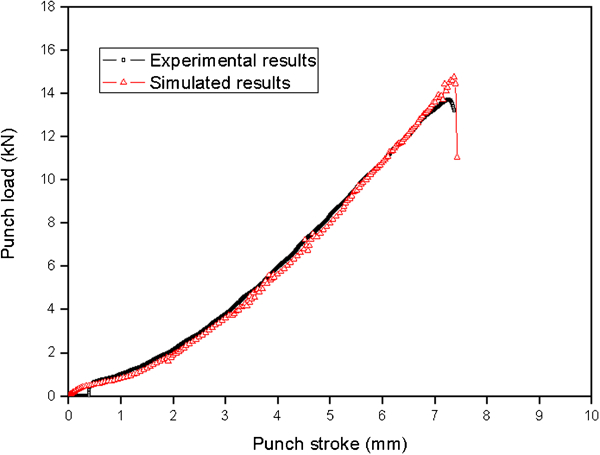
Comparison of punch load versus stroke profiles of Erichsen cupping tests for experimental and simulated results
Conclusions
In the present paper, the mechanical performances of a laser welded bead, which was made of dissimilar base sheets of different gauges, were measured by using the nanoindentation test. It was found that in the cross-section of the weld, the Young’s modulus, hardness and strain hardening exponent generally decrease with increasing distance from the weld centreline, whereas the initial yield stress and strength coefficient show the opposite tendency.
The elastoplastic constructive model, which has taken into account the performance inhomogeneity traversing the weld line, was built based on the above measured data of the weld bead. The well correlation between the experimental and numerical results of the Erichsen cupping tests performed for the TWB specimens validated this new constructive model.
Footnotes
Acknowledgements
This work was performed under the project of ‘Development of Key Lightweight Technologies and Its Integrated Applications to Full-vehicles’ (NO. 2011BAG03B05). The authors would also like to thank the Natural Science Foundation of China for Distinguished Young Scholars (grant no. 50725517).