
Abstract
During its converter extraction process, vanadium is oxidised into vanadium slag and forms spinel crystals. The spinel crystallisation process is one of the most decisive factors in the subsequent extraction and hence is worth exploration and discussion. The classical crystallisation kinetic model presented by Turnbull and Uhlmann was employed to analyse the crystallisation processes of vanadium, chromium and titanium spinel crystals in the vanadium slag. The crystallisation abilities of the three kinds of spinels were quantified and found to follow the order FeCr2O4>FeV2O4>Fe2TiO4. Furthermore, the precipitation sequence of spinels in the vanadium slag during cooling was achieved as FeCr2O4→FeV2O4→Fe2TiO4, and a suitable heat treatment condition on the vanadium slag was proposed. Finally, the optimum temperature range that benefits the precipitation of spinels was obtained as 1507–1557 K by both theoretical calculation and experiment.
Introduction
Vanadium is an important element that is used almost exclusively in ferrous and non-ferrous alloys due to its excellent physical properties, such as high tensile strength, hardness and fatigue resistance.1 The major vanadium products include FeV, V2O5, V2O3, VN and Al–V–Ti alloy.
Various processes of vanadium extraction from vanadium containing hot metal are available; however, four processes, such as the Highveld process (South Africa), the Pan-steel process (China), the NTMK duplex process (Russia) and the New Zealand steel process (New Zealand), are dominant. 2 2,3 Although the type of reactor and the initial vanadium content in the hot metal are different in each technique, they share the same principle that vanadium is oxidised by oxygen into vanadium slag.
The vanadium extraction process of Pan-steel in China is schematically illustrated in Fig. 1. It is characterised by concentrating vanadium to spinel phases in the vanadium slag and then extracting vanadium oxide via salt roasting and leaching of the slag. As an intermediate product, the quality of the vanadium slag has a significant effect on the subsequent vanadium extraction process. Furthermore, the quality of the vanadium slag is determined to a large extent by the proportion and grain size of vanadium containing spinels. To be specific, Chen and Yang4 found that a large spinel crystal size could promote vanadium oxidation rate as silicate phases would impede the oxidation of vanadium containing spinels by decreasing the probability of exposing to react with roasting reagents. Therefore, research on the nucleation and growth kinetics of spinel crystals will provide reference and guidance for improving the quality of the vanadium slag. Diao et al. 5 5,6 reported the mineralogical characterisation and growth of spinel crystals under different experimental conditions. However, systematic and theoretical analyses on the nucleation and growth kinetics of spinel crystals in vanadium slag are seldom reported. Thus, this work attempts to carry out a comprehensive exploration and discussion on the crystallisation ability, precipitation sequence and optimum temperature range for crystallisation of spinels in vanadium slag from the viewpoint of kinetics and give experimental verification to the calculated results.
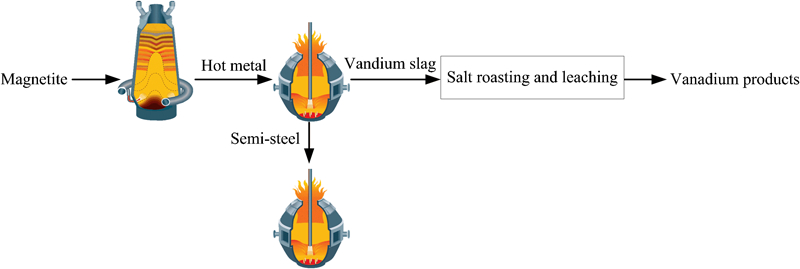
Vanadium extraction process of Pan-steel in China
Mathematical model
It is widely accepted that the crystallisation of spinels in vanadium slag can be divided into two stages: nucleation and growth. According to the classic crystallisation kinetic model reported by Turnbull
7
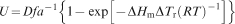
7,8 and Fisher et al.,9 the nucleation rate can be expressed as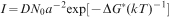


The nucleation rate I can be expressed by equation (3) when combining equations (1) and (2), i.e.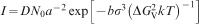


Suppose T
r is the reduced temperature defined by


β is the reduced molar heat of fusion defined by
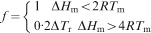
Thus, a new expression form of I is obtained as equation (12) shows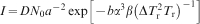


Determination of parameters
A typical industrial vanadium slag sample was obtained from Pan-steel. X-ray fluorescence spectroscopy analysis of the chemical composition of the experimental slag is as follows: 34·7FeO–12·3V2O3–18·4SiO2–12·5TiO2–8·2MnO–4·1MgO–2·8CaO–3·4Cr2O3–2·6Al2O3 (wt-%).
The main phases of vanadium slag in Pan-steel that have been reported11 are spinels and silicates. Diao et al. 5 confirmed this by X-ray diffraction and energy dispersive X-ray spectroscopy (EDS or EDX) analyses. The results showed that V, Ti and Cr are concentrated in the spinel phases, and Ca and Si are concentrated in the silicate phases. Fe, Mn, Mg, Al and O co-exist in both phases, that is to say, the spinel phases in V slag include FexV3−xO4, Fe2TiO4, FeCr2O4 and (Mg, Mn)x(V,Cr,Ti,Al)3−xO4. Nevertheless, since the concentrations of Mg and Mn are fairly low to be compared with Fe, and the similarity of Fe spinels and (Mg, Mn) spinels is relatively high, only the Fe spinels are taken into consideration in the present study, namely FeV2O4, FeCr2O4 and Fe2TiO4. It is worth noting that FeCr2O4 should not be neglected as it has significance in chromium extraction and high melting point, which would have a negative effect on the roasting process of vanadium extraction.12 The parameters of structure and melting point of these spinel crystals are given in Table 1.
Parameters of structure and melting point of three kinds of spinel crystals
In the preceding model, a key parameter is the viscosity of the vanadium slag that was studied. However, due to the high oxidability and high melting point, the viscosity of vanadium slag is difficult to measure, and in the report of Turnbull,8 the viscosity is regarded as constant or illustrated by an empirical equation for a specific system. Recently, more empirical equations of slag viscosity were applied to model computation, yet the accuracy of viscosity value is still limited, and some components of the slag are neglected. In the present study, the viscosity of vanadium slag was calculated by the National Physical Laboratory model19 in order to get a relatively precise result. The optical basicities of the slag components that are used for calculation in this work are from the literature 19 19,20 and given in Table 2.
Values of optical basicities of components of vanadium slag
Experience indicates that the reduced molar heat of fusion β lies between 1 and 10 for most substances.8 The reduced crystal/liquid interfacial tension α has been measured directly only in a few instances, and there is no rigorous theory for predicting it. Furthermore, fundamental thermodynamic data of vanadium are so deficient and hard to calculate or measure. Therefore, values of α and β are referenced from other reports, 21 21,22 which are already in accordance with the experimental one, i.e. α = 1/3 and β = 1. It is worth noting that although the three kinds of spinels that are taken into consideration are different materials and their properties related to the values of α and β are different, yet wide applications of the abovementioned kinetic model have shown that for the crystallisation phases of similar type from metallurgical melts or slags, the values of α and β are nearly the same. Thus, it is reasonable to regard the values of α and β of the three kinds of spinels as the same when we have no rigorous theory for predicting them or effective method to measure them.
Experimental
Slag sample preparation
The sample from Pan-steel in China was applied to an experiment that was designed to give verification to the calculated results.
A 12 kW box type electric resistance furnace was employed as the experimental apparatus with a proportional integral differential controller. The industrial vanadium slag samples were milled to particles of <0·1 mm. A slag mixture of 50 g, which was charged into an MgO crucible (inner diameter, 50 mm; height, 75 mm) was heated and melted in a furnace at 1673 K. After 30 min, the MgO crucible was quickly taken out and cooled naturally in the air or cooled to a predetermined temperature (1273, 1373, 1473, 1523, 1573 and 1623 K) at a rate of 5 K min−1 and held for 30 min before being taken out from the furnace. After being cooled to room temperature, the slag samples were polished with silicon carbide.
Scanning electron microscopy (SEM) and EDS analyses
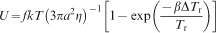
The morphology of the slag was studied by SEM and EDS or EDX. In order to understand the distribution of vanadium, chromium and titanium in the spinel crystals, as well as give verification to the calculated precipitation sequence and crystallisation abilities of three kinds of spinel crystals, map and linescanning were carried out during the SEM and EDS analyses. Moreover, the mean diameter of spinel crystals was measured in 10 different fields of view by image analysis software to validate the theoretical optimum temperature range, which is beneficial for the crystallisation of spinels in vanadium slag. The mean diameter is the average length of diameters measured at 2° intervals and passing through the object’s centroid, and Fig. 2 shows the determination method of mean diameter d. Figure 2a is an original SEM image of vanadium slag, while Fig. 2b illustrates the identification of spinel crystals in Fig. 2a . It is noteworthy that the spinel crystals, which are not complete as they are located at the edge of the photograph, were not taken into the calculation of the mean diameter d.
Schematic of determination method of mean diameter d
Results and discussion
V containing spinel phases are wrapped by silicate phases2 just as Fig. 3 shows, and a relatively thicker silicate phase shell would slow down the oxidation reaction rate during the roasting process remarkably. In other words, the large grain size of spinels could increase the exposure probability of spinels from being wrapped by silicate phases under the same level of grinding. Meanwhile, the mean diffusion path from O2 and sodium salt to spinel crystals will be shorter. Therefore, it is worthwhile to determine the crystallisation ability, the precipitation order and the optimum temperature range that benefits the nucleation and growth of spinels in order to get a fairly larger size of spinel crystals.
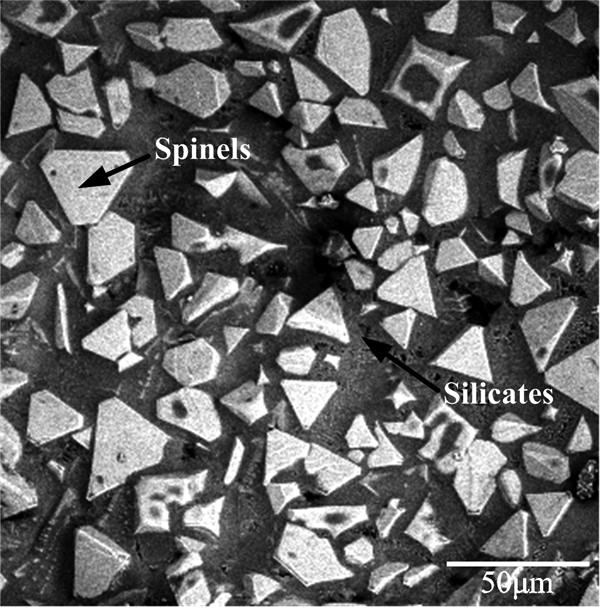
Image (SEM) of spinel and silicate phases in vanadium slag
Based on the kinetic model above, the nucleation and growth rates of these three kinds of spinels were calculated and are shown in Figure 4 Figure 5 Figs. 4–6. It can be seen that there is a peak in both nucleation and growth rates. This is reasonable because they are both greatly influenced by two contradictory factors, i.e. the degree of supercooling and the diffusive mass transfer in vanadium slag. Moreover, the three kinds of spinel crystals show differences in both values of nucleation and growth rates and suitable temperature range. Particularly, both the nucleation and growth rates of FeCr2O4 spinels peak at a larger value and a higher temperature. FeV2O4 spinels take the intermediate place, and Fe2TiO4 spinels show the least in values of nucleation and growth rates and the lowest in peak temperature.
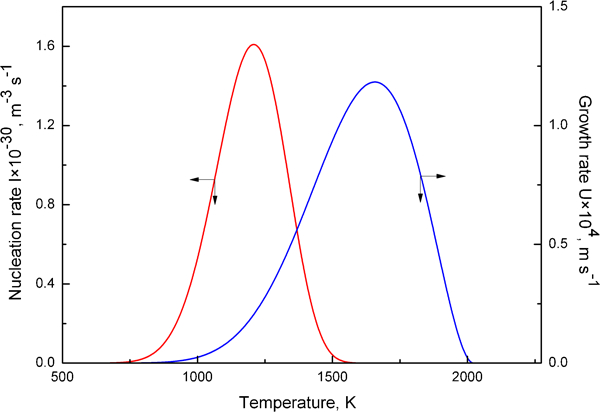
Nucleation and growth rates of FeV2O4 spinel crystals
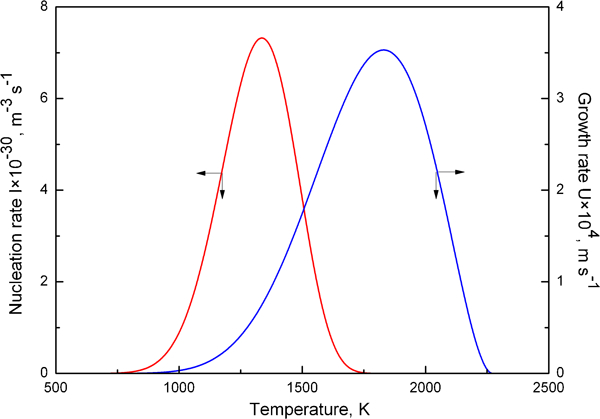
Nucleation and growth rates of FeCr2O4 spinel crystals
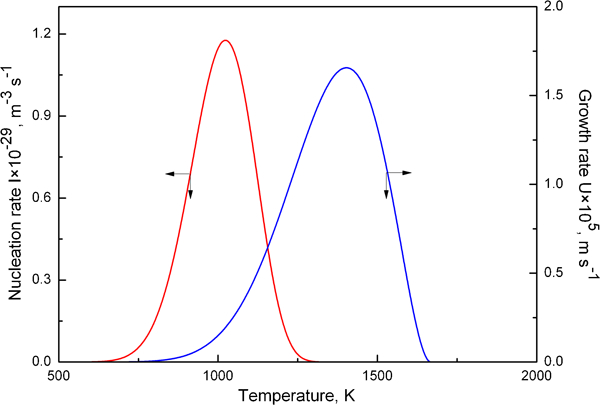
Nucleation and growth rates of Fe2TiO4 spinel crystals
Furthermore, the crystallisation ability of the three kinds of spinels can also be deduced from Figure 4 Figure 5 Figs. 4–6. Wu et al. 23 believed that the ability of forming an amorphous solid of a substance can be expressed by (T U−T I)/T I on the basis of the nucleation and growth theory reported by Turnbull8 and Uhlmann,10 where T I and T U are the peak temperatures of nucleation rate I and growth rate U respectively. In the work of Wu et al.,23 a larger value of (T U−T I)/T I of a substance would indicate its better ability of forming amorphous solid. In other words, the spinel in vanadium slag with a smaller value of (T U−T I)/T I would precipitate more easily. Therefore, based on the calculated results that are shown in Figure 4 Figure 5 Figs. 4–6, the crystallisation abilities of the three kinds of spinels in vanadium slag were achieved and are given in Table 3.
Crystallisation abilities of three kinds of spinels in vanadium slag
It can be clearly seen that the values of (T U−T I)/T I of the three kinds of spinels are similar, which demonstrates that the crystallisation abilities of the three kinds of spinels are also similar. However, differences still exist, and the crystallisation abilities of spinels in vanadium slag keep to the following order: FeCr2O4>FeV2O4>Fe2TiO4. Moreover, to be compared with the calculated results of Wu et al.,23 the values of (T U−T I)/T I of the three kinds of spinels are at a low level. That is to say, the crystallisation abilities of the spinel phases are all relatively good, and the spinel phases are easy to precipitate.
However, it is still difficult to give an accurate optimum temperature range for the spinel crystals. Therefore, it is necessary to combine the nucleation and growth rates. Johnson and Mehl24 derived the volume fraction φ of the new phase as a function of nucleation rate I, growth rate U and time t. Specifically, φ is given by


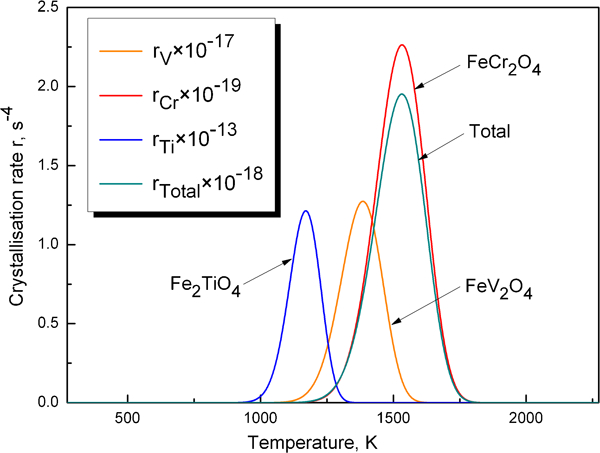
Crystallisation rates of three kinds of spinel crystals and total
It can be seen from Fig. 7 that the total crystallisation rate is dominated by FeCr2O4 spinel crystals. In other words, the suitable temperature range for the crystallisation of spinel crystals in vanadium slag is enhanced by the chromium spinels, and thus, a lower content of chromium is preferred in order to contribute to vanadium extraction.
More importantly, the precipitation sequence of the three kinds of spinels can be deduced from Fig. 7. Specifically, precipitation cooling produces the sequence of FeCr2O4→FeV2O4→Fe2TiO4. It is worth noting that although the values of calculated nucleation and growth rate depend on the values of the model parameters, the calculated crystallisation abilities of spinels in vanadium slag keep to the same order, and the precipitation sequence is the same regardless of the actual values of properties like viscosity, interfacial tension and heat of fusion.
Additionally, in order to validate this calculated precipitation sequence of the spinels, map and linescanning were carried out during the SEM and EDS analyses, and the results are shown in Fig. 8. Figure 8a illustrates the spinel crystal chosen to be analysed and the scanning lines, and Fig. 8b–e shows the results of map scanning. It can be clearly seen that the bright grain in Fig. 8a is a spinel crystal since V, Cr and Ti are concentrated in the area of this crystal, while Si is concentrated around this crystal. The results of scanning line 1 are given in Fig. 8f–h . It is apparent that chromium is concentrated in the central part of the spinel crystal, while titanium is concentrated in the outer part. Vanadium is distributed more uniformly, yet a trend to be concentrated towards the central part of the spinel crystal can still be seen. In summary, the linescanning results indicate that the precipitation order is chromium, vanadium and then titanium, which is in good accordance with the calculations. Another linescanning was conducted in order to avoid the coincidence caused by scanning direction, and the results are given in Fig. 8i–k . Apparently, the tendency of scanning line 2 is nearly the same with that of scanning line 1. Therefore, the experimental results related to the precipitation sequence of spinels are independent of direction. However, it is still necessary to demonstrate that the experimental results are independent of the spinel crystal, which has been chosen to be analysed. Finally, Fig. 9 shows a scan for a third spinel crystal, indicating the same tendency as that of the first spinel crystal. It can thus be concluded that the precipitation sequence of spinels in vanadium slag is FeCr2O4→FeV2O4→Fe2TiO4 regardless of the direction or the spinel crystal chosen. Furthermore, the experimental results are in accordance with the calculated order of crystallisation abilities of the spinels. Specifically, chromium spinel is the easiest one to form crystal from the calculated results and which would result in that chromium concentrates in the central part of spinels. The distributions of vanadium and titanium can be deduced similarly. This conclusion is in good agreement with the results reported by Vatolin et al.25
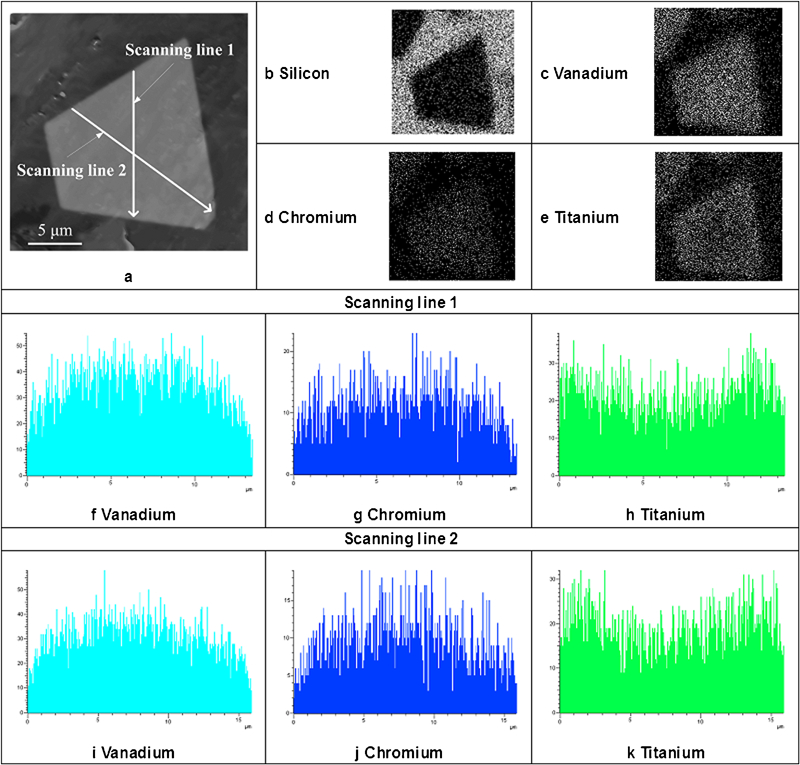
Map and linescanning results of spinel crystal in vanadium slag sample
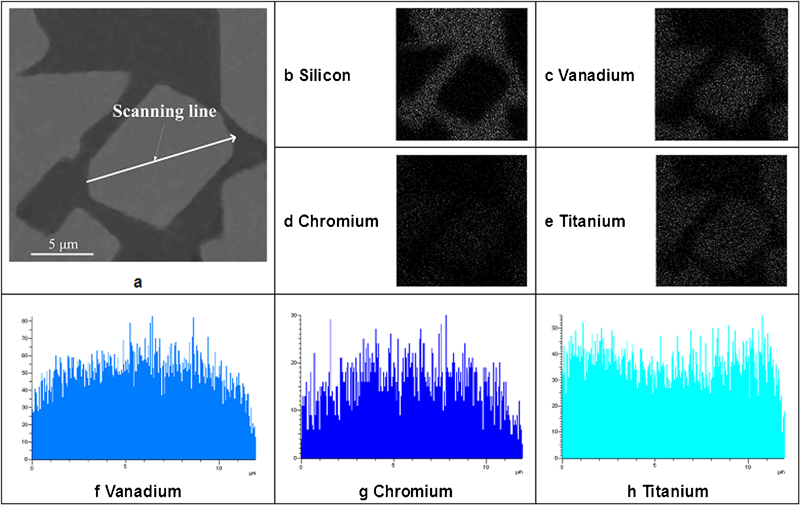
Map and linescanning results of another spinel crystal in vanadium slag sample
A suitable heat treatment condition for vanadium slag can be proposed in order to obtain better phase formation and a larger size of V containing spinels since the precipitation order of spinels has been obtained. Figure 10 shows the suitable heat treatment conditions. θ represents the cooling rate, and 1533, 1385 and 1171 K are the temperatures where the crystallisation rates of the three kinds of spinels peak. In this figure, θ1–θ6 are the controlling parameters of a cooling process. As a larger size of V containing spinels is preferred, θ3 should be set at a relatively small value in order to provide the V containing spinels with enough time of nucleation and growth. In contrast, the precipitation of the other phases is in favour of being restricted, i.e. θ1–θ6 except θ3 should be set at a large value, especially for θ5 and θ6. To be applied more simply in the vanadium extraction industry, vanadium slag should be tapped from converter for several heats to give the spinels enough time to precipitate and grow. Furthermore, the vanadium slag can be water quenched at a temperature of ∼1100°C (<1385 K appropriately) in order to restrict the growth of silicate phases after being tapped from the converter.
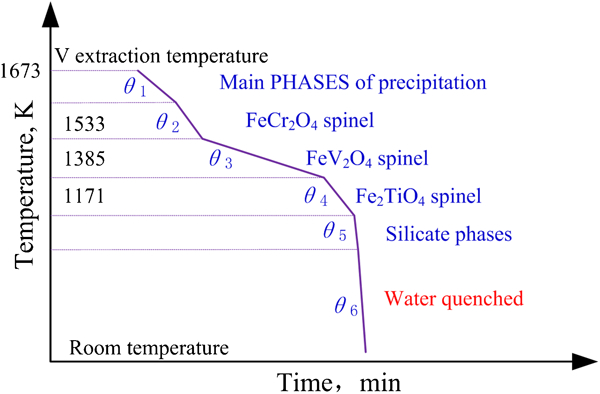
Suitable heat treatment condition on vanadium slag
Representative SEM images of vanadium slag, which are used for the measurement of the mean diameter of spinel crystals, are shown in Fig. 11. Furthermore, a comparison between the calculated results and the experimental one is given in Fig. 12. The optimum temperature range for a larger mean diameter of spinel crystals shows a good agreement with the model calculation results. This also indicates that the kinetic model that has been established is suitable for analysing the nucleation and growth process of spinel crystals in vanadium slag.
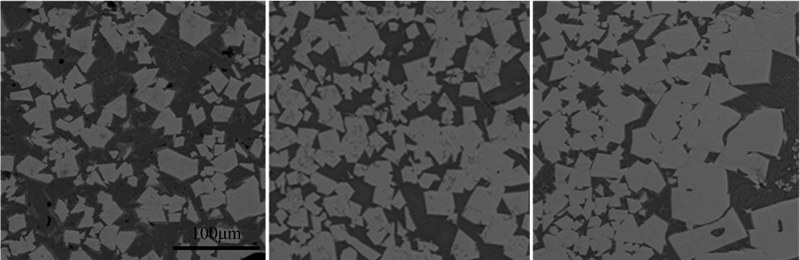
Representative SEM images of vanadium slag samples
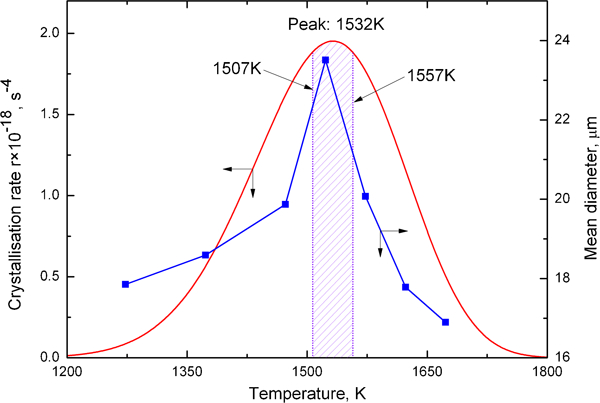
Crystallisation rate and mean diameter of spinel crystals
The peak temperature T peak of the total crystallisation rate r Total is shown in Fig. 12 as 1532 K, and the optimum temperature range for the crystallisation of spinels is defined as T peak±25 K, i.e. 1507–1557 K. It is notable that this temperature range is beneficial for the crystallisation of the total spinels instead of V containing spinels only. Actually, the optimum temperature for the V containing spinels is slightly lower from the view of the calculated results.
Conclusions
The following conclusions can be drawn from the present work.
Although the concentration of chromium in vanadium slag is relatively low, the crystallisation rate of the total spinels is greatly affected by the chromium spinels present.
The crystallisation abilities of spinels in vanadium slag are quantified with the index of (T U−T I)/T I and keep to the following order: FeCr2O4>FeV2O4>Fe2TiO4.
The precipitation of spinels in vanadium slag during cooling follows the sequence of FeCr2O4→FeV2O4→Fe2TiO4.
For vanadium extraction plant, vanadium slag should be tapped from converter for several heats to give the spinels enough time to precipitate and grow, and then it can be water quenched at a temperature of ∼1100°C in order to restrict the growth of silicate phases.
The optimum temperature range that benefits the nucleation and growth of spinel crystals is obtained as 1507–1557 K by both theoretical calculation and experiment.
Footnotes
Acknowledgements
The authors would like to express their thanks to the financial supports from the National Basic Research Program of China (973 Program, grant no.2007CB613503), the National High-Tech R&D Program of China (863 Program, grant no. 2008AA031104), the National Natural Science Foundation of China (grant no. 51090382) and the Postgraduate Innovation Program of Chongqing University (grant no. CDJZR1130020).