
Abstract
During the current research and development activities at Tata Steel Teesside Technology Centre, UK, the inclined plane test (IPT) is adopted as a quick method to measure the viscosity/fluidity of mould powders being used currently for continuous casting of different steel qualities and section sizes. The usefulness of the IPT method was also validated by comparing the viscosities that were measured by a high temperature viscometer. It has been established that the IPT measured viscosity values are comparable with the mould powder supplier’s data. The IPT ribbon lengths of different powders have been correlated with the viscosities using an Arrhenius type relationship. The ribbon lengths of the solidified fluxes were found to have a good correlation with the molar ratios of the corresponding powders. Hence, the relationship was further tuned to develop a viscosity prediction model using the chemical compositions of the mould fluxes (i.e. the model can be used for a quick assessment of mould flux viscosity based on its chemical composition).
Introduction
Mould fluxes, a mixture of different oxides (such as calcia, silica and various alkali oxides) and calcium fluoride, contribute as a lubricant by forming a thin liquid film between the copper mould and the initial solidified steel shell during continuous casting. The slag film solidifies as it goes down below the meniscus and plays a significant role in transferring the heat from the steel strand to the copper mould.1, 2 It has been found that the performance of the molten flux and the as cast surface quality of the semis are dependent on the sufficient and consistent infiltration of liquid slag and the uniform formation of the solid slag film into the gap between the mould and the strand. The infiltration of the slag is primarily dependent on its viscosity, and therefore viscosity is considered as one of the major thermophysical properties of a mould flux.
The casters at Tata Steel Europe use a wide variety of mould fluxes for continuous casting of different steel grades with different casting formats. The steel grades and section sizes influence the choice of the mould fluxes. For example, mould flux for a billet/bloom casting usually possesses higher viscosity as compared with the powders for slab casting.
It has been found that a deviation from the required mould flux properties can lead to incorrect casting conditions and this can finally cause a range of casting problems,3 starting from minor surface defects to a major breakout. The operators often experience that the online performance varies significantly for different batches of the same powder (from the same supplier) as well as alternative powders from different suppliers for the same steel grade. Thus, the powder melting, lubrication, steel meniscus damping, etc. characteristics are different, which sometimes cause major as cast surface quality issues.
The primary aim of the current research is to characterise the properties of different batches of similar mould powders and also different powders for different steel grades before their use on different Tata Steel Europe casters. In addition to other thermophysical properties measurements, extensive measurements for viscosities of different powders were carried out. A high temperature viscometer is used regularly for the measurements. Since a typical viscometer experiment is not only expensive but also time consuming, a quick and reliable technique ‘inclined plane test (IPT)’, previously proposed by Mills et al.,4 is progressed and adopted. Some of the results are shared in this report.
Experimental set-up
Inclined plane tests are carried out using a ‘V’ shaped stainless steel plate and a resistance heating furnace. The mould powders are decarburised at 750°C on a refractory bed for 8 h. Decarburised powder (∼15 g in weight) is transferred to a platinum crucible and kept in a furnace at 1300°C for 10 min. Sometimes, graphite crucibles are also used as an alternative to platinum crucibles. After being taken out from the furnace, the molten flux is poured immediately over the top of the ‘V’ shaped stainless steel plate, which is arranged to be inclined at ∼14°. Figure 1 shows the experimental set-up of the IPT. The molten flux flows down the plate until loses its fluidity and forms a slag ribbon. The lengths of the slag ribbons are dependent on viscosity at 1300°C.4 The typical slag ribbons for some of the powders tested are shown in Fig. 2. A flow chart illustrating the IPT methodology is shown (Fig. 3).
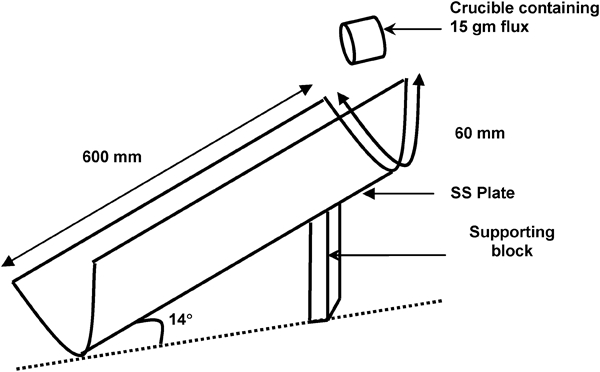
Experimental set-up of IPT
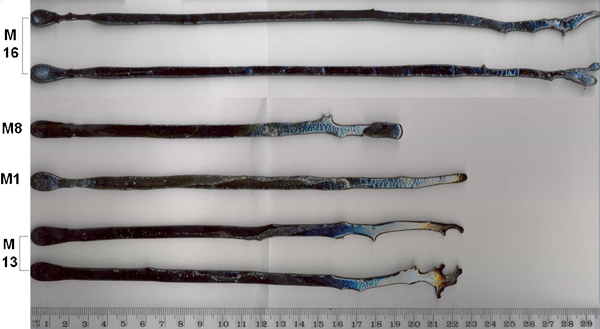
Typical examples of slag ribbons from IPT of different powders
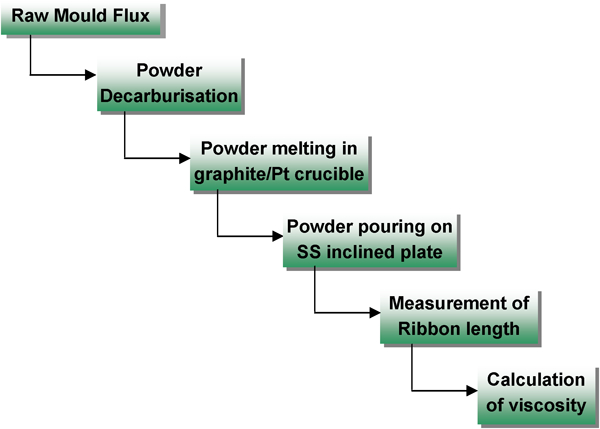
Flow chart to illustrate IPT methodology
Use of the decarburised powders was necessary for viscosity testing due to the following issues with the raw mould powders:
raw mould fluxes contain variable amount of carbon which can cause longer melting time
significant and uncontrolled weight changes take place during heating and melting of raw mould powder due to escape of volatiles, moisture and carbon. Online change of such weight is difficult to determine while the mould flux is molten, and thus difficult to use as a record
it has been experienced that the presence of carbon accelerates the formation of microcracks in the platinum crucible.
Results and discussion
Different mould powders, currently being used at various Tata Steel Europe plants, were tested for viscosity measurements by the IPT method. The compositions and viscosity values of the raw mould powders obtained from the product definition sheet (PDS) are reported in Table 1. The PDS values for powder composition were cross-checked by performing in-house chemical analysis of some of the selected mould powders designated M1, M2, M3, M8, M12, M13, M17 and M18 in Table 1. The raw mould powder analyses show a good agreement with the manufacturer’s specification (Table 2). In order to confirm the loss of volatile components and any possible change in the composition of the major constituents, two of the mould powders with significant variation in carbon concentration and almost similar level of fluorine (designated Q and R) were melted at 1300°C, cooled in air and analysed chemically after solidification. It is noted that the melting of these powders did not alter the contents of the primary constituents of the mould powders except a significant loss in carbon and a small loss in fluorine as compared with a normalised raw mould powder (Table 3). The normalised composition refers to recalculated composition considering 100% carbon loss from the raw powder.
Manufacturer’s specification (PDS)* of different mould powders
*According to the PDS, the compositions may deviate up to ±1% from the specified values.
In-house composition analysis results of some raw mould powders
Comparison between chemical composition of premelted flux and normalised raw powder composition
*Considering 100% carbon loss from raw powder and recalculated the % composition.
In order to determine a relationship between the ribbon length and the viscosity at 1300°C, seven mould powders (M2, M3, M4, M6, M12, M16 and M18) with a wide range of viscosities (reported in the PDS) were selected. As seen in Fig. 4, the results of IPTs of these mould fluxes show an interesting trend. The relationship between the ribbon lengths and the manufacturer’s data for viscosity values was found to follow an exponential type of relationship (equation (1)) for this experimental set-up
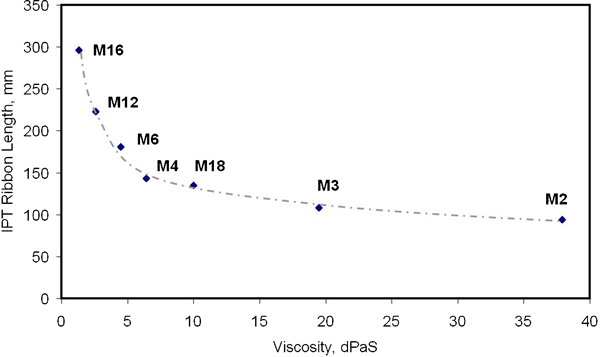
Inclined plane test viscosity trend observed for mould fluxes with wide viscosity range
Equation (1) is validated by using the results (reported in Table 4) and the corresponding PDS viscosity values. A good agreement was observed between the actual and the IPT measured (equation (1)) viscosity values, and this can be seen in Fig. 5.
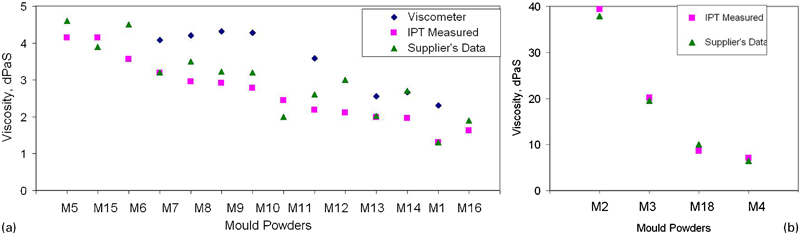
a, b validation of IPT results with manufacturer’s data and high temperature viscosity measurements
Inclined plane test results at 1300°C for Tata Steel mould powders
*Weight of the IPT ribbon after melting of 15 g decarburised mould flux.
Equation (1) is an Arrhenius type of equation and is very similar to the equation for the viscous flow in the amorphous materials (equation (2))5
–
7

By comparing equations (1) and (2), the followings can be noted

An attempt was also made to correlate the viscosities of the mould fluxes studied in this research with the structural parameters of the fluxes. Previous researchers have reported that formation of amorphous and the crystalline phases in a solidifying flux can be related to molar ratios of different elements such as oxygen to silicon (O/Si) molar ratio,2,
8,
9 basic/acidic oxide molar (B/A) ratio2,
10 and the ratio that considers the number of non-bridging oxygen per tetrahedrally coordinated atom (NBO/T).2,
11 The mathematical expressions for these ratios are presented in equations (5)–(7) respectively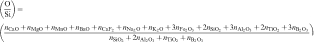


It is noted that the modifications of these molar ratios by considering the MgO and MnO contents, as suggested by Li et al.,2 did not show any noticeable influence on the viscosity values of fluxes studied in this research. Therefore, such a modification is not considered to calculate the molar ratios using equations (5)–(7).
Li et al. 2 also suggested that depending on the composition of the mould fluxes, the fluxes can be classified into either CaO excess or CaF2 excess groups. It is known that during mould flux solidification, CaO, SiO2 and CaF2 are being consumed to form a crystalline phase of cuspidine. The theoretical maximum amount of cuspidine that can be formed during solidification of each mould flux under study and the corresponding amounts of excess SiO2 and CaO or CaF2 are calculated and presented in Fig. 6 (CaO excess) and Fig. 7 (CaF2 excess). The calculation method along with two example calculations (excess group determination, theoretical maximum amount of cuspidine, etc.) is given in Appendix. Based on these calculations, mould fluxes M1, M2, M3, M4, M6, M7, M8, M12 and M17 are classified as CaO excess group, while fluxes M5, M9, M10, M11, M13, M14, M15, M16 and M18 belong to CaF2 excess group.
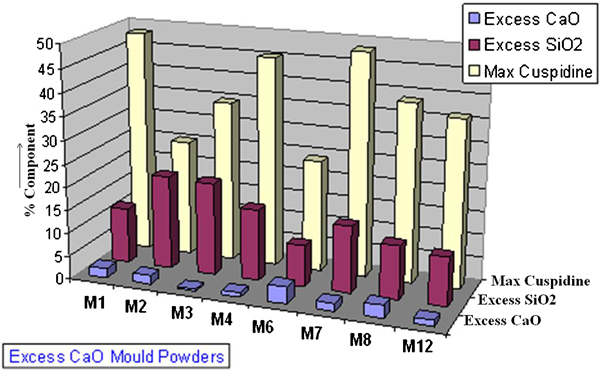
Calculations of amount of cuspidine for CaO excess group
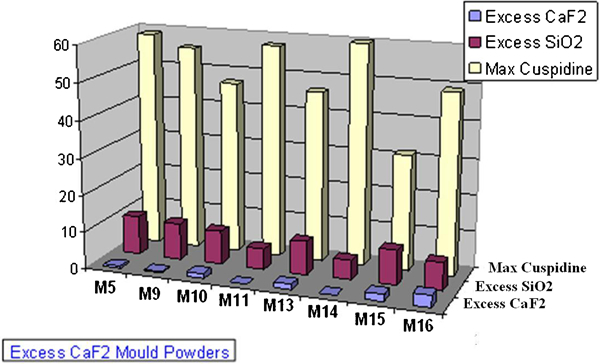
Calculations of amount of cuspidine for CaF2 excess group
Figure 8 Figures 8 and 9 show the effect of molar ratios on the ribbon length. A good correlation between the IPT ribbon lengths and the molar ratios (irrespective of using different equations) is observed. In addition, this relationship is seen to be influenced greatly by the mould flux’s excess group. For example, a good correlation (R 2 = 0·995) between the ribbon lengths of CaO excess mould fluxes was observed (Fig. 8). However, a slightly weaker correlation (R 2 = 0·7) between the molar ratios and ribbon lengths for fluxes of CaF2 excess group is seen (Fig. 9). If IPT is taken as a measure of viscosity, O/Si ratio generally shows a slightly better correlation with the mould powder viscosities than the other two ratios. This agrees with the investigation by Santhy et al.,9 who observed a steady correlation between O/Si ratio and viscosities for simple slag chemistries.
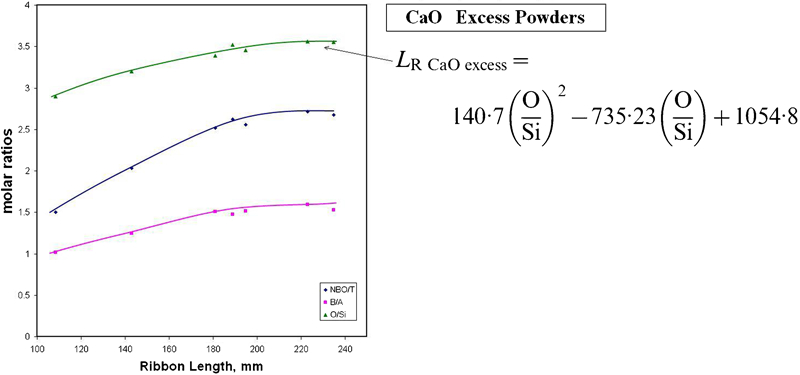
Correlation between ribbon length and different molar ratios for CaO excess group
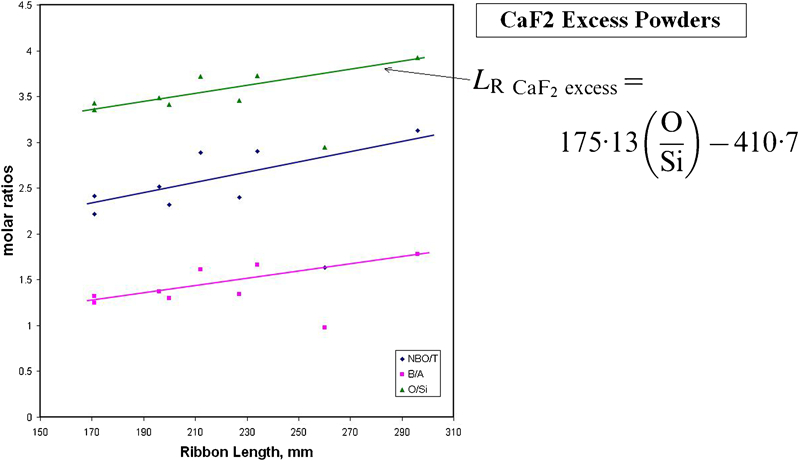
Correlation between ribbon length and different molar ratios for CaF2 excess group
In the work of Santhy et al.,9 a growing need of a viscosity characterisation model for the iron- and steelmaking fluxes and slags was identified. In order to further understand the gap in mould flux characterisation, the authors progress one step further by developing the following relationships which can predict the IPT ribbon lengths from the mould flux chemistry based on O/Si ratio for both CaO and CaF2 classes of mould fluxes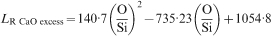
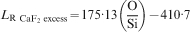
Now, if equations (8) and (9) are used as an input (for ribbon length) to equation (1), viscosity at 1300°C of the mould flux can directly be predicted by using the chemical analysis of the flux. Equation (1), therefore, can be rewritten separately for CaO excess and CaF2 excess powders and the equations are given below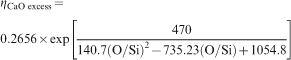
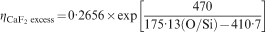

The raw compositions from Table 1 were used for predicting the viscosities of the mould fluxes by using the appropriate equation (equation (10) or (11)), and the predicted viscosity values were then compared with the supplier’s data (mentioned as reported) and the IPT measured viscosity values (Figs. 10 and 11). Good correlation between the actual and the predicted viscosities was observed; however, the CaO excess group mould fluxes show better level of prediction.
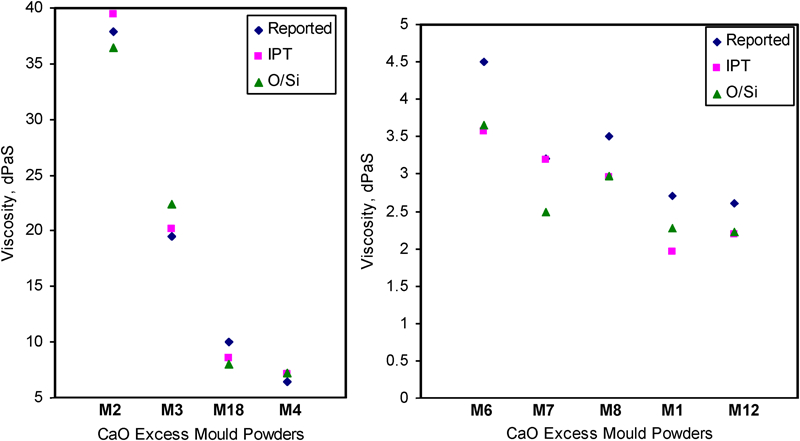
Comparison of predicted and measured viscosities for CaO excess mould fluxes
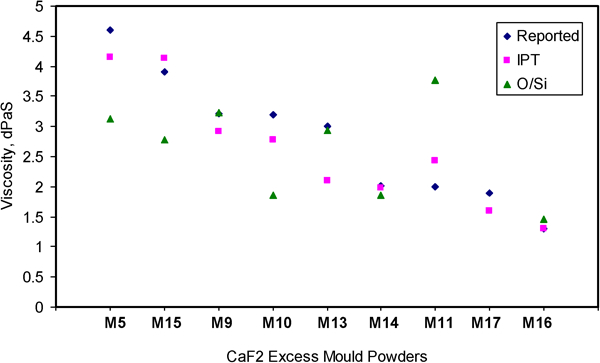
Comparison of predicted and measured viscosities for CaF2 excess mould fluxes
It can be noted that the model predicts viscosity on the basis of the composition of a mould powder. It can be seen that mould powder compositions supplied by the manufacturer have a standard deviation of 1. A slight deviation in the composition, especially for the primary compounds such as CaO, SiO2, Al2O3, CaF2 and Na2O, can cause a significant deviation in the predicted viscosity values. Table 5 is prepared to compare the model predicted viscosity values for Q and R powders using premelted (raw) and post-melted powder compositions. These values are also compared with the reported viscosities from the supplier. It can be noted that post-melted analysis gave slightly higher viscosities over premelted (raw) composition which possibly is due to expected endothermic (moisture escape, carbonate reduction, fluorine loss, etc.) and exothermic changes (phase transformation) during melting and solidification.
Variation in model results with change in composition
It is shown that this mathematical model can be used for a quick assessment of the viscosity (at 1300°C) of a mould powder, although further investigation and development is needed particularly for the CaF2 excess group mould fluxes.
Conclusions and further work
Viscosity measurements with the IPT method show that a relationship exists between the ribbon length (hence viscosity) and the chemical composition of different commercially available mould fluxes. Molar ratios such as O/Si, B/A and NBO/T were found to have a good correlation with the IPT ribbon length. This observation helped the authors extend further the Arrhenius type viscosity (equation (1)) to develop a mathematical relationship for the prediction of mould flux viscosity at 1300°C.
Further development of this model to predict the viscosities over a wide temperature range (say 1500°C to solidification point) is in progress. Further investigations are also progressing to upgrade the relationship for the CaF2 excess group mould fluxes.