
Abstract
The fluid transport characteristics and level fluctuations in the pool of twin roll strip casting were studied by physical simulation. The level profile depends on the transport characteristics of the flow in the pool. A 1∶1 water model of a twin roll strip caster was constructed based on the Froude number and Reynolds number similarity criteria to address the relationship between fluid flow and level fluctuations in the pool. The residence time of fluid in the pool and the nip points of the caster were measured to evaluate the uniformity in the caster in different operating conditions, and the level fluctuations and residence time were measured by wave gauge sensors and conductivity sensors respectively. The results show that free surface oscillations increase with the flowrate changing from 8·7 to 14·5 m3 h−1. Suitable outlet extension and outlet angle as well as holes in the bottom of the nozzle were beneficial to obtain a uniform distribution of the fluid along the direction of roll width at the pool zone.
List of symbols
Froude number of prototype
Froude number of model
acceleration of gravity/m2 s−1
characteristic length of prototype/m
characteristic length of model/m
volumetric flowrate/m3 s−1
Reynolds number of prototype
Reynolds number of model
cross-section area of nozzle/m2

theoretical residence time/s
mean residence times/s
minimum residence time/s
peak residence time/s)
characteristic velocity of prototype/m s−1
characteristic velocity of prototype/m s−1
Weber number of prototype
Weber number of model
minimum dimensionless time/s
peak dimensionless time/s
viscosity of metal liquid/Pa s
viscosity of water/Pa s
density of metal liquid/kg m−3
density of water/kg m−3
surface tension/N m−1
Introduction
Twin roll strip casting, which is one of the near net shape continuous casting technologies, was proposed by Bessemer more than a century ago.1 In this process, molten metal is fed through a delivery system into the cavity formed by walls of two side dams and two counter rotating rolls, which are water cooled from the inside. The melt solidifies and forms a thin shell on the roll surface, and the metal is rolled to strip with 1–10 mm thickness.2, 3 Thus, the equipment cost can be reduced significantly, and energy can be saved compared to traditional strip production methods.4 Furthermore, this technology is expected to eliminate difficulties in the production of materials with poor workability, such as cast iron and electric steel sheets, and develop new materials with new functions caused by rapid cooling.5 – 7
For economic application, it is crucial to optimise the flow profile of the fluid in the pool to maximise strip quality.1 A steady state is essential to provide a stable meniscus, uniform contact time of the melt on the rolls across their width, so as to produce homogeneous solidification. Uniform fluid distribution in the pool is also required to obtain an even temperature distribution, which is helpful for uniform solidification and elimination of defects.
To identify an optimised nozzle, level fluctuation at the pool surface and fluid distribution in the pool are two principal parameters which were evaluated by measuring level fluctuations with wave probes9, 10 and determined by residence time distribution (RTD) measurements respectively.11 – 14 In order to investigate the effect of nozzle variation on flow behaviour within the molten pool, a 1∶1 water model, which was based on the Froude (Fr) number and Reynolds (Re) number similarity criteria, was constructed. The RTD was used to study delivery uniformity in the pool to diagnose nozzles in the mould of a strip caster. The purpose of this work was to study the effect of nozzle layout on the fluid flow delivery and provide some useful parameters for the optimisation of the delivery system later. The performance of various nozzle geometries was evaluated with these two criteria, and the effect of flowrate was examined.
Theory: similarity aspects between model and prototype
In this experiment, the flow conditions including the turbulence, flow patterns and wave motion were investigated. Moreover, according to the similarity theory, the Fr and Re numbers are considered at first to ensure the similarity of fluid flow. The Fr and Re numbers are described as follows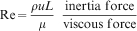


Set-up and procedure
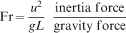
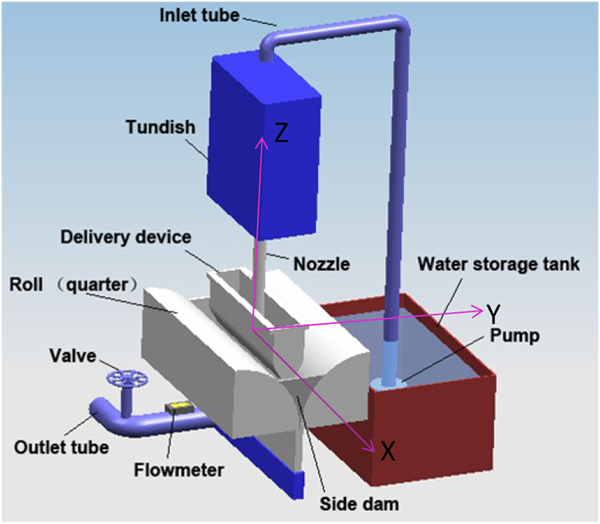
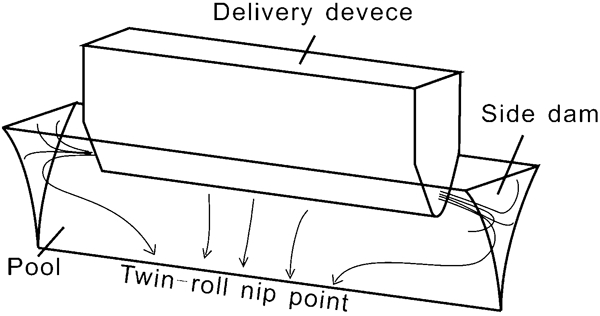
The equipment for the water model experiments is depicted in Fig. 1. The delivery system including the delivery device and nozzle and twin roll was made from 20 mm transparent acrylic plastic. The rolls were 1200 mm in width and 800 mm in diameter. The experiments in this paper ignored the rotation of rolls, so there were only two quarter rolls in the model. The gap between them was fixed at 2 mm. The inflow of water in the pool was controlled by the stopper rod, which was manipulated by an electric actuator located in the tundish. The pool height was the distance from the free surface to the gap between the rolls (twin roll nip point). A valve beneath the rolls controlled the outflow of water from the pool, and the flowrate was measured with a flow meter. Several probes (L1–L5, R1–R5 and S1–S2) were fixed on the pool surface to obtain quantitative data of level fluctuations about a period of 40 s. By injecting 100 mL saturated sodium chloride solution into the nozzle in pulse mode, the RTD curves were obtained by water conductivity measured by the probes (C1–C9 and N1–N4) for a period of 60 s. The location of the probes for wave height and conductivity is shown in Fig. 2a and b . The data acquisition system with probes was developed by the China Institute of Water Resources and Hydropower Research.
Schematic depiction of water model
Schematic depiction of probe arrangement
Three types of nozzle with two outlet ports directing fluid towards the side dams were tested, and several variations in the design of each type nozzle were built, having specific outlet and bottom holes. The main characteristics of all these nozzles are listed in Table 1.
Nozzle characteristics
Results and discussion
Effect of nozzle structure on fluid delivery
In Fig. 3, the pool level variations caused by three types of nozzle are shown as a function of time. It is seen that the nozzle with holes in the bottom and a downward outlet angle produced the smallest fluctuations. Holes increased the surface area and outlet angle decreased the impact force between delivery device and fluid from the nozzle. Thus, either holes or an outlet with a downward angle made a contribution to maintain the steady state of the pool. From equation (2·8), it can be seen that for a certain flowrate, the velocity of the fluid exiting the nozzle relates to the surface area of the port nozzle, which was also reported by Bouchard et al. 1 All of these measurements were obtained under steady state conditions, which were established ∼1 min after the pouring stage to stabilise the conditions and in accord with the experiments at the Industrial Materials Institute.1
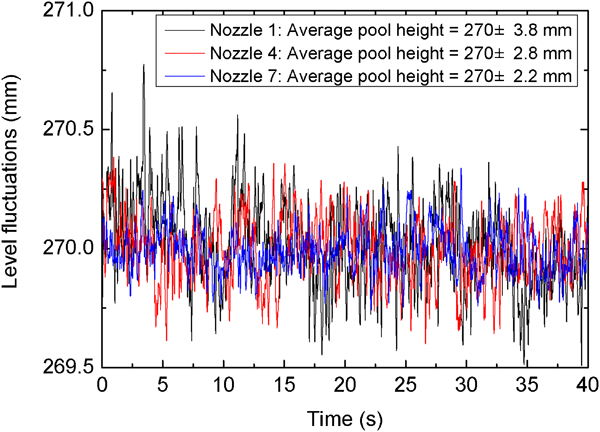
Pool level fluctuations for nozzle nos. 1, 4 and 7 obtained by probe L4 at flowrate of 11·6 m3 h−1 and pool level of 270 mm
The level fluctuations of the pool for the nozzles listed in Table 1 are shown in Fig. 4. These data represent the quarter pool behaviour. We can see that aside from nozzle nos. 1 and 2, the fluctuations are <4 mm, which means nozzles of types II and III have obtained a relatively quiet pool compared to nozzles of type I. A small port surface area of nozzles of type I, which has no benefit in decreasing the velocity of fluid flow from the nozzle, accounts for the greater agitation on the pool surface. It is noted in Fig. 4a that nozzle nos. 3–8 have a similar rising trend for level fluctuations. According to the results of nozzle nos. 6–8, it is not obvious that holes in the bottom can regulate level fluctuation in flowrate of 14·5 m3 h−1. However, as shown in Fig. 5, nozzles of type III with holes also obtain a relatively quiet pool surface on the condition of a smaller flowrate, which may because the area of holes is finite and limits the delivery effect at a large flowrate.
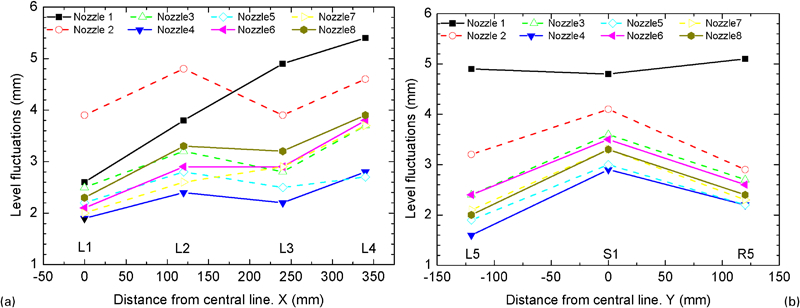
Pool level fluctuations in different locations for nozzles listed in Table 1: flowrate is 14·5 m3 h−1, and pool height is 270 mm
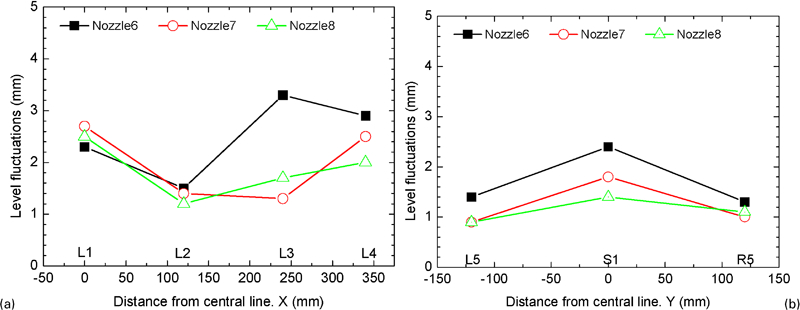
Effect of flowrate: pool level fluctuations in different locations for nozzle nos. 6, 7 and 8 (flowrate is 8·7 m3 h−1, and pool height is 270 mm)
Effect of outlet extension of nozzle on fluctuations
Figure 6 shows the effect of outlet extension of the nozzle on level fluctuations. For nozzle nos. 3–5, we can see that outlet extension is beneficial to reduce the level fluctuations, although it is not major. Especially, when the outlet extension changes from 0 to 50 mm, the improvement of the fluctuations is higher than that when the outlet extension change from 50 to 100 mm. Similar conditions can also be seen in Fig. 4, which shows the result of nozzle nos. 3–5 with flowrate of 14·5 m3 h−1. In fact, the fluctuations of nozzle no. 4 are a little smaller than nozzle no. 5. Relating to the length of the device delivery, this means that the better outlet extension is 50 mm with holes in the bottom.
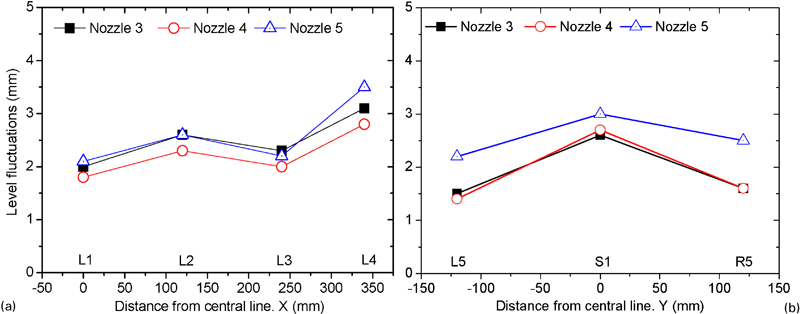
Pool level fluctuations in different locations for nozzle nos. 3, 4 and 5: flowrate is 11·6 m3 h−1, and pool height is 270 mm
Effect of outlet angle of nozzle on fluctuations
Figure 7 presents the effect of outlet angle of nozzle on the pool level fluctuation. The difference between nozzle nos. 3 and 8 is that nozzle no. 8 has a downward outlet angle of 15°and nozzle no. 3 has an angle of 0°. Comparing nozzle nos. 3 and 8, the level fluctuation along the direction of strip width for nozzle no. 8 seem more uniform in the pool and a little smaller, especially around the side dam. Compared to the data in Fig. 4, it is clear that there is an improvement on reducing the level fluctuations around the side dam for nozzle no. 8. This may be caused by the decrease in the impact force between the liquid flow from the outlet and the side dam of delivery device. Owing to the downward outlet angle, the liquid exiting the nozzle became more stable and impacts the side dam with a smaller downward angle that decreases the turbulent kinetic energy. Nozzle no. 8 also made a significant reduction in bubble formation.
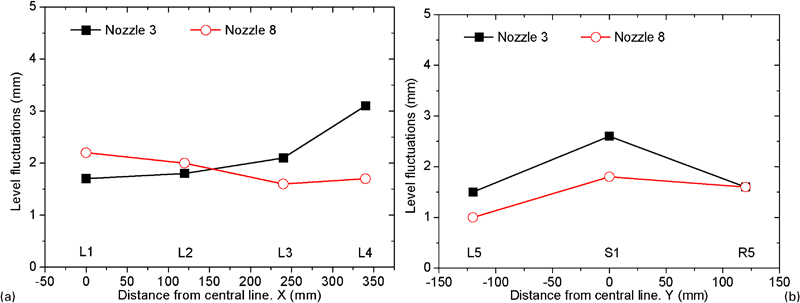
Variation of outlet angle: pool level fluctuations in different locations for nozzle nos. 3 and 8 (flowrate is 11·6 m3 h−1, and pool height is 270 mm)
Effect of bottom holes of nozzle on fluctuations
The level fluctuations at lower flowrate are shown in Figs. 5 and 8. Compared with Fig. 4, the level fluctuations of nozzle nos. 7 and 8 are relatively small and more uniform for all measuring points. This means that for nozzles of type III, in the conditions of large flowrate mentioned above, the holes in the bottom are helpful to obtain a relatively quiet pool surface at a smaller flowrate. Owing to the delivery effect of holes, the outflows of both side outlets greatly reduce relative to nozzles with no holes and with a low flowrate. With a low flow, the level fluctuations either in the middle or around side dam become smaller, which is beneficial to getting a relatively quiet pool. Changing the number of holes from 3 to 5 has not obtained an obvious improvement of fluctuations. In these cases, the strength of refractory should be considered to determine the number of holes in the bottom in actual production.
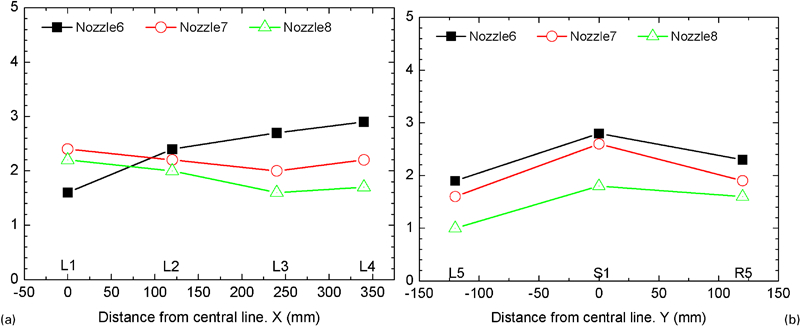
Effect of flowrate: pool level fluctuations in different locations for nozzle nos. 6, 7 and 8 (flowrate is 11·6 m3 h−1, and pool height is 270 mm)
Effect of nozzle structure on residence times
Experimentally measured RTD curves corresponding to nozzle nos. 1 and 7 are shown in Fig. 9. The dimensionless concentration is converted from the conductivity that divides the return to zero conductive by the peak value. Some probes were arranged in the pool and the others in the nip point, as shown in Fig. 2.

Experimentally measured RTD curves corresponding to nozzle nos. 1 and 7 by probes C1 and C5: flowrate is 11·6 m3 h−1, pool height is 270 mm and

It can be seen from Fig. 9 that the RTD curve of nozzle no. 1 is similar to nozzle no. 7. The tracer appears at the exit after a certain time, which is termed the minimum dimensionless time (Θ min). After that, it increases with time to a peak value and then decreases. The time to attain the peak value of concentration is termed as the peak dimensionless time (Θ peak). From the result of probe C1, we can see that Θ min of nozzle no. 1 is a little smaller than that of nozzle no. 7. The tracer concentration in both cases reaches the peak almost at the same time, but the tracer concentration of nozzle no. 1 decreases more quickly than nozzle no. 7, which means that the fluid flowing towards the side dam is a little slower than nozzle no. 1 due to the delivery effect of holes in nozzle no. 7. The peak values in both cases are almost equal, which means that the amount of fluid flowing to the side dam is the same for both nozzles. From the result of probe C5, we find that, contrary to probe C1, the Θ min of nozzle no. 1 is a little greater than that of nozzle no. 7, and the peak value of nozzle no. 1 is smaller than nozzle no. 7. This happens because nozzle no. 7 with holes delivers part of the fluid to the middle of the delivery device directly.
The mean residence times (t mean) in the pool and in the nip point for nozzle nos. 1, 6 and 7 are shown in Fig. 10. From these results, we can see the fluid delivery conditions along the roll width in each case. In the paper of Bouchard et al.,8 the renewal time in the pool was studied, and it was proved that it was intimately related to the rate constant. They thought a small renewal time is produced by a rapid decay in the RTD of the dye. Hence, a small renewal time means a short residence time was favourable to optimised nozzle in their paper. Here, we prefer to get a uniform mean RTD in the pool rather than a short residence time. It is observed in Fig. 10 that for nozzle nos. 1–6, the RTDs whether in the pool or in the nip point are not significantly different. Even though nozzle no. 1 produces more surface agitation than nozzle no. 6 because of its small port surface and flow patterns, they get the same residence time. With port diameter changing, the average velocity of fluid exiting the nozzle is different, as per equation (2·8), but the effect of distribution is still the same. Both nozzles had almost the same flow pattern; hence, the distributions of residence time are similar.
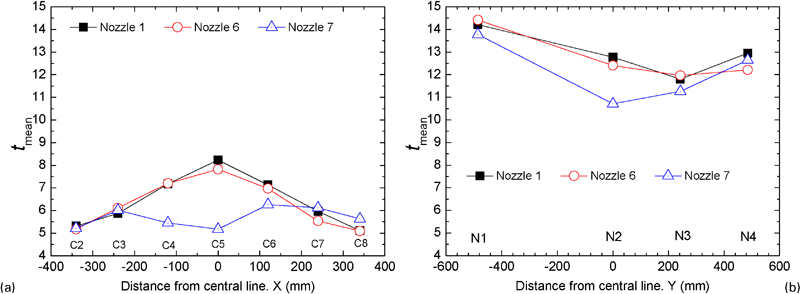
Mean residence time in different locations for nozzle nos. 1, 6 and 7: flowrate is 11·6 m3 h−1, and pool height is 270 mm
In the pool, the mean RTD displays an inverse V shape, and the residence time around the side dam is smaller than in the middle of the pool and manifests a good symmetry. However, the mean RTD in the nip point is opposite to the distribution in the pool, where the residence time in both sides is longer than the middle. For this result, the factors considered were as follows. First, for the liquid in the pool, fluid exits from the nozzle flow to both ends of the delivery device directly and come to the side dam first; hence, the residence times around the side dam are smaller than the others. Second, for the liquid in the nip point, fluid that flowed back from the side dam comes to the middle and combines with the fluid exiting from the middle of the delivery device, as shown in Fig. 11, which makes the residence time in the middle of the nip point smaller than both sides. The same situation becomes more obvious when there are holes in the nozzle. For nozzle no. 7, owing to the delivery effect of holes, the residence time in the middle of the pool becomes longer and more uniform, and fluid exits from the middle of the delivery device quickly.
Schematic of flow condition in pool
Effect of flowrate on metal delivery
The flowrate is another process parameter with a remarkable influence on the pool behaviours and is shown in Fig. 12. For the strip caster at the Industrial Materials Institute, the flowrates approximately correspond to an increase in the casting speed from 60 to 100 m min−1. For nozzle no. 7, the level fluctuations of most locations become greater as the flowrate increases. A different pattern is shown in Fig. 13 for the effect of flowrate on the mean residence time. For the pool and twin roll nip point, the flowrate has a completely different effect on the mean residence time. The t mean in the nip point decreases with increasing flowrate, which is caused because as the fluid nears the twin roll nip point, it has a higher velocity at larger flowrate. For t mean in the pool, when the flowrate increased from 8·7 to 11·6 m3 h−1, it has no obvious changes, but when the flowrate was 14·5 m3 h−1, t mean became bigger. Two factors are responsible for this: the increasing flowrate speeds up the fluid and much more liquid remains in the delivery device with a large flowrate. These factors make the flow inside the delivery device complex and increase the residence time. In terms of the above mentioned two factors, an increasing flowrate has the effect on the residence time in the twin roll nip point as Fig. 13 shows.
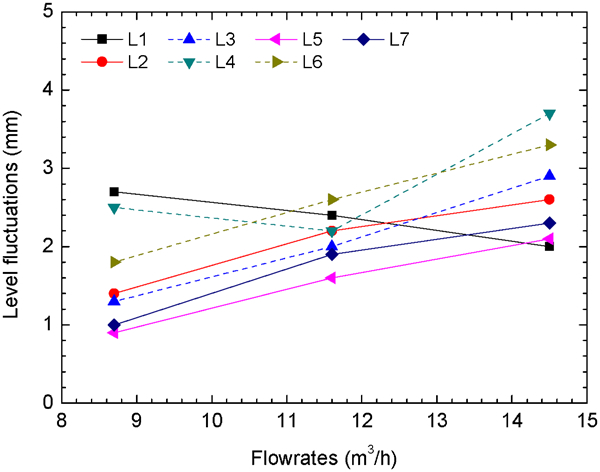
Level fluctuations for nozzle no. 7 for different flowrates: pool height is 270 mm
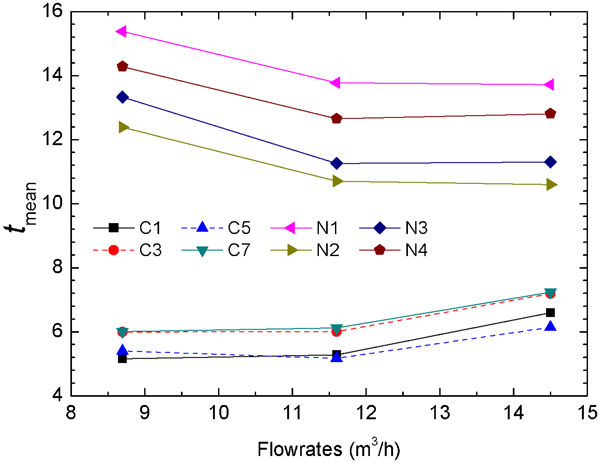
Mean residence times for nozzle no. 7 for different flowrates: pool height is 270 mm
Conclusions
In twin roll strip casting, a stable surface and an even distribution of the fluid across the width direction of the roll in the pool are desirable to obtain a high quality strip. A quantitative tracer study with a water model was carried out to determine the RTDs produced by various nozzle geometries and process parameters. These measurements were combined with pool level monitoring to identify a nozzle that simultaneously provided uniform distribution of fluid and stable surface. Based on the criteria, various nozzles having specific outlet and bottom holes were studied using water modelling.
According to the study, an outlet with a 50 mm extension was beneficial in reducing level fluctuations and was related to the length of the delivery device. The outlet angle decreased the impact force between the fluid flowing from the nozzle and the delivery device. The holes in the bottom of the nozzle increased the surface area and played a role in delivery. It was beneficial to obtain small and uniform level fluctuations as well as uniform mean residence times. Nozzle no. 7, which had bottom holes and flattened oblique outlets, provided satisfactory delivery conditions. At a given pool height, the level fluctuation and the residence time of the fluid in the pool increase with increasing casting speed. However, an increasing flowrate had a different effect on the residence times of the fluid in the twin roll nip point.
Footnotes
Acknowledgements
The authors gratefully acknowledge the financial support received from the Open Project of Shanghai Key Laboratory of Modern Metallurgy and Material Processing (grant no. SELF-2010-04) and the Project for Innovation Fund of Inner Mongolia University of Science and Technology (grant no. 2009NC006) and the Program for Changjiang Scholars and Innovative Research Team in University (grant no. IRT0739) and the graduate’s innovation fund of Shanghai University (grant no. SHUCX112239).