
Abstract
Slag is of great importance for dephosphorisation in converter steelmaking. In the present study, slag samples were equilibrated with copper at 1923 K to study their capacities in capturing phosphorous. The phosphate capacities of the slags were calculated. Some of the samples were liquid–solid mixtures. The solid phases in these samples were identified by SEM analysis, and the identified phases were found to agree well with Thermocalc calculations. On the other hand, the fractions of the solid phase did not agree with the Thermocalc calculation. Phosphorous distributions in the different phases were examined, and the phosphate capacities of the samples were evaluated. The MgO content did not show any appreciable impact on the phosphate capacity. The activities of FeO in the pure liquid slag samples were calculated and found to deviate positively from ideality.
Introduction
The demand for low phosphorous steel has made hot metal dephosphorisation an important objective for converter steelmaking. The slag is of importance in order to achieve good dephosphorisation; hence, phosphorous removal by slag has been studied extensively. Wagner1 defined phosphate capacity to quantify the capability of phosphorous pick-up by the slag. It has been reported that phosphorous forms 3CaO.P2O5 in the 2CaO.SiO2 saturated converter slag.2 – 6
Although some publications are available,7 – 14 the phosphate capacity data for converter slag are still too few to meet the demand of process optimisation.
The converter process at some steel plants seems to suggest the negative effect of MgO in the slag on phosphorus removal, yet this aspect has hardly been studied, mostly because of the difficulties in the high temperature experiments.
In the present study, the phosphate capacities of some CaO–SiO2–FeO–MnO–MgO slags and slag–solid mixtures were studied. The slags were equilibrated with liquid copper melt at 1923 K at an oxygen potential corresponding to the oxygen level at two-thirds of the oxygen blowing of a converter process. The effect of the MgO content on the phosphate capacity was examined, and the activities of FeO in pure liquid slag samples were also determined.
Experimental
Materials preparation
The chemicals along with their purity levels are listed in Table 1. MgO, SiO2 and CaO were calcined at 1273 K overnight, while MnO was dried in an oven at 393 K for 24 h.
Materials used in present study
Previous studies revealed that FeO is needed to be prepared first for successful slag preparation. For this purpose, Fe2O3 and Fe powder were mixed thoroughly in an agate mortar. The total composition of the mixture had a composition of 51 mol.-%O. The mixture was put in a closed iron crucible and then kept at 1323 K for 24 h in order to form FeO. The iron crucible was taken from the furnace and opened, and all the oxide components including FeO were weighed carefully and mixed rigorously to ensure a slag of the desired composition. About 7 g of each powder mixture was pressed into a pellet before the experiment.
For each experiment, 10 g copper powder was mixed with Fe3P powder in the agate mortar pressed into a pellet before use. The amount of Fe3P varied among the samples.
In order to control the oxygen partial pressure of the atmosphere, a mixture gas of CO–2·5%CO2 was used. The oxygen partial pressure was governed by the following equilibrium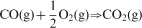

Apparatus and experimental procedure
The experimental set-up is shown in Fig. 1. A furnace supplied by Thermal Technology Inc. with graphite resistance heating elements and an alumina reaction tube was used. Attached to the top of the reaction tube was a cooling chamber made of water cooled brass flanges. The molybdenum crucible holder was held by a molybdenum rod, which was connected to the steel rod outside the hot zone. The steel rod was able to move through a sealed connection at the top of the cooling chamber. On the top outside of the cooling chamber, the steel rod was attached to a motor driving lift so that the sample could be moved vertically to lower and raise the sample. The lifting unit could move the sample from the even temperature zone to the cooling chamber within 2 s. Three gas inlets were positioned at the level of the sample when it was at the quenching position. Argon gas with high flowrate could be injected into the cooling chamber to cool down the sample even faster if required. The temperature was controlled and measured by B type thermocouples. The temperature variation over the sample holder was determined to be about ±2 K. The gas supply was controlled by a mass flow meter supplied by Bronkhorst.
Experimental set-up
In a general run, the prepared Cu–Fe3P pellet was placed in a molybdenum crucible. The pellet of the slag powder mixture was placed above the copper pellet in the crucible, placed into the Mo crucible holder and then the whole sample assembly was placed in the even temperature zone of the reaction chamber before the reaction chamber was sealed.
Before heating, the reaction tube was evacuated by a vacuum pump and filled with argon gas. This procedure was repeated three times to remove any trace of oxygen. After the last evacuation, the chamber was filled with the reaction gas, namely the CO–CO2 mixture. Thereafter, a constant gas flowrate of 3 L h−1 was kept throughout the whole experiment. The sample was heated to 1923 K and kept at this temperature for 24 h. After the equilibrating period, the samples were moved quickly to the cooling chamber and quenched by argon gas. At the same time, the mixture gas was stopped.
The samples were removed from the crucibles, and the slag and metal were carefully separated before sending them for analysis at ArcelorMittal R&D. The slag was analysed by X-ray fluorescence, and the metal was analysed by glow discharge mass spectrometry technique.
Results
The results of chemical analysis of the slag are listed in Table 2. It should be pointed out that the FeO contents are considerably lower than the weighed in contents, which were aimed at 15–20 mass-%. The analysed chemical compositions of copper samples are shown in Table 3. As seen in the table, the dissolved Fe in the copper phase has become considerably higher. Tables 2 and 3 clearly reveal that FeO has been partially reduced by gas atmosphere. This reduction has resulted in the dissolution of Fe into liquid copper.
Composition of slag after experiments
Analysed composition of metal samples after experiment
The original intention of this study was to study the capacities of some CaO–SiO2–FeO–MnO–MgO slags and slag–solid mixtures in capturing phosphorous. The reduction of FeO has somewhat changed the compositions originally targeted. However, the results are still useful for the steel industry as the FeO content can vary within a range of 0–30% during converter refining. In order to understand the effect of the presence of solid particles, pure liquid slag needs to be studied in the first place. For this purpose, Thermocalc calculations are conducted to predict the phase(s) present in each sample at 1923 K. Table 4 presents the calculated total fractions of solid phase and their natures. A comparison of the phases predicated by Thermocalc calculations with the phase diagram information shows a reasonable agreement.
Estimated presence of solid phases by Thermocalc
Note that only samples 15–23 are pure liquid at 1923 K. To confirm this aspect, the liquid samples were subjected to SEM analysis. The absence of any precipitation of solid phase indicates that the slag is fully liquid and sufficiently quenched.
Scanning electron microscope analysis was also carried out for slag samples of solid–liquid mixtures. The focus of these analyses is to identify the solid phases and their contribution in capturing phosphorus.
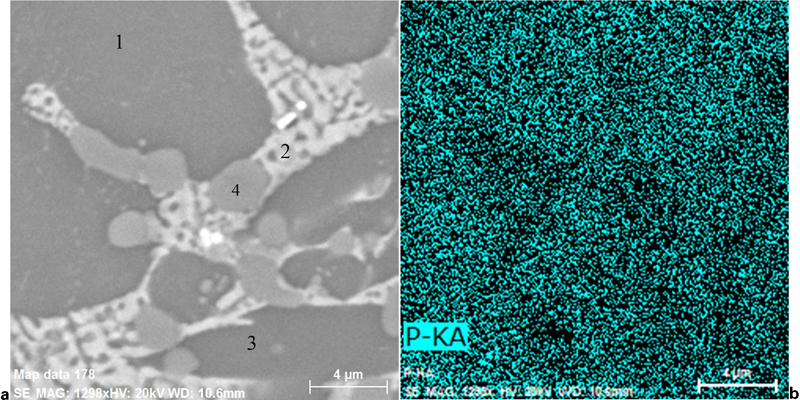
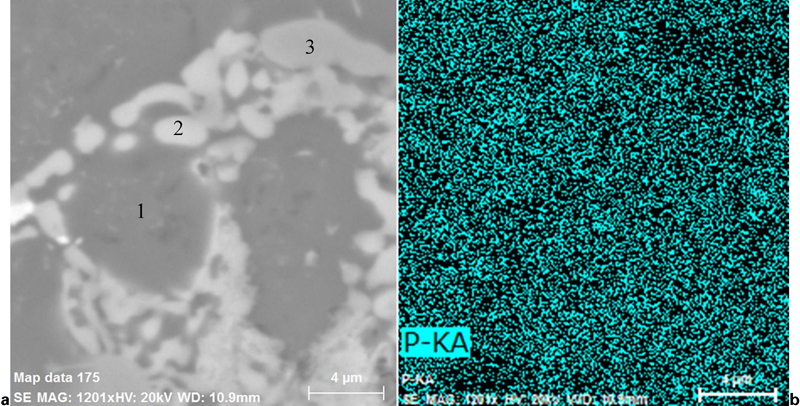
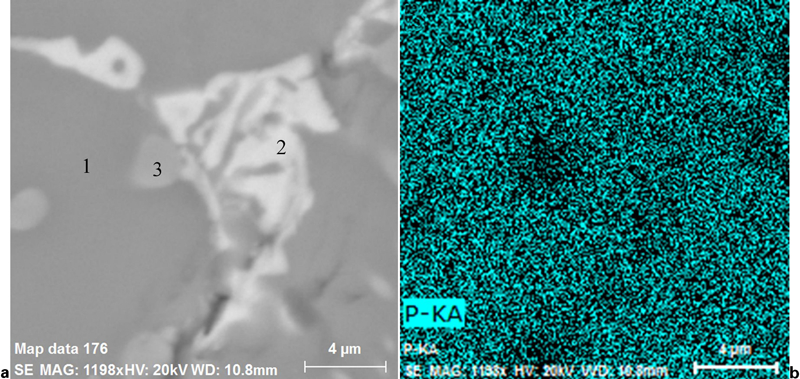
As shown in Table 4, samples with solid particles can be classified into five groups: liquid–CaO–3CaO.SiO2–MgO equilibrium, liquid–CaO–3CaO.SiO2 equilibrium, liquid–3CaO.SiO2–MgO equilibrium, liquid–2CaO.SiO2 equilibrium and liquid–MgO equilibrium. The examples of the different groups are presented in Figs. 2a –6a respectively. In order to gain an insight into phosphorus distribution in the different phases, Figs. 2b –6b present the element mapping of phosphorus in the same samples.
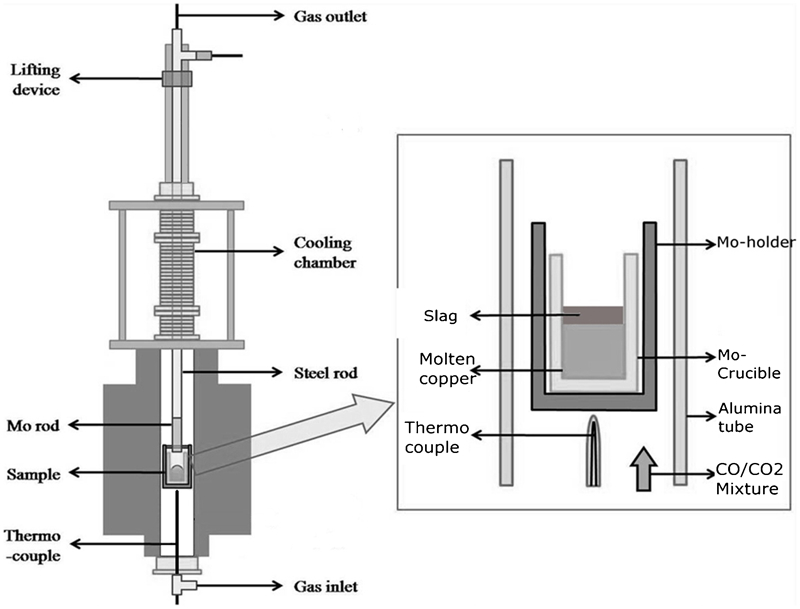
a microphotograph of area of phosphorous mapping in sample 4: (1) 3CaO.SiO2, (2) liquid, (3) MgO–FeO–MnO solid and (4) copper and b phosphorous mapping
a microphotograph of area of phosphorous mapping in sample 9: (1) 3CaO.SiO2, (2) liquid and (3) CaO and b phosphorous mapping
a microphotograph of area of phosphorous mapping in sample 14: (1) 3CaO.SiO2, (2) liquid, (3) 2CaO.SiO2–3CaO.P2O5 solid and (4) MgO–FeO–MnO solid and b phosphorous mapping
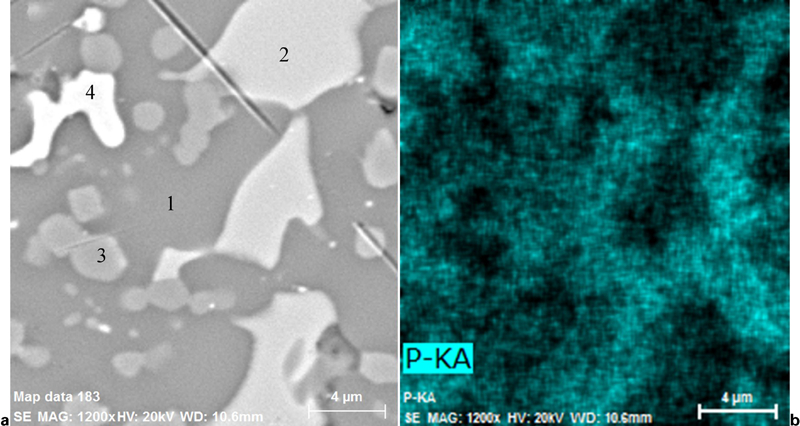
a microphotograph of area of phosphorous mapping in sample 11: (1) 2CaO.SiO2–3CaO.P2O5, (2) liquid and (3) MgO–FeO–MnO and b phosphorous mapping
a microphotograph of area of phosphorous mapping in sample 12: (1) 2CaO.SiO2–3CaO.P2O5, (2) liquid and (3) MgO–FeO–MnO solid and b phosphorous mapping
It should be mentioned that pure MgO phase was not detected in the samples. Energy dispersive spectroscopy analysis shows that instead of MgO, a solid solution of MgO, FeO and MnO (possibly spinel phase) was found, where the presence of MgO is predicated by the Thermocalc calculation. It should also be pointed out that in some of the slag samples, metallic copper was found. The tinny Cu droplets are very difficult to separate from the oxide phase.
As shown in Fig. 2a and b , phosphorous has a higher concentration in the 3CaO.SiO2 and CaO phases in the case of liquid–CaO–3CaO.SiO2–MgO(MgO–FeO–MnO solution) equilibrium. In the case of liquid–CaO–3CaO.SiO2 equilibrium (Fig. 3), the situation is similar. 3CaO.SiO2 and CaO phases again accommodate most of the phosphorous in the sample. In the samples having liquid–3CaO.SiO2–MgO (MgO–FeO–MnO solution), the 3CaO.SiO2 phase has the highest phosphorous concentration, as shown in Fig. 4. In the samples containing 2CaO.SiO2 (Fig. 5), 2CaO.SiO2 picks up more phosphorous. The solid phase MgO–MnO–FeO solution has a very small contribution in capturing phosphorous. This aspect is clearly brought out in Fig. 6. It is seen that MgO–MnO–FeO solution has a very low phosphorous in comparison with the liquid. The low capacity in capturing phosphorous of this phase is also confirmed in Fig. 2, where the liquid–CaO–3CaO.SiO2–MgO(MgO–FeO–MnO solution) equilibrium is presented.
Discussion
Phosphate capacity
Phosphorous removal is often presented in the literature as the phosphorous partition ratio or the phosphate capacity.1 The difficulties in finding a suitable crucible material to hold both slag and liquid steel ruled out the possibility of equilibrating the present slags with liquid steel. For this reason, the phosphate capacities of the slags were determined using Cu–slag equilibrium.
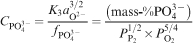
The phosphate capacity is defined as1


Calculated phosphate capacities


Table 5 shows that the presence of solid particles would increase the phosphate capacity greatly, even two orders of magnitudes higher compared to the liquid samples 15–23. It is also seen that the slag with the highest solid fraction (predicted by Thermocalc) has the highest phosphate apparent capacities.
Phosphorous pick-up in solid phases
A comparison of the results of SEM analysis with Thermocalc calculation reveals that the solid phases predicted by the thermodynamic calculation in general agree reasonably well with the experimental results. However, the predicted fractions of the solid phases do not agree well with the SEM observation. This disagreement could be due to either or both of the following two reasons. First, in the case of samples of pure liquid at 1923 K, the supercooling nature of the silicate liquid makes the quenching sufficient to maintain the liquid phase. However, the existence of solid particles makes the need for nucleation unnecessary. Hence, phase transformation would proceed fast, which leads to bigger fractions of solid phases after cooling. Second, the thermodynamic data in the database would possibly associate with uncertainties. These uncertainties would result in uncertainties in the fractions of solid phases. Confirmation of the phase relationships would require much efficient quenching and more delegated SEM study. This is out of the scope of the present work. Nevertheless, the experimental information would still provide quite reliable information regarding the distribution of phosphorus in the solid phases in a semiquantitative manner.
As seen in Figs. 2–6, phosphorous has a higher concentration in CaO, 3CaO.SiO2 and 2CaO.SiO2, but very low concentration in the MgO–FeO–MnO solid solution. Even the liquid phase has a considerably higher phosphorous concentration than this solid solution.
Although energy dispersive spectroscopy analysis cannot provide accurate composition, it is still interesting to compare the phosphorous concentrations in the solid phases in a semiquantitative manner. The P2O5 concentration ranges in the CaO, 3CaO.SiO2 and 2CaO.SiO2 phases are very similar, i.e. ∼3 mol.-%.
Many studies2
–
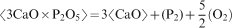
6 have suggested that phosphorous is picked up as 3CaO.P2O5 in solid solution with 2CaO.SiO2; thus, the equation for the phosphorous pick-up by 2CaO.SiO2 is as follows
The presence of solid particles improves the dephosphorisation power greatly thanks to the higher phosphorous capacity of the slag. On the other hand, an increased amount of solid particles results in higher slag viscosity and foaming propensity of the slag.17, 18 This will affect the dephosphorisation kinetics and the ability to control the converter blowing process without slopping (excessive foaming). For industrial application, we can assume that there is an optimal solid fraction in the slag that maximises the overall dephosphorisation efficiency.
Effect of MgO
The effect of MgO can be seen in Fig. 7. The figure contains both the phosphate capacities for the liquid slags and the apparent phosphate capacities of the solid containing slag. The addition of MgO does not show any strong impact on the phosphate capacity. The apparent phosphate capacities for the solid fraction slags show a slight decrease with increasing MgO.
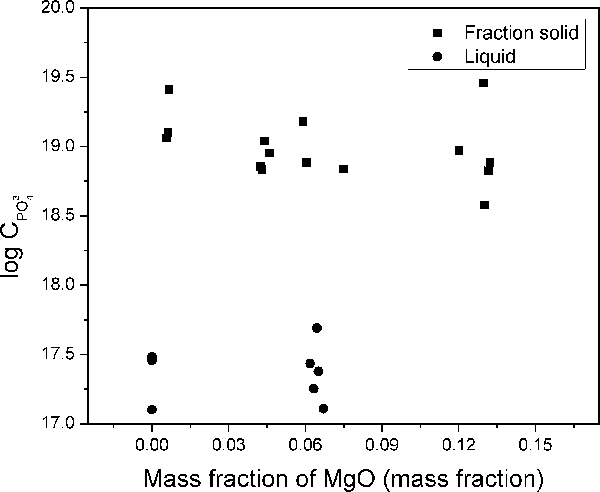
Effect of MgO
Activities of FeO
While the main focus of the present experiment is to determine the dephosphorisation power of different slag compositions, the data for dissolved Fe in copper would be useful to evaluate the FeO activities in the liquid slag.
The activities of FeO can be calculated based on the following equation19

Activities of Fe in copper obtained from Thermocalc and calculated activities of FeO(l)
Unfortunately, the constraints of thermodynamics do not facilitate the determination of phosphate capacity and FeO activity in the slag having 15–20 mass-%FeO. To make the measurements of FeO activity in the high FeO containing slag, the crucible material and equilibrating metal need to be carefully chosen (if there are any!).
Summary
Slag–copper equilibrium was utilised to study the dephosphorisation power of different slag compositions at 1923 K. The samples after equilibrating were studied in SEM to identify the phases, including the solid phases present. The phases present agreed well with Thermocalc, while the amounts of the solid phase were much higher in the samples. This was probably due to inefficient quenching. The phases were analysed for phosphorous content. It was found that 2CaO.SiO2, 3CaO.SiO2 and CaO were the main carriers of phosphorous. The activities of FeO in pure liquid samples were calculated and found to have a positive deviation from the ideal behaviour. It was seen that the MgO content did not have any strong impact on the phosphate capacity. One can assume that the observed detrimental effect of MgO on dephosphorisation in industrial converters resulted from the kinetic factors and the increase in slag viscosity because of the precipitation of MgO rich solid phases.
Footnotes
Acknowledgements
The EU Commission and the Research Fund for Coal and Steel are gratefully acknowledged for the financial support through the project BATHFOAM (project no. RFSR-CT-2008-00004).