
Abstract
This paper presents the experimental and model results of the response of an alternating current field measurement (ACFM) sensor to clusters of rolling contact fatigue (RCF) cracks typical of those found in rails and rail wheels. Both artificial and real cracks occurring in rails taken from service are considered. Currently, commercially available ACFM software is capable of producing an estimate of crack pocket length for isolated cracks, assuming they are regularly shaped. The results presented are part of continuing work to link the ACFM signal to the whole range of complex shaped RCF cracks that appear in rail and rail wheels, including those appearing in clusters. The challenges in accurately sizing clustered RCF cracks using the ACFM technique are discussed.
Introduction
Alternating current field measurement (ACFM) is a non-destructive testing technique for the detection and sizing of surface breaking cracks in metallic components. The technique works by inducing locally uniform and unidirectional currents in the component under test. Identifiable defects cause disturbances in the associated magnetic field, which can be evaluated to produce an estimate of crack size (surface and pocket lengths).
ACFM was first applied in the rail industry to inspect welds and tight geometries on train bogies, which are inaccessible to the standard inspection technique, i.e. magnetic particle inspection (MPI). At the same time, the capability to inspect axles was developed 1 and ACFM has now been accredited for use in the UK on rail wheelsets. 2
The prevalence of rolling contact fatigue (RCF) cracks in rails and wheels, due to higher axle loads and faster trains, is a major threat to the integrity of railways. There is a strong interest from infrastructure managers in the accurate evaluation of rails and wheels in order to improve the efficiency of preventative maintenance and reduce the need for reactive maintenance to the lowest possible level. Currently, the major effort is focused upon detection rather than accurate sizing of defects. However, detailed information on the subsurface size of RCF cracks could be used to optimise maintenance strategies and ultimately increase rail and wheel life and reduce costs.
ACFM is being investigated as part of the work to develop improved, integrated rail and wheel inspection systems capable of accurate defect sizing. 3,4 RCF cracks frequently appear in closely spaced groups, causing interactions in the ACFM signal. A sizing algorithm for isolated defects based on theoretical results and with empirical corrections for RCF crack shapes is available in an ACFM walking stick designed for deployment on rails. 2 While the identification of RCF clusters is possible using current ACFM technology, further development is required to be able to fully quantify RCF cracks within clusters. In this paper, initial results into the quantification of the ACFM response to clusters of RCF cracks are presented. Experimental measurements of both artificial defects and cracks that occurred in service are presented and compared with the results from a finite element method model.
Methodology
Experimental
As part of continuing work to link the ACFM signal to complex shaped and clustered RCF cracks, experimental ACFM measurements of both artificial and real RCF defects have been taken using a 5 kHz Amigo 255 ACFM micropencil probe produced by TSC Inspection Systems. The probe contains an integral field generator that induces a locally uniform current into the section of the rail under test. At 5 kHz in steel, the skin depth is very small, and in the presence of an RCF crack, the current flows underneath and around the defect, resulting in changes in the associated magnetic field above the rail component. Two magnetic field sensors within the probe measure the Bx and Bz signals (x and z components of the magnetic field respectively), which are then used as input in the ACFM software for defect sizing.
The sensor is controlled using an FS02N Kawasaki robotic arm and is used in combination with a Micro-Epsilon ILD1302-20 laser distance sensor. Using this arrangement (pictured in Fig. 1), the developed software allows the accurate measurement of the profile of the rail under test, and thus, the sensor liftoff can be precisely controlled. 5 Strict liftoff control is essential for accurate sizing since the magnetic field strength decreases as the square of the distance from the object under test.
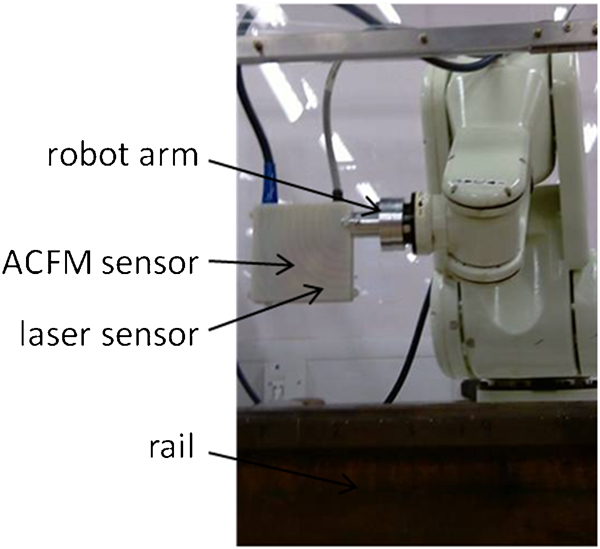
FS02N Kawasaki robotic arm holding 5 kHz Amigo 255 ACFM sensor and Micro-Epsilon ILD1302-20 laser distance sensor (within plastic surround) above section of rail
For maximum sensitivity to defects, the optimum ACFM sensor angle is parallel to the surface component of the cracks. 6 In this orientation, the maximum reduction in Bx is achieved over a given crack since the current flows perpendicular to the crack’s surface breaking component. This forces more current to flow directly under the crack than when there is an offset between the crack and the sensor angle, in which case the current may flow more easily along the crack faces. Thus, there is the greatest reduction in Bx when the sensor is parallel to the crack’s surface breaking component. The measurements presented here have been taken using this orientation. Scans are conducted parallel to the running direction of the rail above the centre of the cracks. The units of the ACFM sensor are analogue to digital conversion units (A/D).
Finite element method
To complement the experimental measurements, a finite element method model has been developed using COMSOL Multiphysics. 7 The model has previously been verified by comparison between model and experimental measurements for isolated defects. 8 It may be used to vary crack size and shape parameters, with no restrictions due to sample availability or the difficulty and expense of destructive testing.
The cracks are modelled in three dimensions within a rectangular approximation to a rail section, below a section of air, as shown in Fig. 2a . A uniform current is generated in the rail section by means of a current flowing around the boundary of the air section, parallel to the y axis. This mimics the placement of the ACFM sensor parallel to the defect. The presence of defects causes disturbances to the resulting magnetic field. When solved, the magnetic field above the section may be visualised, as in Fig. 2b . For comparison with experimental results, the solution along a line equivalent to the sensor’s path may be extracted. The model reports the results in SI units.
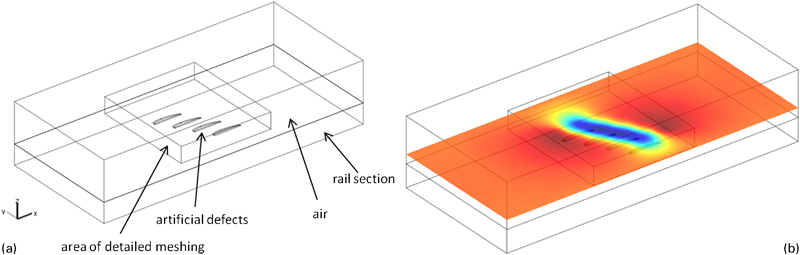
Model solution showing x and z components of magnetic field (Bx and Bz) at 2 mm above rail surface for cluster of four simulated RCF cracks: defects are each of surface length 10 mm, pocket length 4 mm and width 0·5 mm, angled horizontally at 32° to running direction and vertically at 25° from horizontal
Combined experimental and modelling approach
Commercial ACFM software is capable of producing an estimate of crack pocket length for isolated cracks. Given the Bx signal, the crack surface length and the liftoff of the sensor, the software references values stored in a lookup table, obtained through theoretical modelling, to output an estimate of the crack pocket length. Specifically, the background Bx value, Bx 0, obtained when the signal is undisturbed by a defect, and the maximum reduction in Bx signal, ΔBx max, are required. The ACFM software also uses Bz d, the linear distance between peak and trough in the Bz signal, to estimate the surface crack length.
The algorithm for crack pocket length estimation is based on the assumption that the subsurface portion of the crack is planar and semi-elliptical in shape. In practice, this often provides a reasonable approximation to the shape of RCF cracks in rails and wheels, particularly light to moderate 9 RCF cracks in rails (categorised by surface lengths of <10 mm and between 10 and 20 mm respectively). 10 However, the shape of the larger RCF cracks (heavy–severe, with surface lengths 20–30 mm and >30 mm) may be more complex, and RCF cracks in general regularly appear in clusters. In these cases, using the currently available sizing algorithms will result in significant errors. It is the aim of this ongoing work to develop improved methods for sizing the whole range of RCF crack types that appear in rails and wheels, including the development of an extended lookup table that may be used for clustered cracks. Therefore, verification of the model output by comparison between experimental ACFM scans of real and simulated RCF defects is being carried out.
Since the experimental and model results are reported in different units, a normalisation of the signals 8 is carried out to facilitate comparison between the two. This is appropriate since the sizing process requires only the dimensionless ratio ΔBx max/Bx 0 and the linear distance Bz d.
Results
Model verification for multiple cracks
A comparison between model and experimental response to a cluster of four artificial defects has been conducted. The physical defects were created in a section of rail using electrical discharge machining. The defects are each of surface length L 10 mm, pocket length K 4 mm and width 0·5 mm, angled horizontally b at 32° to the running direction and vertically a at 25° from horizontal. Their vertical depth in the rail V is therefore 1·69 mm, and they are positioned 12 mm from the gauge face of the rail B (see Fig. 3 for definitions of the defect parameters used). Figure 4 shows the model and experimental measurements of the cluster. The experimental data are presented in both raw format and smoothed using a five-point moving average filter.
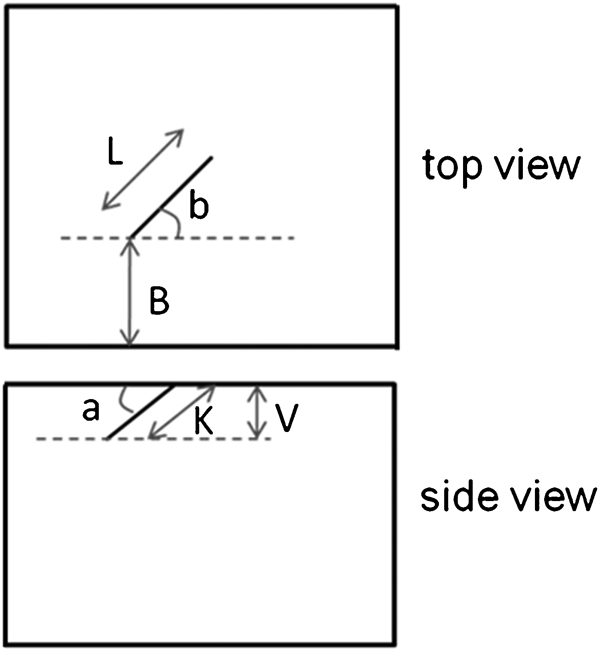
Schematic of crack geometric parameters
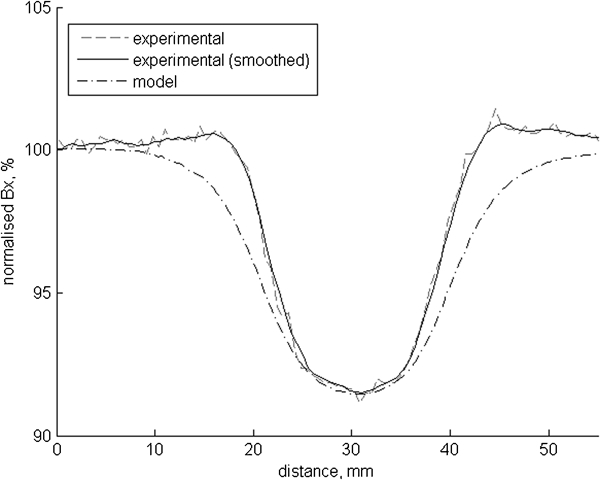
Comparison of experimental and model ACFM Bx response to presence of cluster of four artificial RCF defects at 3 mm liftoff for purpose of model verification: x axis represents position along line scanned with ACFM probe; centre of first crack is positioned 25 mm from start of scan line
For comparison purposes, both sets of data have been normalised. It can be seen that the model and experimental results match well. In particular, an excellent match between experimental and model maximum reduction in normalised Bx signal (ΔBx max/Bx 0) has been obtained: a ΔBx max/Bx 0 value of 91·44 for the model and 91·48 for the smoothed experimental ACFM signal. This indicates that the developed model can be used to predict the ACFM signal for clusters of RCF type defects or, alternatively, potentially to predict the crack size from the ACFM signal, assuming a known crack shape (semi-elliptical). Other variables such as the number and spacing of the cracks need to be considered, and this is discussed below.
Modelling of variation in number of cracks
The RCF cracks may appear in closely spaced clusters, with spacings of 0·8–1·7 mm having been reported 11 (wider spacings of up to ∼20 mm are also reported). The length of the cluster, and hence number of cracks present, will also vary. The effect of changing the number of cracks within a cluster with 1 mm spacing between each crack has been modelled and is shown in Fig. 5. The size and angle of the cracks are the same as those modelled in the section on ‘Model verification for multiple cracks’. It can be seen that as the number of cracks increases, the trough in the Bx signal elongates and deepens. As the number of cracks further increases, the reduction in Bx signal begins to saturate. At 1 mm spacing, only one trough appears in the Bx signal despite the presence of multiple cracks. In order to quantify the size of defects in a cluster of closely spaced RCF cracks, it is necessary to independently obtain information on the number of cracks, their spacing and their surface length, in addition to the Bx signal; this can be done by visual observation.
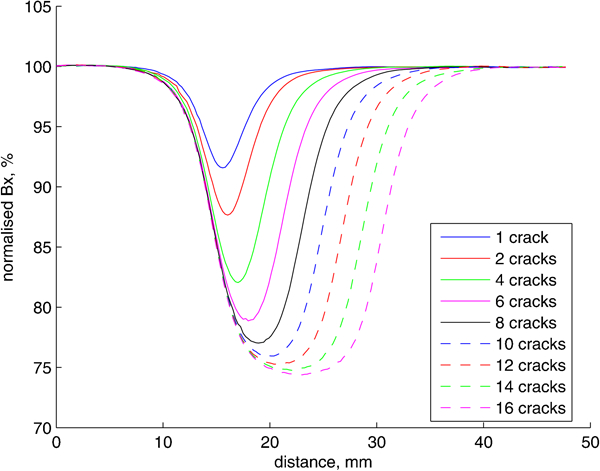
Normalised Bx signal in response to multiple cracks at zero liftoff obtained with COMSOL model: defect size and orientation are same as for defects presented in Fig. 2 (inter-crack spacing is 1 mm)
Modelling of variation in crack spacing
The effect of varying crack spacing on the ACFM Bx signal at zero liftoff has been modelled, and the results are shown in Fig. 6. The cracks are arranged in clusters of four defects, and the results are presented for inter-crack spacings of 3, 5, 7, 9 and 15 mm. It can be seen that at 3 mm spacing, individual troughs are not present, meaning that the presence of multiple cracks is difficult to determine from the ACFM signal alone. At wider crack spacings, individual troughs are present but their depth is greater than would be expected for an isolated defect of the same size as the cracks within the cluster. The Bx signal does not return to the background level between defects, even at 15 mm spacing. Therefore, even if the Bx signal indicated the presence of multiple cracks, independent information on their spacing and surface length would be required before they could be sized.
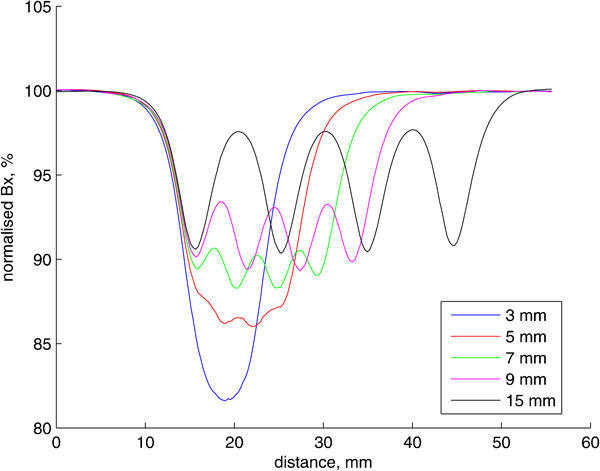
Normalised model response to clusters of four artificial cracks at zero liftoff: cracks are spaced at 3, 5, 7, 9 and 15 mm, and their dimensions and orientations are same as those presented in Fig. 2
Experimental measurements of multiple RCF cracks
Figure 7 is a photograph of a 180 mm long section of rail taken from service containing multiple RCF cracks towards the gauge side. It has been painted and MPI applied in order to highlight the cracks and facilitate measurement of their surface breaking components. The size and orientations of the cracks are summarised in Table 1. The rail section contains 11 defects of surface length (as a straight line approximation) between 10 and 26 mm and at various spacings of between 4 and 21 mm at the central position of the cracks, taken to be 16·5 mm from the gauge side.
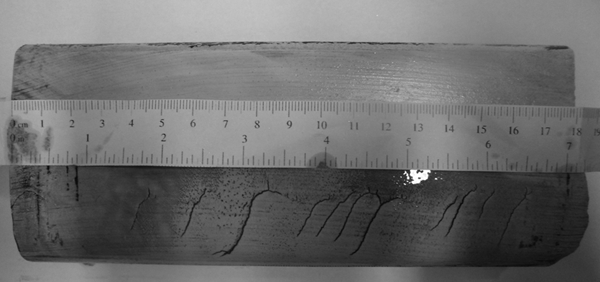
Photograph of section of rail taken from service containing 11 RCF defects: rail surface has been painted and MPI applied to highlight cracks
Dimensions and orientations of RCF cracks contained in section of rail taken from service (pictured in Fig. 7)
An experimental scan at 3 mm liftoff has been taken along the running direction of the rail, starting 20 mm from the left hand side of the rail and ending 5 mm before the right hand edge (as pictured). The scan was taken over the central position of the cracks, with the probe held at 23°, parallel to the average angle of the cracks.
Figure 8 shows the experimental Bx signal. The graph has been divided into three regions. The first region contains the signal from cracks 1, 2 and 3. The spacings between these cracks are 17, 17 and 18 mm, and distinct troughs can be seen for each of the cracks. In the second region, a large single trough is present. This corresponds to the cluster of cracks 4–7, with smaller inter-crack spacings of 6, 6 and 7 mm. In the third section, there is also a clear reduction in the Bx signal due to cracks 8–11. There are clear interactions in the signal for these four cracks, although a single trough shape is less clear. The gap between cracks 10 and 11 is 10 mm, at which spacing it is expected that individual troughs would be distinguishable. In addition, crack 10 is significantly shorter than the others and the ACFM sensor only passes the end, rather than the centre, of this crack.
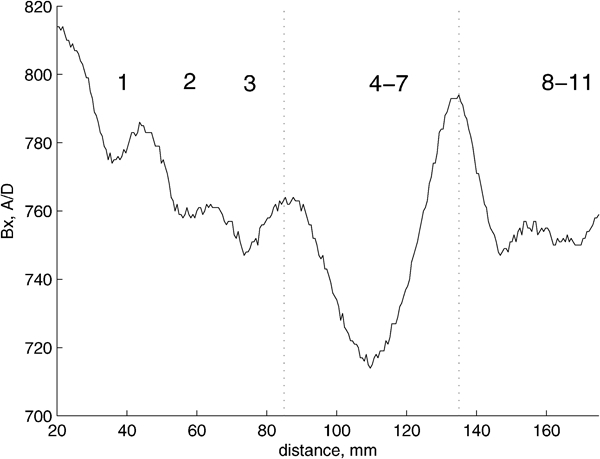
Notice that at no point in this scan is a clear background level reached due to the presence of defects along the length of the section. A representative background Bx level is required in order to normalise the signal so that direct comparisons with the model output can be made.
Further work is needed to determine the most appropriate way to approximate the background level when it is not possible to directly measure it due to the presence of defects along the whole section under consideration. Modelling of non-planar, S shaped cracks will also be carried out in order to determine the appropriateness of the planar assumption of crack shape.
In addition, modelling of this rail using surface crack dimensions (measured surface length and spacing) and assumed shape is being carried out for comparison with the experimental results. Destructive testing is also ongoing to provide information on the actual crack pocket lengths, which will be used to further verify the model for multiple cracks and to help determine the limits of applicability of any quantification algorithms that are developed for multiple cracks as part of this work.
Conclusions
Rolling contact fatigue cracks in rails and wheels often occur in clusters. It has been shown that the ACFM response is affected by the spacing and number of cracks present. The presence of multiple cracks causes a greater reduction in the Bx signal from the background level than for an isolated defect. As the number of defects increases, so does the decrease in Bx signal, although this effect saturates above a certain number of cracks. The saturation point depends upon the spacing of the cracks in the cluster.
The reduction in Bx signal from the background increases the more closely spaced cracks are within a cluster. For cracks of 10 mm surface length and 4 mm pocket length at close spacings of <∼5 mm, the ACFM Bx signal, modelled for a zero liftoff, shows a single trough, making the presence of multiple cracks difficult to discriminate from the ACFM signal alone. At spacings of >5 mm, individual troughs can be distinguished, although the Bx signal does not return to the background level between cracks for the defect spacings considered here (up to 15 mm).
Quantification of defects within closely spaced clusters is more difficult than for isolated cracks due to the interactions in the signal. Using established sizing techniques for isolated defects as a starting point, combined with additional modelling results for multiple cracks, it may be possible to size defects contained in the clusters. It will be necessary to combine the ACFM signal with the knowledge of the number of defects and their spacing, obtained by visual inspection, for example. In addition, certain assumptions about crack morphology, e.g. that cracks are planar and semi-elliptical, will need to be made. It will also be necessary to develop a method for accurately estimating the background signal level where one is not readily measurable.
Footnotes
Acknowledgements
The research leading to these results has received funding from the European Community’s Seventh Framework Programme (grant no. FP7/2007-2013) under grant agreement no. SCP8-GA-2009-234040 (INTERAIL Project, www.interailproject.eu) and grant agreement no. SCP7-GA-2008-218674 (SAFERAIL Project, www.saferail.net).