
Abstract
The failure mode of resistance spot welds (RSWs) (interfacial versus pullout) is a qualitative measure of RSW performance. Considering the adverse effect of interfacial failure mode on the vehicle crashworthiness, process parameters should be adjusted so that the pullout failure mode is guaranteed, ensuring reliability of spot welds during vehicle lifetime. In this paper, the microstructure and mechanical properties of dissimilar RSWs between HSLA420 and drawing quality specially killed low carbon steels are studied with particular attention to failure mode. Increasing the welding current alters the failure mode from interfacial failure mode to pullout mode due to the increase in fusion zone (FZ) size. The minimum required FZ size to ensure the pullout failure mode was estimated using an analytical model. The FZ size proved to be the most important controlling factor of the spot weld peak load and energy absorption.
Introduction
Resistance spot welding is the dominant joining process in sheet metal industries, particularly in the automotive industry. Vehicle crashworthiness, which is defined as the capability of a car structure to provide adequate protection to its passengers against injuries in the event of a crash, depends largely on the integrity and mechanical performance of the spot welds.1, 2 Therefore, spot welds with high load bearing capacity and high energy absorption capability are needed to maximise load transfer and energy dissipation during a car crash. Hence, the quality and performance of resistance spot welds (RSWs) are very important for the determination of durability and safety design of the vehicles. There are generally three indices for quality control of RSWs:
fusion zone (FZ) size. The FZ size, which is defined as the width of the weld nugget at the sheet/sheet interface in the longitudinal direction, is the most important factor in determining the quality of spot welds3
weld mechanical performance. Spot weld mechanical performance is generally considered under static/quasi-static and fatigue loading conditions. The tensile–shear test is the most widely used test for evaluating the spot weld mechanical behaviour in the static condition.4 Peak load, obtained from the tensile–shear load–displacement curve, is often used to describe the spot weld mechanical behaviour. In addition to peak load, failure energy can be used to better describe the spot weld mechanical behaviour. Failure energy is a measure of weld energy absorption capability, and its higher value demonstrates the increase in weld performance reliability against impact loads such as accidents4, 5
failure mode. Failure mode is the manner that the spot weld fails. Generally, the RSW failure occurs in two modes: interfacial and pullout.6 – 8 Figure 1 shows a typical fracture mode during mechanical testing of a spot weld. In the interfacial mode, failure occurs via crack propagation through FZ, while in the pullout mode, failure occurs via the nugget withdrawal from one sheet. Spot weld failure mode is a qualitative measure of weld quality. Failure mode can affect significantly the load bearing capacity and energy absorption capability of RSWs. Generally, the pullout mode is the preferred failure mode due to its higher associated plastic deformation and energy absorption. Thus, vehicle crashworthiness as the main concern in automotive design can be reduced dramatically if the spot welds fail via the interfacial mode. The pullout failure mode during quality control indeed indicates that the same weld would have been able to transmit a high level of force, thus causing severe plastic deformation in its adjacent components and increasing strain energy dissipation in crash conditions.9
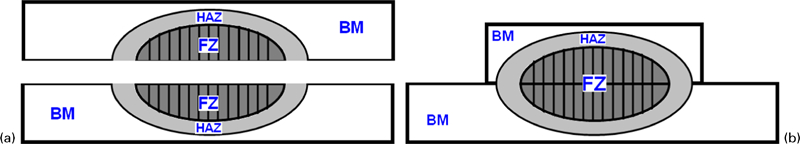
Schematic representation of general failure modes, which can occur during tensile–shear test
Most researches have been focused on similar resistance spot welding. However, in many applications, spot welds are made between different materials and thicknesses as the mechanical properties are tailored to local requirements.10 Understanding the nature of RSW failure is usually straightforward when both sheets are of the same material. However, failure behaviour of dissimilar RSWs can be problematic due to the reasons summarised below:
difference in the physical properties of the base metals (BMs)
difference in the mechanical properties of the BMs (strength, ductility and workhardening behaviour)
more complicated microstructural variations across the weld nugget.
Therefore, research towards a better understanding of the resistance of spot weldability between different steel grades is needed. There are limited data in the public domain on dissimilar steel RSWs. Alenius et al. 11 studied the weldability of various dissimilar metal joints between austenitic stainless steel and non-stainless steels. They concluded that the strength of the dissimilar joint in the tensile–shear test is dictated by the strength and thickness of the non-stainless steel. Marashi et al. 12 and Pouranvari and Marashi13 studied the microstructure and failure behaviour of similar and dissimilar spot welds of low carbon steel (LCS) and 304 stainless steel RSWs. They found that the hardness of the FZ, which is governed by the dilution between two BMs, and the FZ size of the galvanised carbon steel side govern failure mode. Moreover, it was found that the dissimilar welds exhibit the lowest tendency to fail in the interfacial mode in comparison with similar welds. Poggio et al. 14 studied the effect of resistance spot welding parameters on dissimilar DP600/304 stainless steel joint. Khan et al. 15 investigated the static and fatigue performance of DP600/HSLA350. They concluded that the fatigue performance of dissimilar material HSLA350/DP600 spot welds was similar to that of similar HSLA350/HSLA350 spot welds. Baltazar Hernandez et al. 10 studied the mechanical behaviour of RSW of DP600 spot welded to a high strength low alloy (HSLA), DP780 and TRIP780. They concluded that a pullout failure mode was obtained when DP600 is paired with other advanced high strength steels compared with the DP600 welded to itself, which is prone to interfacial failure given the same weld size.
One of the important dissimilar joints in the automotive car body is dissimilar resistance spot welding of HSLA steels and drawing quality specially killed (DQSK) LCSs. Therefore, considering the limited open literature on this issue, this paper aims at investigating the microstructure and mechanical properties of dissimilar RSWs between HSLA420 and DQSK LCSs during the tensile–shear test. The transition in failure mode from interfacial to pullout mode is also studied in detail.
Materials and methods
Uncoated DQSK LCS (1·5 mm) and HSLA420 steel sheets (1·5 mm) were used as BMs. The chemical composition and mechanical properties of the BMs are presented in Tables 1 and 2 respectively. Resistance spot welding was performed using a 120 kVA ac pedestal type resistance spot welding machine controlled by a Programmable Logic Controller (PLC), operating at 50 Hz. Welding was conducted using a 45° truncated cone RWMA class 2 electrode with 8 mm face diameter.
Chemical composition and mechanical properties of investigated steels
Tensile properties of BMs used in this study*
*YS, yield strength; UTS, ultimate tensile strength; n, strain hardening exponent; EL, total elongation.
To study the effects of weld FZ size on failure mode and mechanical properties, spot welding was performed in 12 different welding conditions. Electrode force and electrode holding time after current off were selected based on the thickness of the base material and were kept constant at 4 kN and 0·2 s cycles. Welding current was changed step by step from 6 to 11·5 kA at a welding time of 0·2 s. No expulsion was observed during welding using these welding conditions. Because of the detrimental effect of weld expulsion on mechanical performance, welding parameters were adjusted so that the expulsion is avoided during RSW. Four samples were performed per welding conditions, including three samples for the tensile–shear test and one sample for metallographic investigation.
The samples for the quasi-static tensile–shear test were prepared according to AWS D8·1M standard.16 Figure 2a shows the sample dimensions of the tensile–shear test. Since the tensile–shear specimen is asymmetrical, two shims having the same thickness were added at the grip sections of the specimen to ensure the alignment and to reduce the sheet bending and nugget rotation. The tensile–shear tests were performed at a crosshead speed of 2 mm min−1 with an Instron universal testing machine.
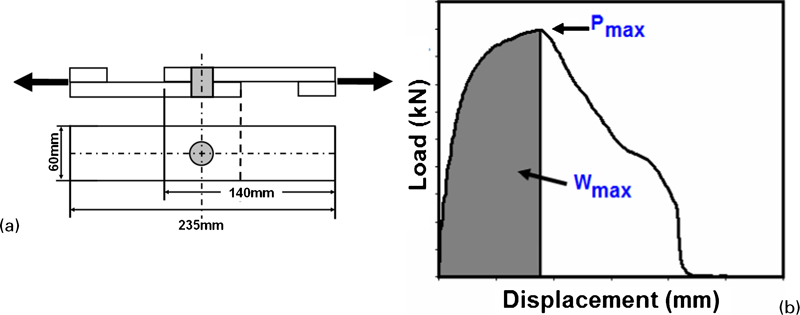
a tensile–shear specimen dimensions and b typical load–displacement curve along with extracted parameters: P max, peak load; W max, energy absorption
Figure 2b shows a typical load–displacement curve and the extracted parameters. The mechanical performance of the welds was described in terms of peak load P max and failure energy W max. Failure modes were determined by observing the weld fracture surfaces.
Samples for metallographic examination were prepared using standard metallography procedure. Optical microscopy was used to examine the macro- and microstructures and to measure FZ (i.e. weld nugget) size.
Microhardness test, a technique that has proven to be useful in quantifying the microstructure–mechanical property relationship, was used to determine the diagonal hardness profile using an indenter load of 100 g for a period of 20 s to obtain hardness. The hardness indentations were spaced 0·3 mm apart.
Results
Figure 3 shows a typical macrostructure of a dissimilar HSLA/DQSK RSW. The joint region consists of three distinct zones: FZ, heat affected zone (HAZ) and BM. A typical hardness profile of the joint is shown in Fig. 4. The DQSK BM microstructure consists of ferrite grains with a corresponding hardness of 110 HV. The HSLA microstructure consists of very fine polygonal ferrite grains; the corresponding hardness is 180 HV. As can be seen in Fig. 5, FZ exhibits a complex microstructure including martensite, upper bainite, allotriomorphic ferrite and Widmanstätten ferrite with an average hardness of 330 HV (Fig. 5).
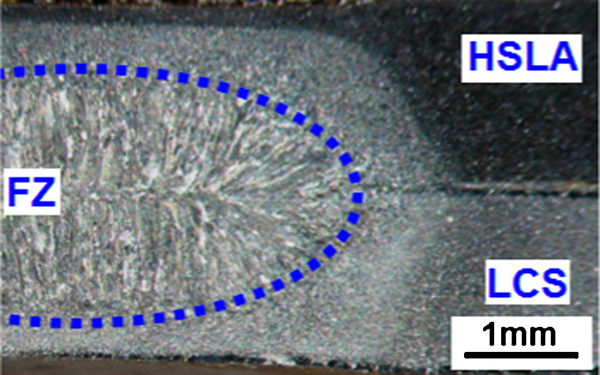
Typical macrostructure of HSLA/LCS spot welds
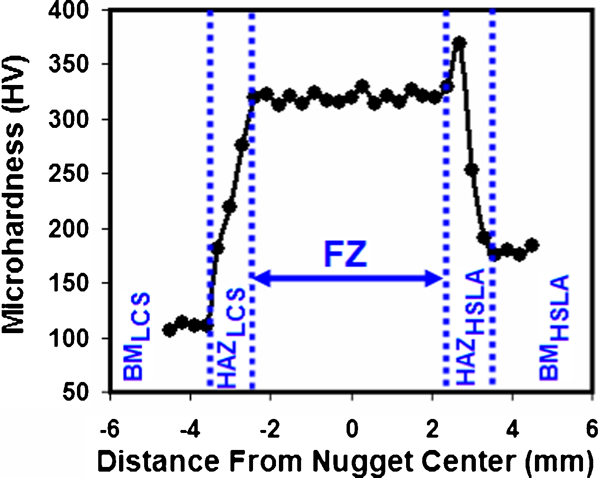
Typical diagonal hardness profile of HSLA/LCS spot welds
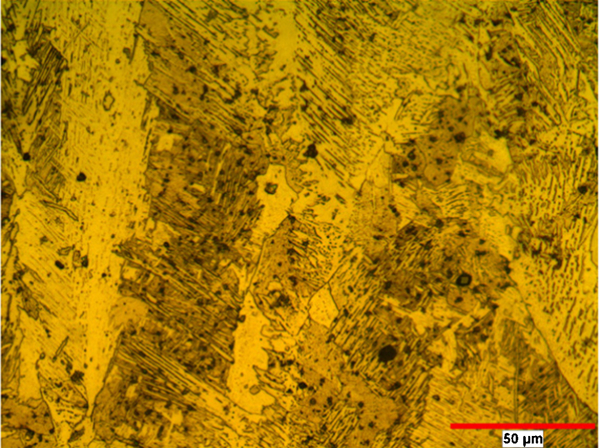
Microstructure of FZ of HSLA/DQSK spot welds
Two distinct failure modes were observed during the static tensile–shear test: interfacial fracture and nugget pullout. Figure 6 shows the effect of welding current on the FZ size and failure mode. As can be seen, the FZ size increases as the welding current increases due to increasing heat generation at the faying surfaces. Experimental results showed that increasing the welding current alters the failure mode from the interfacial one to the pullout one. A minimum welding current of 7 kA is required to ensure pullout failure mode. Moreover, there is a critical weld FZ size beyond which the pullout failure mode is expected. As can be seen in Fig. 6, a minimum FZ size of 4·1 mm is required to ensure the pullout failure mode.
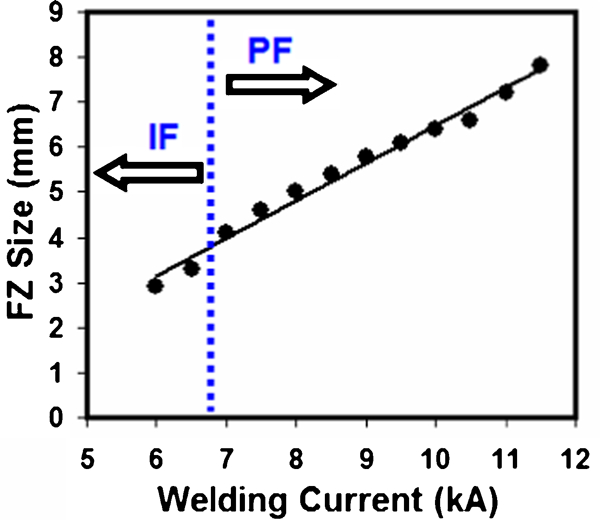
Fusion zone size versus welding current in HSLA/DQSK spot welds
To examine the relationship between the peak load (and the failure energy) and the weld nugget size, a scatter plot of peak load (and failure energy) versus weld size was constructed, and a trend line was added to the scatter plot to show the general trend. The effect of the FZ size on the peak load and energy absorption of the spot welds is shown in Figs. 7 and 8 respectively. As can be seen, there is a direct relationship between FZ size and peak load (energy absorption).
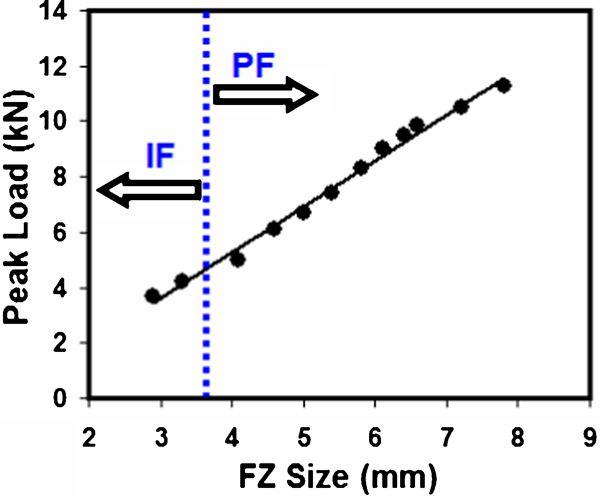
Peak load versus FZ size in HSLA/DQSK spot welds
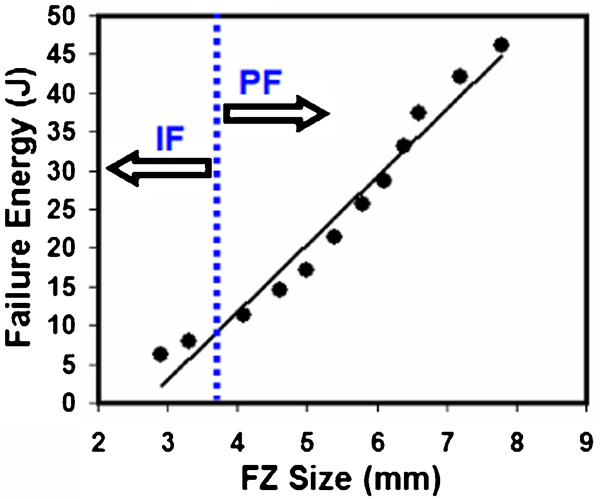
Failure energy versus FZ size in HSLA/DQSK spot welds
Discussion
Analysis of hardness profile
The macro- and microstructural attributes and hardness characteristics of the RSWs are the most important factors affecting their failure behaviour. The hardness variation across the joint can be analysed in terms of the microstructure of the joint. The formation of bainite and martensite in the FZ explains the higher hardness of the FZ compared with the BM hardness. Martensite formation in the FZ is attributed to the inherently high cooling rate of resistance spot welding process due to the presence of water cooled copper electrodes and their quenching effect as well as the short welding cycle.17, 18
The hardness of the HAZ in both sides is higher than the BM hardness due to the formation of non-equilibrium phases. The microstructure was more heterogeneous in the HAZ than in the FZ as is verified by the hardness profile. The material in the HAZ experiences a peak temperature and a cooling rate, which is inversely proportional to its distance from the fusion line.19 Thus, the high thermal cycle gradient coupled with the resulting austenite grain structure can explain the observed microstructure gradient in the HAZ. It is interesting to note that the peak hardness in HAZHSLA is higher than the FZ hardness. It is well documented that the hardness in the supercritical HAZ (i.e. coarse grain HAZ) in a similar joint of steel RSWs is slightly higher than that in the FZ. In this region, both high cooling rate and large grain size promote the formation of martensite. Despite the fact that both coarse grain HAZ and FZ exhibit martensite, a smaller martensite lath size in coarse grain HAZ increases its hardness compared with the FZ. In the case of dissimilar HSLA/LCS spot welds, mixing HSLA steel (C = 0·08; Mn = 0·72) and LCS (C = 0·04; Mn = 0·20) reduces the hardenability of the FZ compared with the HAZ at the HSLA side. Therefore, the higher hardness of the HAZHSLA/FZ boundary can be attributed to its higher hardenability rather than the FZ, in addition to the above mentioned factors.
Effect of FZ size on failure mode
The effect of FZ size on the failure mode can be explained in terms of stress distribution in the spot weld during the tensile–shear test. Figure 9 represents a simple stress analysis of the spot welds during the tensile–shear test.20 Failure is a competitive phenomenon, i.e. spot weld failure occurs in a mode that needs less force. During the tensile–shear test, the shear stress at the sheet/sheet interface and the tensile stress created in the nugget circumference are the driving forces for the interfacial and pullout failure modes respectively. Each driving force has a critical value, and the failure occurs in a mode in which the driving force reaches its critical value first. Physical weld attributes, particularly weld nugget size, are the most important governing parameters of the failure mode of RSWs. Weld nugget size is the most important parameter determining stress distribution. For those welds with small weld size, the shear stress reaches its critical value before tensile stress, causing failure in the circumference of the FZ. Therefore, failure tends to occur under interfacial failure mode. Increasing the FZ size increases the weld nugget resistance against interfacial (i.e. shear) failure. Therefore, there is a critical FZ size above which the pullout failure mode is ensured.
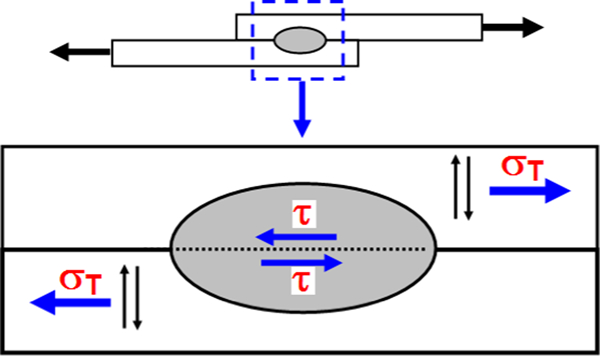
Simple model describing stress distribution at interface and circumference of weld nugget during tensile–shear test20
Failure mode analysis
In this section, a simple analytical model is used to predict joint failure mode during the tensile–shear testing of HSLA/DQSK steel RSWs. Spot welds fail in the mode that requires less force. Therefore, in order to construct a model to predict the failure mode, it is first necessary to develop two relations for calculating the required force for each failure modes.
First, consider the peak load of the spot welds in the interfacial mode. As mentioned above, the driving force of interfacial mode is shear stress (see Fig. 9). Therefore, considering nugget as a cylinder with diameter d and height 2t, the failure load for the interfacial failure mode P
IF could be expressed as equation (1), assuming uniform distribution of shear stress in the weld interface
Now, consider the peak load of the spot welds in pullout failure mode. The characteristic mechanisms of the pullout failure mode in tensile–shear testing include rotation of the weld nugget and stretching, thinning and necking in the nugget circumference. Indeed, even though the loading condition is nominally shear, the pullout failure is predominantly tensile through rotation and preferential necking in the soft region of the nugget circumference.10,20
–
22 Therefore, the driving force of pullout mode is the tensile stress at the nugget circumference (see Fig. 9). In the pullout failure mode, it is assumed that failure occurs when the maximum radial stress at the circumference of one-half of the cylindrical nugget reaches the ultimate strength of the failure location. Therefore, equation (2) is suggested for the pullout failure of spot weld in the tensile–shear test
Failure is a competitive process, i.e. spot weld failure occurs in a mode that needs less force. A critical FZ size d
Cr can be defined, which determines which one of the failure modes happens. Spot welds with d<d
Cr tend to fail via interfacial failure, and welds with d>d
Cr tend to fail via nugget pullout failure mode. Therefore, to obtain critical nugget diameter d
Cr, equations (1) and (2) are intersected, resulting in equation (3)

Direct measurement of the mechanical properties of different regions of the spot weld is difficult. It is well known that there is a direct relationship between material tensile strength and their hardness. Therefore, we can write

It is well established that the dominant pullout failure mechanism in the tensile–shear test is through thickness necking.10,20 – 22 Therefore, the location of the failure in the pullout failure mode in this test is governed by the hardness profile characteristics of the weld. Necking tends to occur where hardness has its lowest value. In HSLA/LCS welds, the pullout failure location is determined by the competition between the necking of HSLA and LCS steel sheets. Since the tensile strength and hardness of LCS are lower than those of the HSLA sheet, the LCS sheet experiences severe necking, leading to the initiation of failure at this point.
For dissimilar HSLA/LCS, the hardness ratio of FZ to failure location (i.e. LCS BM) is about H FZ/H PFL = 330/110 = 3. By substituting these values in equation (5), the critical FZ size is calculated to be 4 mm. Figure 6 shows that this value clearly separates the interfacial and nugget pullout failure modes. The applicability of the proposed model is also verified for predicting the minimum FZ size required to obtain the pullout failure mode for RSWs of similar joints made on LCSs,18, 21 austenitic stainless steel23 and various grades of dual phase steels.21, 24, 25
It is of note that the critical FZ size for HSLA/DQSK is lower than the reported values for HSLA/HSLA and LCS/LCS joints.26 This can be attributed to the differences in hardness profile of similar and dissimilar joints. Indeed, decreasing the ratio of FZ hardness to failure location hardness raises the tendency to fail in interfacial failure mode (i.e. larger d Cr). Softer FZ and harder BM make the joints more susceptible to fail in the interfacial mode.
Mechanical properties
The load carrying capacity and the energy absorption capability of spot welds depend on their physical attributes, especially weld nugget size, failure mode and failure location strength.7, 26, 27 The peak point in the load–displacement plot of the tensile–shear test corresponds to the point of crack propagation through the weld nugget for the interfacial mode, and to the necking/cracking point at failure location for the pullout mode. For the interfacial mode, the bigger the nugget size, the higher the interfacial resistance to shearing. For the pullout mode, increasing the nugget diameter increases the nugget resistance against rotation and, therefore, increases the required force for necking/cracking at failure location. In both cases, increasing the weld nugget size increases the required force and energy for failure to occur. In summary, the increasing peak load and failure energy with increasing FZ size can be attributed to the transition of the failure mode from interfacial to pullout by increasing the FZ size and increasing the overall bond area in both failure modes by increasing the FZ size. Therefore, according to Figs. 7 and 8, it can be concluded that the weld FZ size is the main controlling factor of the RSW mechanical properties in terms of peak load and energy absorption.
Conclusions
From the results of this study, the following conclusions can be drawn.
The fusion zone microstructure of HSLA/DQSK dissimilar RSW exhibits a complex microstructure of upper bainite, martensite, allotriomorphic ferrite and Widmanstätten ferrite. The peak hardness in the HAZ of HSLA was greater than the FZ hardness due to the higher hardenability of HSLA.
Increasing the welding current alters the failure mode from interfacial failure mode to pullout mode. A minimum FZ size of 4·1 mm is required to ensure the pullout failure mode during the tensile–shear test.
The proposed analytical model successfully predicts the critical weld FZ size for HSLA spot welds. According to this model, a low FZ hardness to failure location hardness ratio increases the tendency of the spot weld failure to occur in the interfacial failure mode during the tensile–shear test. The metallurgical characteristics of the welds should be considered to predict and analyse the spot weld failure mode more precisely.
Fusion zone size proved to be the most important controlling factor of the spot weld peak load and energy absorption primarily due to the increasing overall bond area caused by increasing FZ size and also as a consequence of the transition in the failure mode from interfacial to pullout.