
Abstract
This study sets out to compare the wt-% CaOslag and Al2Oslag 3 in the binary system of CaO–Al2O3 that were measured in the top slag before teeming, the CaOincl and Al2Oincl 3 in calcium aluminates that were analysed by scanning electron microscopy of the steel samples and the CaOcalc and Al2Ocalc 3 that were achieved from theoretical calculations using the total measured elements in the top slag and steel before teeming. The CaOincl and Al2Oincl 3 in all of the calcium aluminate inclusions of this study did not have the same ratio; in the opposite, they covered a large range. The average CaOincl and Al2Oincl 3 in all samples had nearly similar compositions that were close to the border of the phase Ca12Al14O33 in the binary phase diagram of CaO–Al2O3. The CaOslag and Al2Oslag 3 in all samples had almost similar compositions that were close to the border of the phase Ca3Al2O6 in the binary phase diagram of CaO–Al2O3. The results of theoretical calculations were close to the CaOslag and Al2Oslag 3, but they did not follow the same maximum and minimum tendencies of CaOslag and Al2Oslag 3.
Introduction
One of the continuing demands at Ovako Hofors AB is to reduce sulphur and total oxygen content of bearing steels. Regarding sulphur content, it is believed that sulphides can act as crack initiators, and concerning total oxygen content, it is known that due to oxide inclusions, rolling contact fatigue life may be reduced even when the oxygen content is <10 ppm.1
The harmful effects of oxide inclusions on the fatigue properties of steel parts are highly dependent on their respective compositions, volume fractions, distributions and morphologies.2 – 4 Generally, big, unbreakable inclusions are the most unwanted ones, and compared with these inclusions, small, breakable inclusions or those with low melting temperatures are preferred.3, 5, 6
In most of the metallurgical secondary treatment plants of steelmaking companies, slag, steel and ladle are involved. The compositions of slag and steel are very important factors for reaching the desired final steel products, and they have a crucial effect on the type and properties of non-metallic inclusions. There have been many studies7 – 28 in order to measure, calculate or simulate the composition of non-metallic inclusions.
In this work, we investigate if there is any relation between the wt-% CaO and Al2O3 in the binary system of CaO–Al2O3 of calcium aluminates (CaOincl and 


Steel melting plant of Ovako Hofors AB
Figure 1 presents the general scheme of the steel melting plant of Ovako Hofors AB and the respective sampling positions. Scraps are melted in the 100 t, bottom tapped electric arc furnace. The molten metal is tapped into the ASEA-SKF ladle furnace station; then, by means of the ferro silicon and ferro aluminium that were added during the tapping process, molten steel is deoxidised. Then, the slag that is the result of this deoxidation is skimmed, and the ladle filled with molten steel is sent to the ladle treatment station. In the ladle furnace, synthetic top slag that is mainly composed of CaO and Al2O3 is put on the molten steel, and then the melt is desulphurised, deoxidised, its alloying composition adjusted, vacuum degassed in order to remove the hydrogen of the molten steel, gas and magnetic stirred, possibly reheated and, finally, after the temperature of the melt is adjusted to the desired temperature, poured into 24 ingots each having a capacity of 4·2 t.
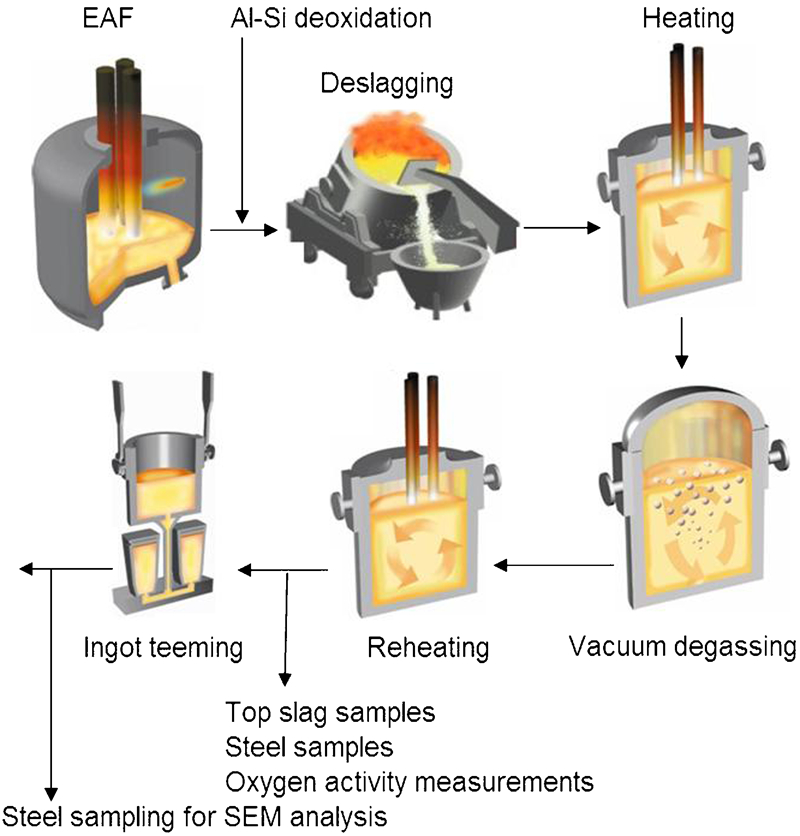
Melting plant scheme of Ovako Hofors AB and respective sampling positions
Theoretical background
By assuming the hypothesis that in case of having a semiequilibrium between slag and steel in the ladle furnace after the vacuum degassing process and before teeming, it could be concluded that the chemical composition of non-metallic inclusions that are present in molten steel should be affected by the chemical composition of the top slag. In this study, four steel heats of grade SAE 52100 with the nominal chemical composition that is shown in Table 1, which were produced by Ovako Hofors AB, were chosen; then, we evaluated this hypothesis by comparing the CaOslag and 


Nominal chemical composition of steel grades SAE 52100/wt-%
For calculating CaOincl and 


Total amount of elements in top slag and steel measured in four different heats used for theoretical calculations
Experimental
In this study, four steel heats of grade SAE 52100 with the nominal chemical composition that is shown in Table 1 were chosen, and then CaOincl and 


In order to perform SEM analysis for calculating CaOincl and 
Cutoff criteria for chemical composition of selected calcium aluminates/wt-%
Cutoff criteria for optical properties of selected calcium aluminates
The reason for choosing bar samples instead of lollipop samples was because it was one of the objectives of this study to find out if it was possible to predict the morphology and types of inclusions in the products by knowing the top slag and molten steel amount and compositions during the ladle treatment process. Thus, oxides in the bar samples were supposed to represent the same inclusion types of the final product without considering the effect of reduction ratio on them.
After separating the calcium aluminates according to the cutoff criteria mentioned in Tables 3 and 4, the composition of these non-metallic inclusions was normalised to Ca, Al, Mg and S. It was then assumed that all the available Mg in these calcium aluminates form the spinel phase (MgAl2O4) and that the rest of the Al would, together with the available Ca, form calcium aluminates with different Ca/Al ratios (the available Ca was assumed to be the rest of the Ca that had already formed the CaS phase with all available S).
It should be mentioned that in some calcium aluminates, Mg was found as pure MgO; these inclusions were here considered as exceptions and were excluded from the results. The total number of observed and excluded calcium aluminates and the total scanned area for each sample are shown in Table 5.
Scanned area of four steel samples
The achieved SEM results attained as explained above were normalised to the binary system of CaO–Al2O3, and then CaOincl and 


Sample analysing methods
Figure 1 shows the sampling position for the tested heats. For all the tested heats, one steel sample (lollipop) and one slag sample were taken. All lollipop samples were tested by two testing instruments as follows: OES ARL 4460 Metal analyser from Thermo Fisher Scientific Inc. was used for metal analyses, and the instrument called Leco CS-444 was used in order to analyse the sulphur and carbon contents of the samples; this instrument works based on the carbon–sulphur combustion method (ASTM E1019). All slag samples were analysed by an X-ray fluorescence instrument called PANalytical AxiosmAX- Minerals.
The Celox instrument30 that was equipped with consumable MgO stabilised ZrO2 electrodes was applied in order to measure the oxygen activity of molten steel.
For scanning the steel samples regarding the non-metallic inclusions, the analytical SEM brand Leo Supra 35 was used, and the INCA feature software29 was employed for the analysis and classification of non-metallic inclusions, using energy dispersive X-ray microanalysis.
Results
Figures 2 and 3, which were taken using the element mapping feature of the INCA feature software29 by applying energy dispersive X-ray microanalysis, show the SEM–energy dispersive spectroscopy (EDS) mapping analysis of two of the observed calcium aluminates considered in this study.
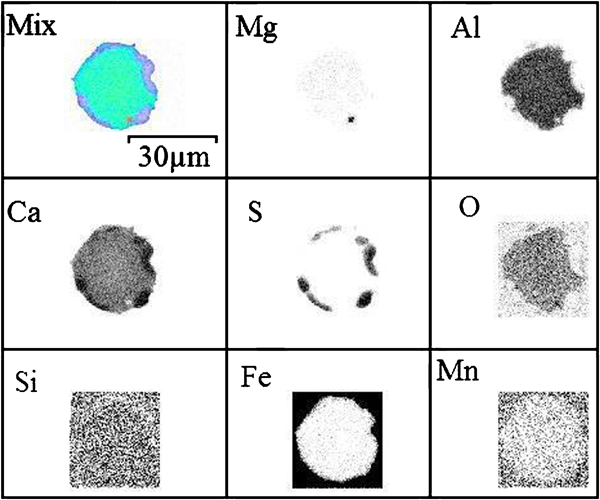
Scanning electron microscopy–EDS mapping analysis of one of observed calcium aluminates
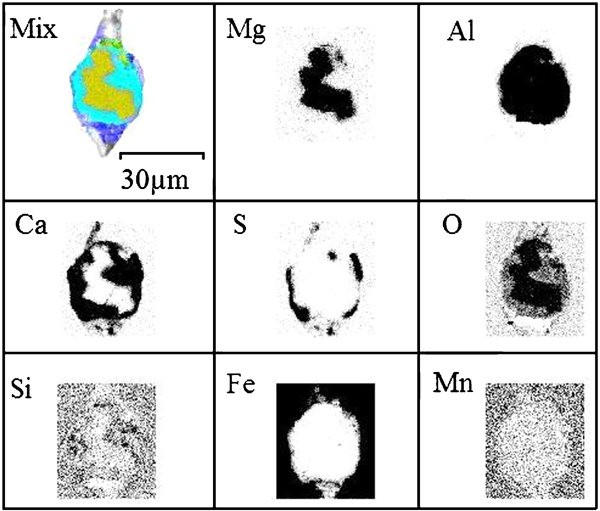
Scanning electron microscopy–EDS mapping analysis of one of observed calcium aluminates
Table 6 shows the statistical summaries for all calcium aluminates achieved from the SEM analysis of four samples of this study.
Statistical summaries for all calcium aluminates observed in this study
Figure 4 presents CaOincl, CaOslag and CaOcalc in all four samples of this study. In this figure, there are also two other lines indicating one standard deviation above and one standard deviation below the average CaOincl. Figure 5 presents 


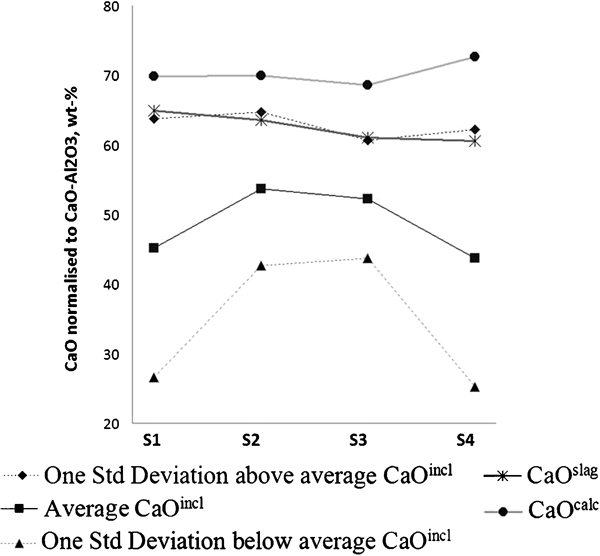
Measured and calculated CaOincl, slag, calc in all four samples of this study
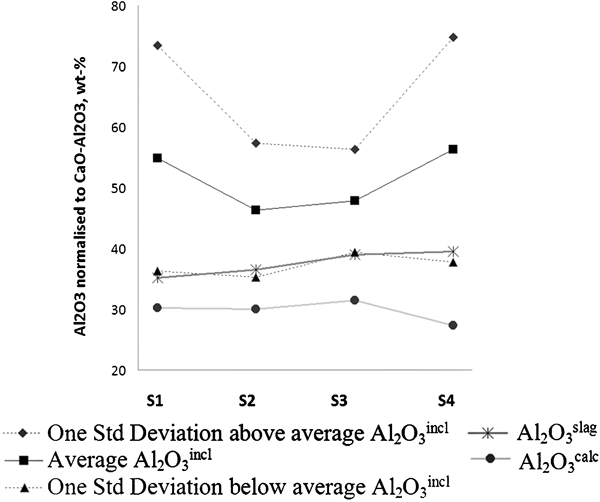
Measured and calculated Al2O3 incl, slag, calc in all four samples of this study
Figure 6 shows the calculated and measured positions of CaOincl, CaOslag and CaOcalc in all four samples of this study in the binary phase diagram of CaO–Al2O3.31 In this figure, there are also two other lines indicating one standard deviation above and one standard deviation below the average CaOincl in four different samples of this study.
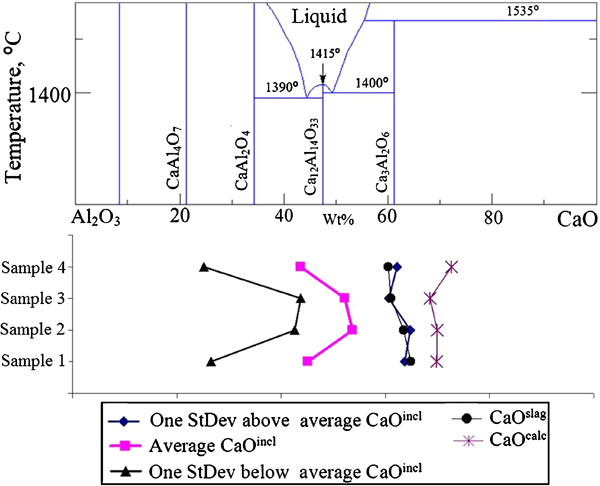
Calculated and measured positions of CaOincl, slag, calc in all four different samples of this study in binary phase diagram of CaO–Al2O3 (Ref. 31)
Figure 7 presents the ternary diagram of the calcium aluminates in one of the four samples of this study. This diagram shows the ratio of CaO/Al2O3/MgO of the inclusions and their respective equivalent circle diameters (ECDs) in micrometres. In this figure, liquidus surfaces with isotherm lines every 100°C were calculated by means of Thermo-Calc software.32
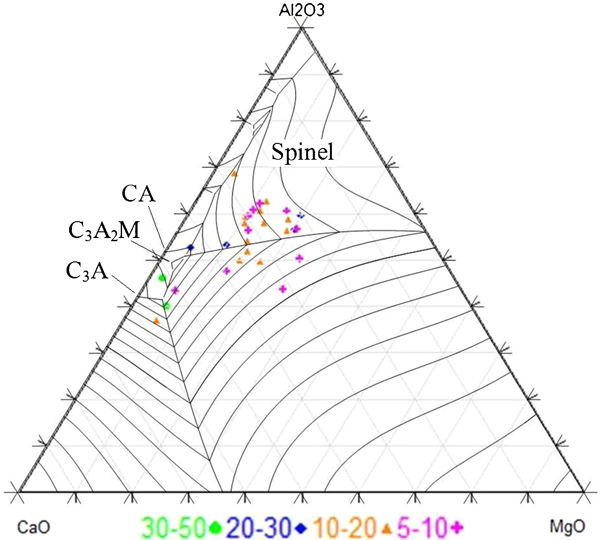
Equivalent circle diameters (μm) of calcium aluminates in one of samples
In Fig. 7, a clear relationship between the chemistry and size of inclusions could be observed, i.e. the larger the inclusion, the more Ca it contains. This fact could be more clarified by Fig. 8; this figure presents wt-%Ca versus wt-%Al in all of the oxides that were observed in all four samples of this study, and the bubble sizes represent the ECDs of the inclusions.
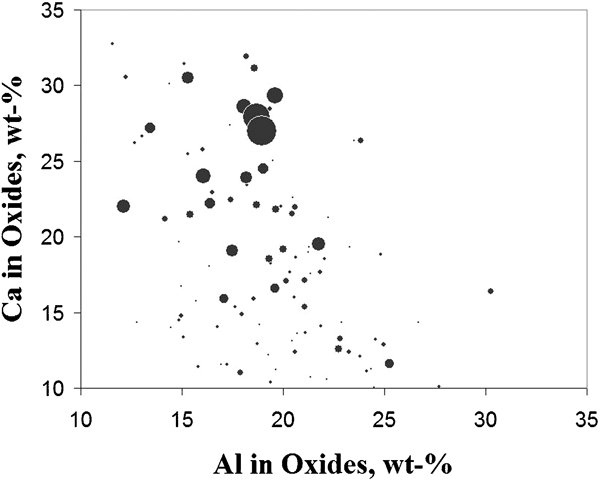
wt-%Ca versus wt-%Al observed in all samples: bubble sizes represent ECDs of oxides
Discussion
In this study, it was assumed that in the calcium aluminates that were considered, most of the times the available Mg bounded with Al and appeared as a spinel phase, and then the rest of the Al that was not bounded to the Mg would form phases that were composed of Ca and Al with different ratios of these two elements (the available Ca was assumed to be the rest of the Ca that had already formed the CaS phase with all available S). However, sometimes, Mg could be found as pure MgO that did not form the spinel phase. These inclusions were treated as exceptions and were not considered in this study.
Regarding these calcium aluminates, it should be mentioned that some amounts of Ca were bounded with Si; however, in this study, this amount was neglected. This neglection of Si was because of the fact that the Si contents of the calcium aluminates of this study were always <4 wt-%, and the steel matrix of steel grade SAE 52100 consisted of about 0·2–0·35 wt-%Si; the measured Si amount of the inclusions, especially the small ones, could not be relevance (due to the Si that is present in the steel matrix, Si contents of the inclusions were measured higher than the true amount of Si). It was therefore decided to neglect Si and concentrate on the amounts of Mg, Ca, Al and S in the inclusions.
By regarding Figs. 4 and 5, it was clear that the CaOincl and 
By considering Figs. 4 and 5, it could also be concluded that the results that were theoretically calculated were close to CaOslag and 

By considering Fig. 6, it could be seen that the average CaOincl and 

These results clearly indicate that the top slag, steel and inclusions of this study did not reach equilibrium; however, there were clear indications that they had obvious trends to reach some equilibria. For instance, the chemical composition of calcium aluminates tended to reach equilibrium at the eutectic point in the binary phase diagram of CaO and Al2O3. Moreover, it could be mentioned that the assumption that the top slag–steel systems were closed systems that did not react with the factors outside was not necessarily true, and high probably contents of Mg, O and N could change; however, these changes were not big enough to affect the calculated results of this study.
It should also be considered that the results that were achieved from the SEM analysis might have some errors that could be due to sampling, machining, polishing, analysing techniques and interpreting the results.
Conclusions
The following statements briefly point out the achieved results in this study.
In the calcium aluminates, Mg was often seen as spinel, and Al that did not form spinel formed calcium aluminates with different amounts of CaOincl and 
The CaOincl and 
The average CaOincl and 
The CaOslag and 
The results of theoretical calculations were close to CaOslag and 
