
Abstract
This article sets out to study the development of oxide inclusions during the vacuum degassing process at the ASEA-SKF ladle furnace. During the degassing process, five steel and top slag samples were taken, and their chemical compositions were analysed. All steel samples were further analysed by scanning electron microscopy. It was concluded that the vacuum degassing process was a dynamic process during which spinel and calcium aluminate inclusions were dominant. In addition, it was seen that during this process, the percentage share of calcium aluminates compared with spinels, the Ca weight per cent content of the oxides, the average equivalent circle diameter (ECD) of the oxides and the percentage share of the oxides with bigger ECD were increasing, and the oxides tended to form more round shapes.
Introduction
One of the continuing demands at the Ovako Hofors AB steel plant is decreasing the total oxygen (TO) content of the steels produced. By considering oxide inclusions, TO content is a general representative of steel cleanness, and it is known that due to oxide inclusions, rolling contact fatigue life of steel products may be reduced, even when the TO content is <10 ppm.1
The destructive effects of oxide inclusions on the fatigue properties of some steel parts are known to be highly dependent on their respective chemical compositions, volume fraction, dispersions and morphologies.2 – 4 Usually, large, unbreakable oxide inclusions are the most unwanted types because these could result in possible material failures; the more preferable types are small, breakable inclusions or those with low melting temperatures.3, 5, 6 However, it should also be mentioned that non-metallic inclusions (NMIs) with very low melting points may also be devastating because they may be trapped and accumulate inside the interdendritic areas of the cast material during solidification process.
The vacuum degassing process could be considered as one of the most crucial stages in the steel making process; the reason for this is because at the end of this stage, final alloying, deoxidation, desulphurisation and inclusion removal must be achieved. The degassing process is supposed to remove unwanted NMIs as much as possible and result in a cleaner, more homogeneous steel melt. However, it is difficult to calculate the optimised vacuum degassing time that would result in the most favourable results. Because of the negative effects on the production capacity and consumption of resources, long degassing time should be avoided, unless lower degassing time might reduce the steel cleanness. There have been many studies regarding kinetic development of NMIs.7 – 31 This article sets out to get a view about the behaviour of non-metallic oxide inclusions during the vacuum degassing process.
Steel melting plant of Ovako Hofors AB
Figure 1 presents the general scheme of the steel melting plant of Ovako Hofors AB and the respective sampling positions for this study. Scrap is melted in the 100 tonne, bottom tapped electric arc furnace; then, the molten metal is tapped into the ASEA-SKF ladle furnace station, where, by means of ferro silicon and ferro aluminium, molten steel is deoxidised. The slag that is the result of this deoxidation is then skimmed, and the ladle filled with molten steel is sent to the ladle treatment station. In the ladle furnace, synthetic top slag mainly composed of CaO and Al2O3 is put onto the molten steel, and then the melt is desulphurised and deoxidised, its alloying composition adjusted, vacuum degassed, gas and magnetically stirred (possibly reheated) and finally, after the temperature of the melt is adjusted to the desired temperature, it is poured into 24 ingot moulds each with a capacity of 4·2 tonnes.
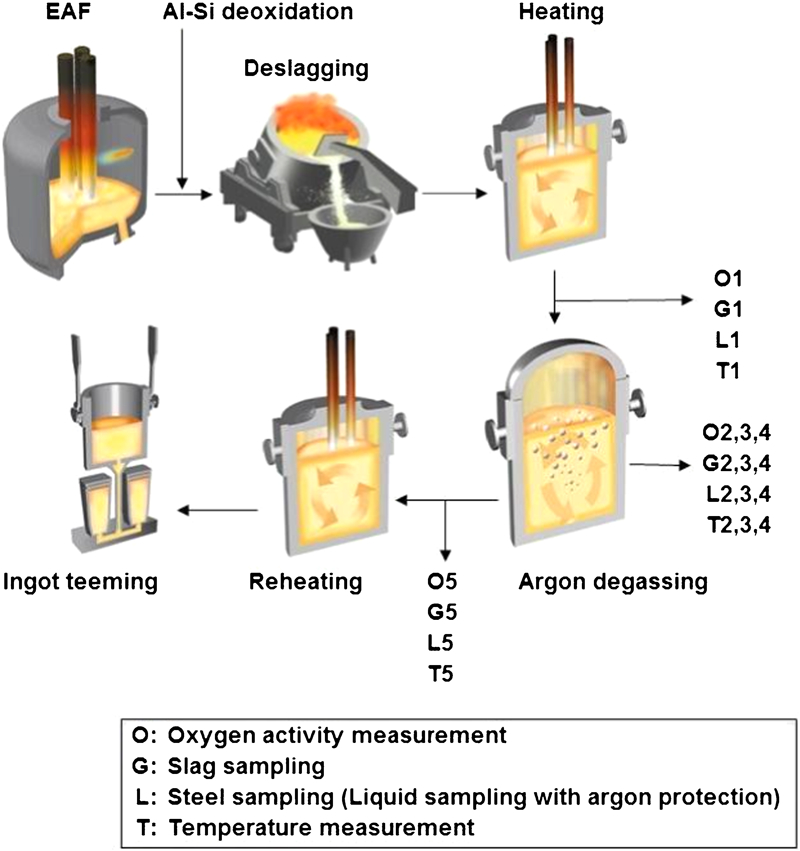
Melting plant scheme of Ovako Hofors AB and sampling positions
Methods
In this study, the development of non-metallic oxide inclusions during the degassing process was studied. In order to perform this task, it was decided to choose one steel heat grade, SAE 52100, with the nominal chemical composition that is shown in Table 1. Then, as shown in Fig. 1, five steel samples were taken: one of these samples was taken before, three others were taken during and the last sample was taken after the degassing process.
Nominal chemical composition of steel grade SAE 52100, rest is Fe/wt-%
Samples during vacuum degassing were taken according to the vacuum interruption technique, that is, stopping the vacuum pump during vacuum degassing, taking samples as fast as possible and starting the vacuum pump again; this was repeated three times. Steel samples were taken by an instrument that was designed in house for liquid sampling of steel with argon protection.32 This sampling instrument allows operators to remove the top slag by blowing argon gas and sucking the molten steel into a special sampler. At the same time that steel samples were taken, part of the top slag was taken for analysis, and oxygen activity and temperature of the molten steel were also measured.
A part of these steel samples was used for chemical analysis, and then their surfaces (after performing required preparation) were analysed by scanning electron microscopy (SEM). Then, by means of the INCA Feature software33 that is specifically developed for analysis and classification of steel inclusions using energy dispersive X-ray microanalysis, the SEM results were analysed.
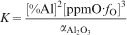
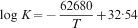
In this study, it was also decided to present the calculated oxygen activities of the molten steel at five different sampling occasions by means of equations (1)–(4).34 These equations give the true oxygen activities of the molten steel for comparison with the results measured by the Celox instrument.35 Al2O3 activities that were required for solving equation (2) were considered as 0·064.34 Equation (4) is valid at low aluminium contents: f
Al≈134


Sample analysing methods
At all five sampling occasions, one steel sample (argon protected liquid sampling)32 and one top slag sample were taken, and the temperature and oxygen activity of the molten steel were measured. All steel samples were tested by two testing instruments: an OES ARL 4460 metal analyser from Thermo Fisher Scientific Inc was used for metal analyses, and a Leco CS-444 was used in order to analyse the sulphur and carbon contents of the samples. This latter instrument works on the carbon–sulphur combustion method (ASTM E1019). A Leco TC600 was used in order to analyse the TO of the samples, and all slag samples were analysed by an XRF instrument (PANalytical AxiosmAX-Minerals).
A Celox instrument35 that was equipped with a commercial consumable MgO stabilised ZrO2 electrode was applied in order to measure oxygen activities and temperatures of the molten steel at the respective occasions of the sampling during vacuum degassing process. This instrument allows the operator to measure the oxygen activity and temperature of molten steel in situ at different stages of the steel making process. According to Nernst’s law, the difference between the oxygen activity of the electrodes and the molten steel would generate an electromotive force (EMF), and by considering this EMF, it is possible to calculate the oxygen activity of molten steel.
It should be mentioned that in Al deoxidised steels, and at low oxygen activities, the measured oxygen activity is believed to be within a factor of 2 higher than the true equilibrium oxygen activity of molten steel.34 These higher measured oxygen activities are probably due to the partial electronic conduction of the MgO stabilised ZrO2 electrodes in the molten steel that would result in higher EMF.34 However, the results calculated by equations (1)–(4) are believed to give the true oxygen activities of molten steel by considering a correction factor for partial electronic conductions of the MgO stabilised sensors.34
For scanning of the steel samples regarding oxide inclusions, a Leo Supra 35 analytical SEM was used, and for the analysis and classification of the non-metallic inclusions by means of energy dispersive X-ray microanalysis, an INCA Feature software33 was applied.
Results
Figure 2 shows sampling occasions of the five samples with the respective internal pressure of the ASEA-SKF ladle furnace. As can be seen, the first sample was taken before starting the degassing process, and three others were taken with ∼12–18 min interval from the start of the degassing; the last sample was taken after finishing the degassing process. The entire degassing process took ∼55 min.
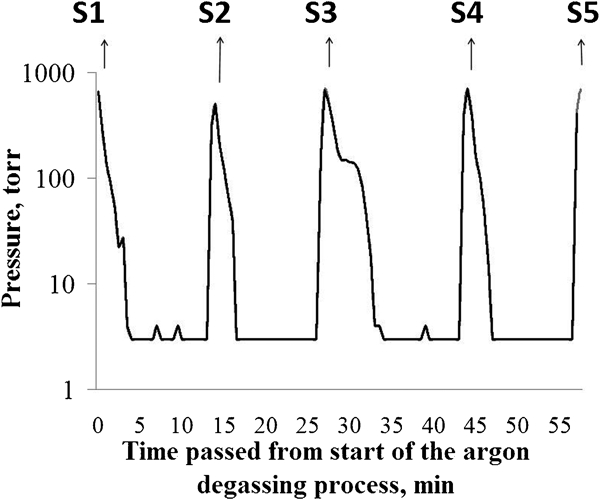
Pressure (torr) versus time (min) from start of degassing and sampling positions
Figure 3 shows the content of elements or components in the molten steel and top slag versus sample numbers, and Fig. 4 presents the temperature of the molten steel versus sample numbers.
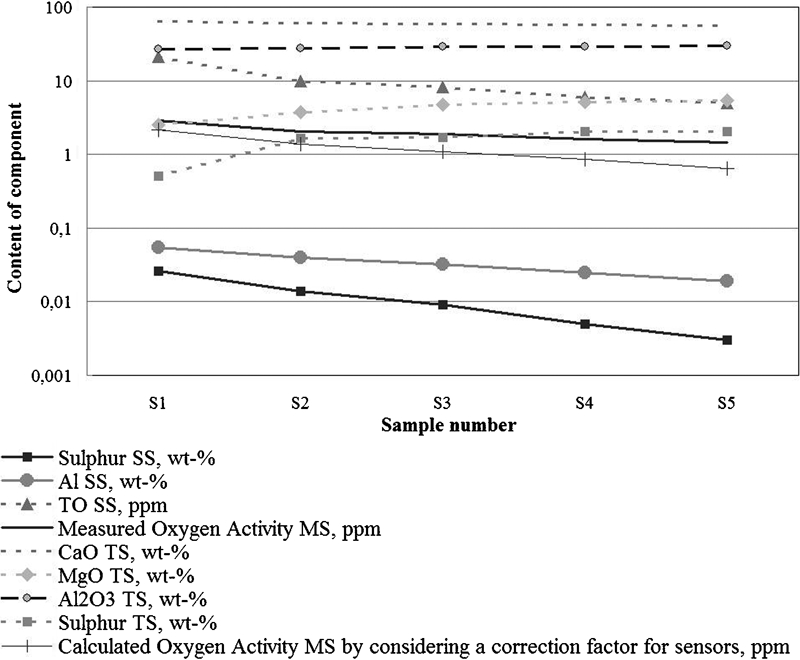
Content of element or component versus sample number (SS, solidified steel; MS, molten steel; TS, top slag)
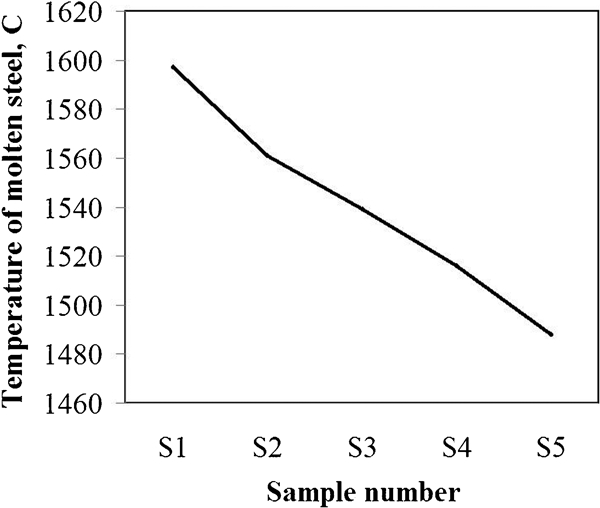
Temperature (°C) versus sample number
Table 2 shows the size of the surface area of five samples that were scanned by SEM for quantification of oxide inclusions in each sample.
Size of scanned areas for each sample
Chemical composition of oxides
Figures 5–9 were achieved from the INCA Feature software.33 These figures show the position of all of the oxides (which were found and analysed by SEM) in ternary diagrams of Al2O3, CaO and MgO in five samples of this study.
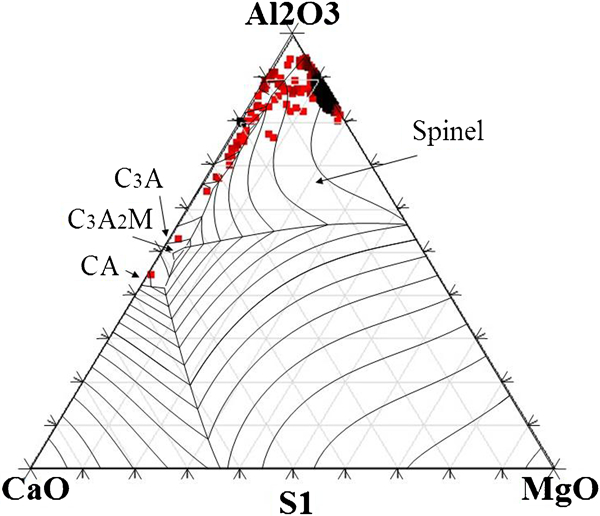
Oxides observed in sample S1
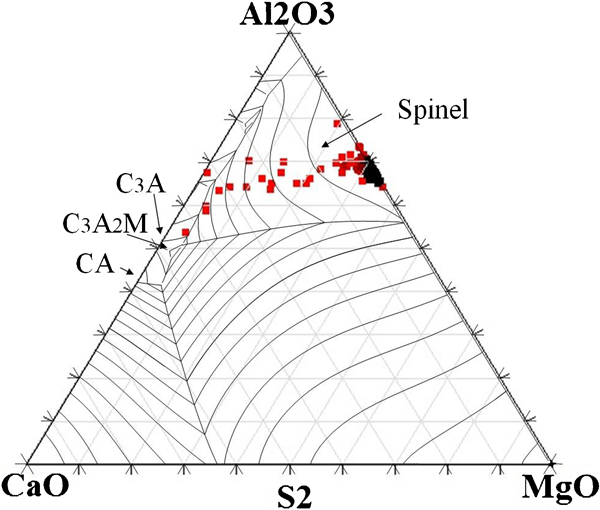
Oxides observed in sample S2
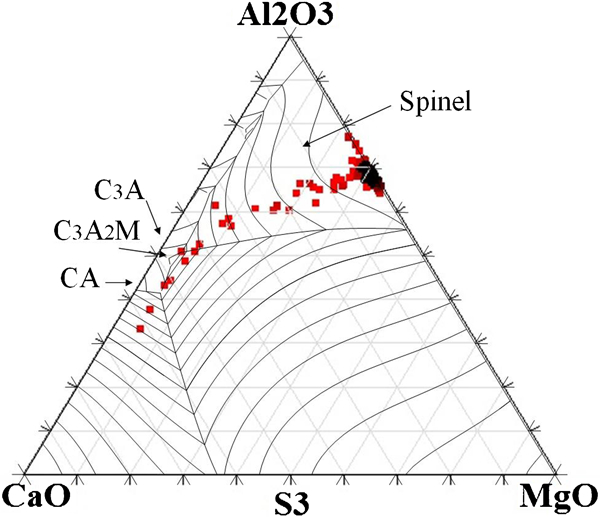
Oxides observed in sample S3
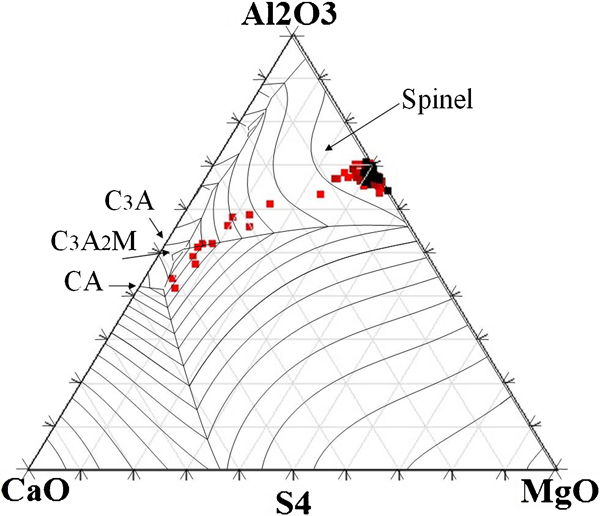
Oxides observed in sample S4
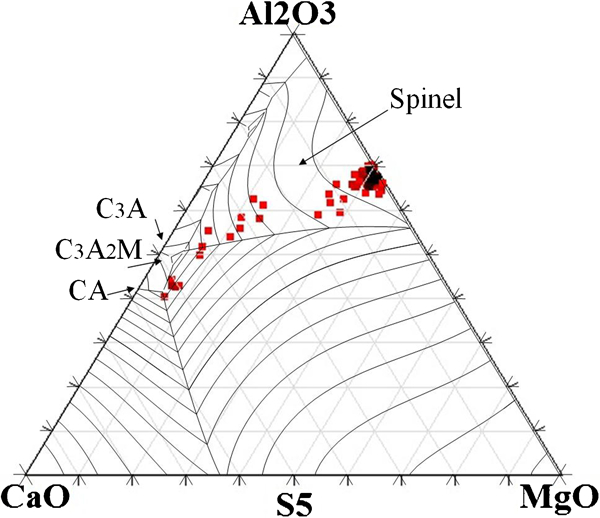
Oxides observed in sample S5
All of the five samples showed two distinct populations of oxide inclusions: spinel [(MgAl)x(O)y] and calcium aluminate [(Ca–Al–Mg)x(O–S)y]. Figures 10 and 11 show examples of typical SEM-EDS mapping analysis of these two main inclusion types. Figure 10 shows a typical calcium aluminate, and Fig. 11 shows a typical spinel (the darker areas are those parts of the inclusions that respective elements exist).
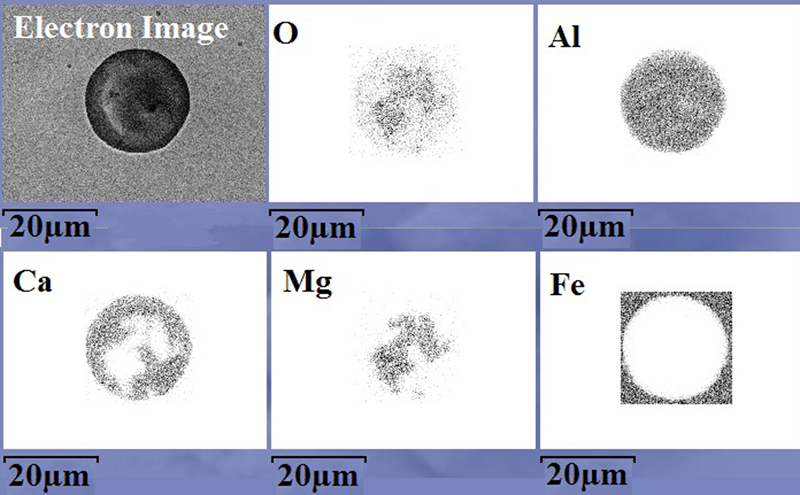
Mapping analysis (SEM-EDS) of typical calcium aluminate
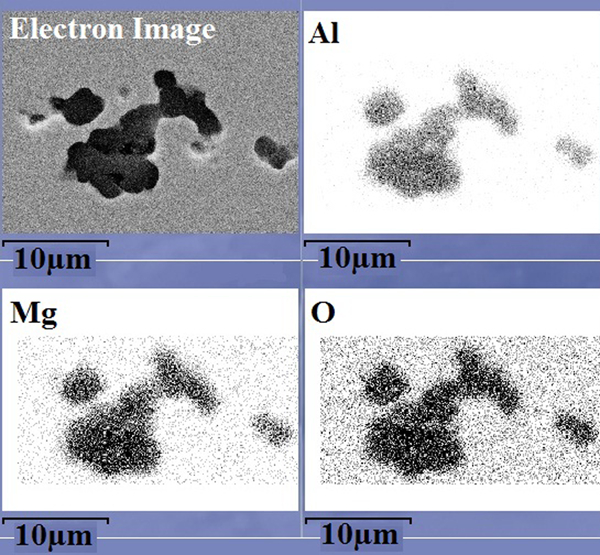
Mapping analysis (SEM-EDS) of typical spinel
Figure 12 shows the percentage share of all spinels and calcium aluminates of all oxides that were observed by the SEM analysis in the five different samples of this study.
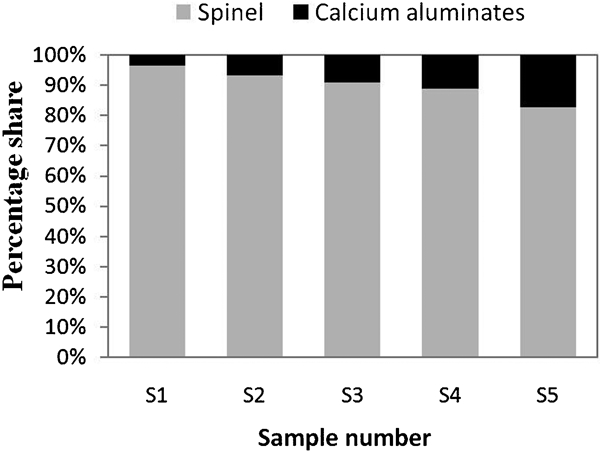
Percentage share of oxides in five samples of this study
Figure 13 shows the weight per cent ratio of the respective elements in all the observed oxides of the five samples. This figure shows the changes in weight per cent Ca divided by Mg, Al divided by Ca and Al divided by Mg in the five samples.
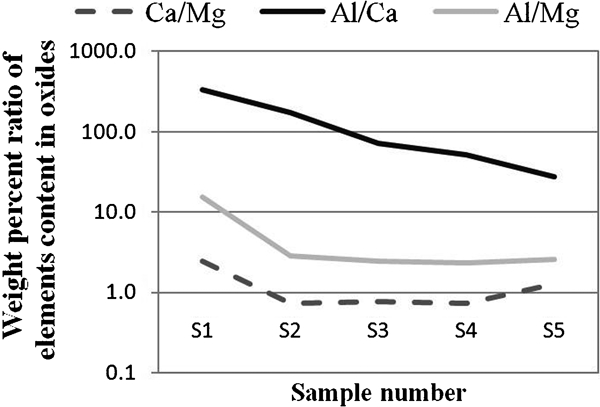
Weight per cent ratio of respective element contents in five samples of this study
Size distribution of oxides
Figure 14 shows the average equivalent circle diameter (ECD) in micrometres in the five samples, and Fig. 15 shows the percentage share of ECDs in micrometres in five samples. In this figure, oxides, independent of their chemical composition, were separated into four classes. The minimum ECD of the considered oxides was 5 μm. Figure 16 has the same purpose as Fig. 15, but it considers oxides with minimum ECDs of 15 μm.
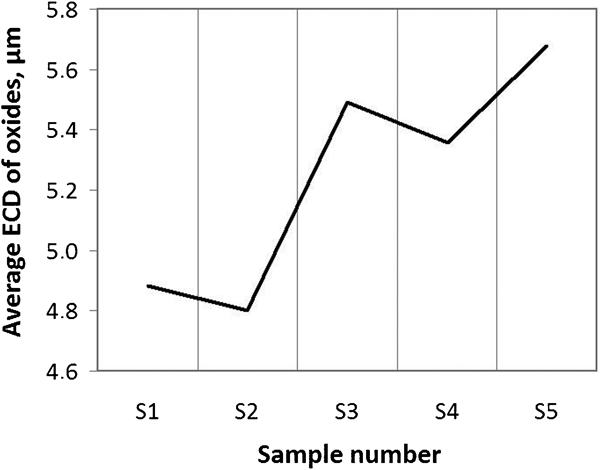
Average oxide ECD (μm) in five samples of this study
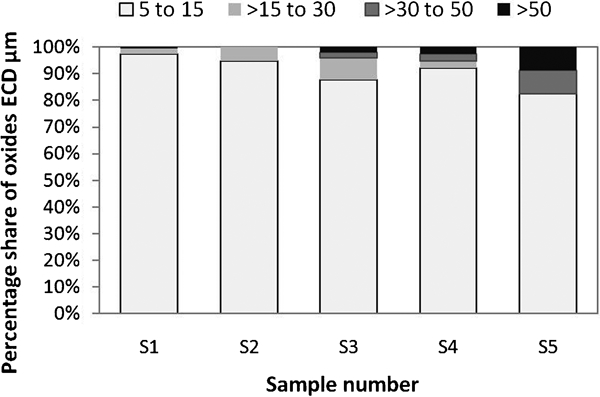
Percentage share of oxide ECD (μm) in five samples of this study
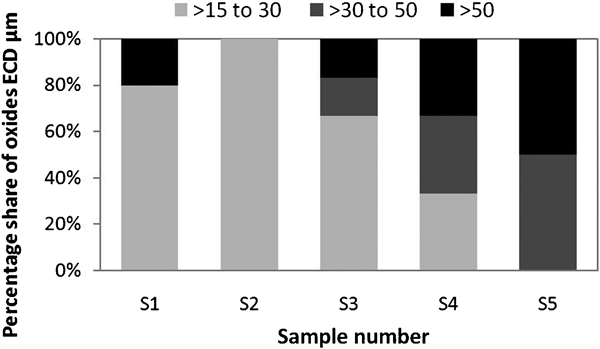
Percentage share of oxide ECD (μm) in five samples of this study
Size and chemistry relations of oxides
Figure 17 shows the average ECDs (μm) of the spinels and calcium aluminates of all five samples, and Figs. 18–22 show wt-%Ca versus wt-%Al in all oxides observed by SEM; the bubble size in the figures represents the ECDs (μm) of these oxides. Figure 23 presents the aspect ratio of oxides (ratio of the width of the oxide to its height) versus sample number; in this figure, the average aspect ratios of the oxides were measured by SEM, and then, by calculating the standard deviation of the average aspect ratio distribution, two other series were considered and shown in this figure: average aspect ratio plus one standard deviation and average aspect ratio minus one standard deviation.
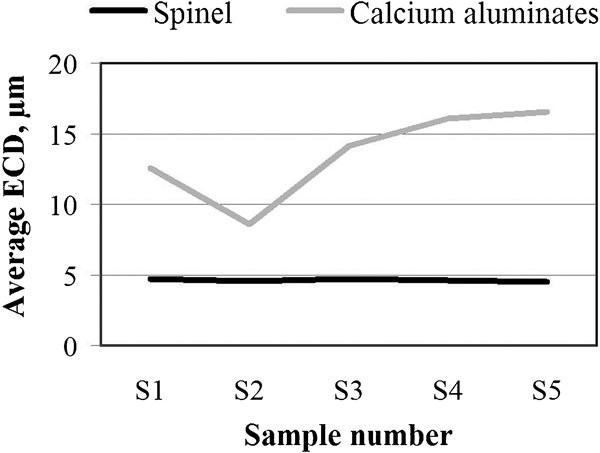
Average ECDs (μm) of spinels and calcium aluminates versus sample number
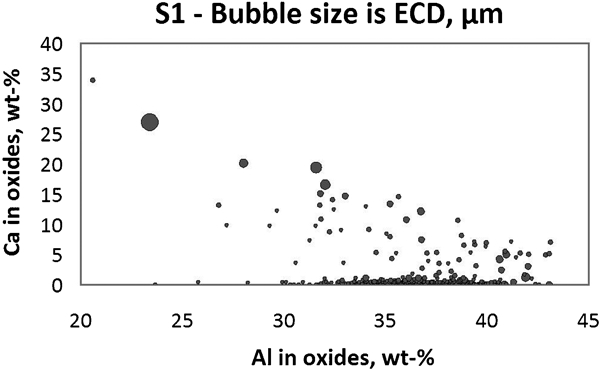
wt-%Ca versus wt-%Al in oxides of sample S1: bubble sizes show ECDs (μm) of these oxides
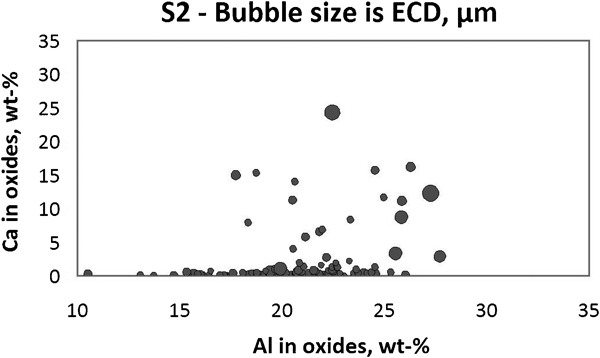
wt-%Ca versus wt-%Al in oxides of sample S2: bubble sizes show ECDs (μm) of these oxides
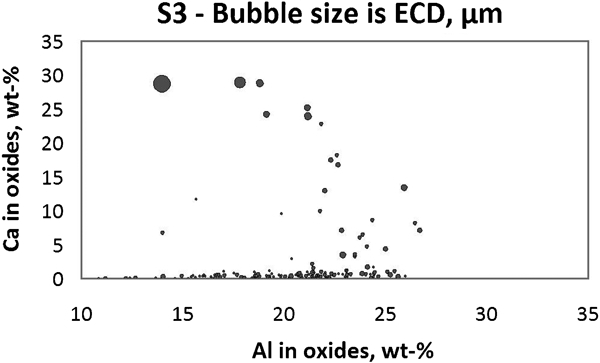
wt-%Ca versus wt-%Al in oxides of sample S3: bubble sizes show ECDs (μm) of these oxides
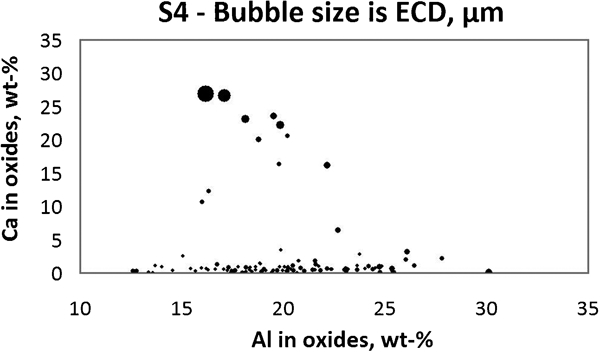
wt-%Ca versus wt-%Al in oxides of sample S4: bubble sizes show ECDs (μm) of these oxides
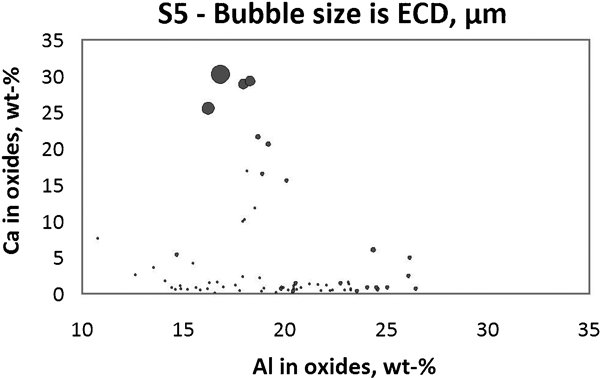
wt-%Ca versus wt-%Al in oxides of sample S5: bubble sizes show ECDs (μm) of these oxides
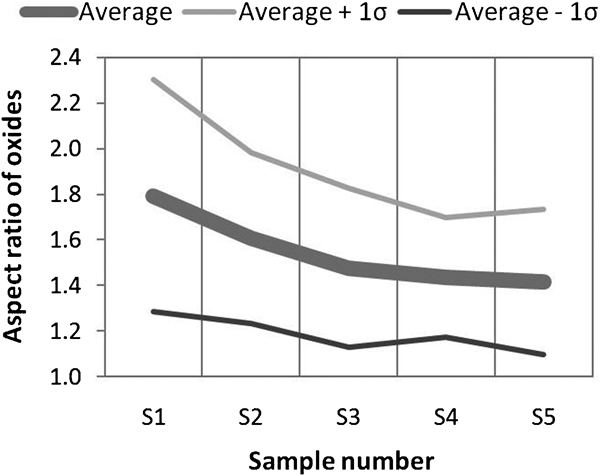
Aspect ratio of oxides (average, average+σ and average−σ) versus sample number
Discussion
In this study, the development of oxide inclusions during the vacuum degassing process at ASEA-SKF ladle furnace was investigated. One steel heat grade SAE 52100 was chosen, and five steel and top slag samples were taken. All these samples were analysed, and the results were shown.
By examining Figs. 3 and 4, it can be mentioned that the vacuum degassing process is a dynamic process, and during this process, several factors were changing. Alloying content of the molten steel and top slag composition were changing, and, very importantly, the temperature of the molten steel was constantly decreasing. All these changes could contribute to changes in thermodynamic equilibrium of the top slag and molten steel in all these samples.
By considering the chemical composition results achieved by the SEM from analysis of the oxides in all five samples or by considering Figs. 5–9, it could be said that two main types of oxide inclusions were dominant: spinel and calcium aluminates. It is obvious that after ∼15 min from the start of the degassing process, these two populations were separating, and at ∼45 min, these two populations were distinguished more clearly. This is clear in Fig. 12, where during the degassing process, the percentage share of the calcium aluminates, compared with spinels, was increasing, or as shown in Fig. 13, the Ca wt-% ratio of the oxides was increasing or a larger part of the oxides is composed of Ca.
By considering the size distribution results achieved by the SEM from the analysis of the oxides in all five samples or by considering Figs. 14–16, it could be said that the average ECDs of the oxides during vacuum degassing were increasing or the percentage share of the oxides with bigger ECDs was increasing.
From Fig. 17, it could be concluded that during degassing, the average ECDs of spinels were constant (∼5 μm), but the average ECDs of calcium aluminates were increasing. By considering Figs. 18–22, it could be concluded that oxides with larger ECDs were observed when the Ca content of such inclusions increased and the Al content decreased.
As a consequence of the above mentioned results, it could be concluded that during the vacuum degassing process of the ASEA-SKF ladle furnace, the ECD and Ca content of the oxides increases, and these oxides tend to form round shapes with aspect ratios that approach 1, as shown in Fig. 23.
It should, however, be mentioned that oxide inclusions with bigger ECDs could generate a dilemma because, due to their bigger sizes, they might leave molten steel easier, but they could also have very negative effects if they do not manage to leave the molten steel into top slag or become entrapped inside steel and appear in the final solidified ingots. Consequently, it could be said that although oxide ECDs during degassing become bigger, the authors of this article could not conclude if the number of oxides per scanned area was reducing or increasing. This is due to the fact that SEM parameters, sample preparation procedures, sample handling, etc. for each analysis could slightly differ that would affect the results.
Summary
The results achieved from this study can be summarised in that during the vacuum degassing process we had the following.
Spinel and calcium aluminates were the dominant types of inclusions.
Several factors like temperature, steel-top slag compositions, etc., were changing.
The percentage share of calcium aluminates, compared to spinels, was increasing.
The Ca weight per cent content of oxides was increasing.
The average ECDs of spinels were constant (∼5 μm).
The average ECDs of calcium aluminates were increasing.
The percentage share of oxides with bigger ECDs was increasing.
The oxides tended to form round shapes.
The TO of the samples was decreasing.